Word Cloud: When It Helps and When It Misleads
 By Tony Astor ·

Word Cloud
A word cloud is a visual representation of text data in which each word is sized according to how frequently it appears in the source text, so more common terms display larger and less common terms shrink. This lets viewers quickly identify dominant themes and recurring vocabulary without reading the underlying data.
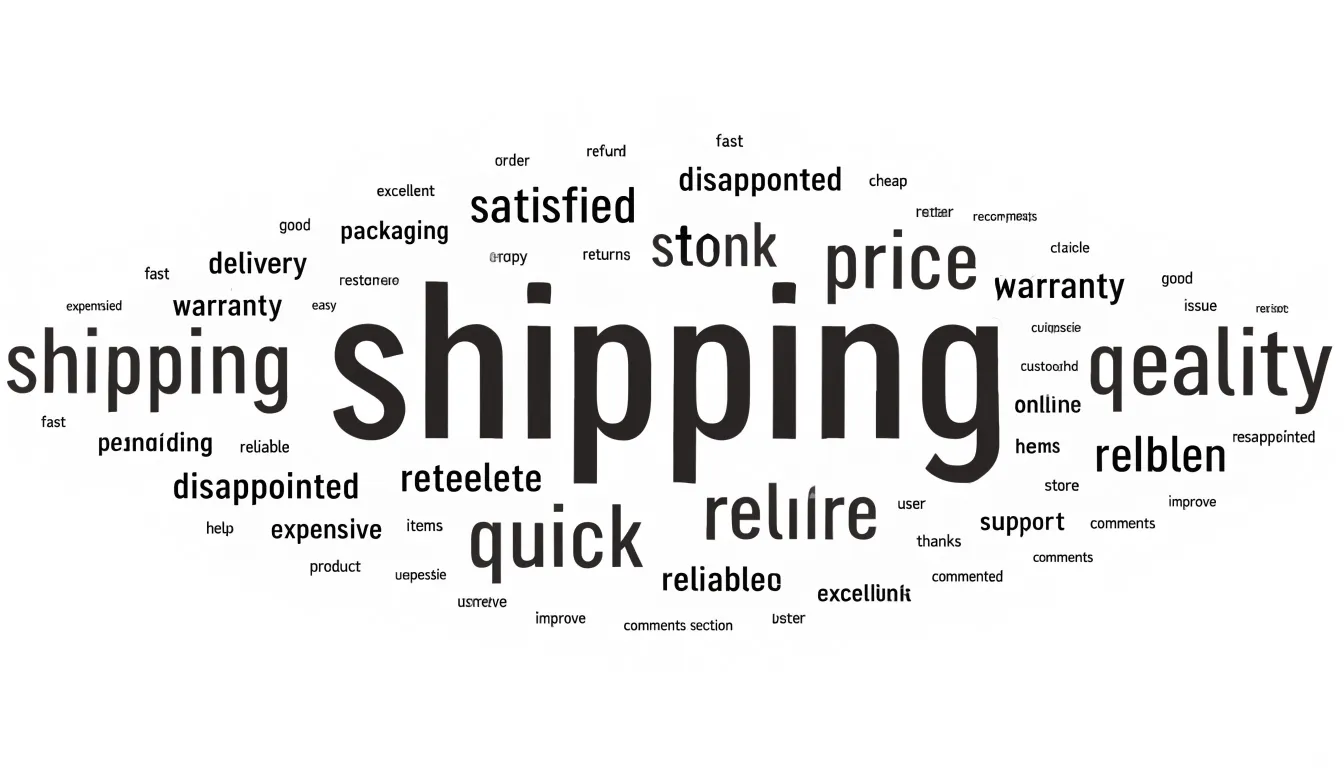
Table of Contents
Word Cloud
A word cloud takes a body of text and turns it into a picture. Each word from the source material is displayed on the canvas, and its size corresponds directly to how frequently it occurs. The more often a term is used, the larger it appears; less common terms shrink accordingly. This simple mapping between count and visual scale lets a viewer glance at the graphic and, within seconds, identify dominant themes and recurring vocabulary without reading a single line of the underlying data.
This instant readability explains much of the format’s popularity. A word cloud requires no training to interpret. There are no axes to decode, no legends to cross-reference, and no statistical concepts to grasp. A non-technical stakeholder, an executive skimming a report, or a member of the public encountering a dataset for the first time can all extract the headline message at a glance. The visual weight of the largest words draws the eye naturally, lowering the barrier to entry between raw text analysis and audiences who may never engage with a spreadsheet or a frequency table.
The format is also engaging on an aesthetic level. A well-made word cloud fills space with varied shapes and colors that invite attention in a way a plain ranked list rarely does. It transforms a count of terms into something approachable and even playful. For presentations, dashboards, and public-facing summaries, this encourages people to look at the data at all, delivering a quick, inviting summary of what a corpus is about.
Word Cloud
When a team faces a large volume of survey responses or product reviews, the sheer quantity of unstructured text can make it difficult to know where to begin. A word cloud offers a practical starting point by surfacing the most frequent terms, allowing an analyst to spot recurring themes—such as shipping delays, pricing concerns, or particular product features—without reading every response line by line. Some tools also allow filtering by category or time period, which helps teams compare themes across different customer segments or track how concerns shift from one quarter to the next.
A word cloud works best as an exploratory tool that precedes deeper analysis. Frequency alone does not reveal whether a commonly mentioned term reflects praise or complaint; a word like “price” may appear in positive comments about value and in negative comments about cost. Treating the word cloud as a first look gives analysts a set of hypotheses and a shortlist of themes worth investigating in the full text. From there, sentiment analysis, manual tagging, or topic modeling can add the nuance and direction that the visual overview cannot provide on its own.
Word Cloud
Interactive word clouds have become a practical tool for teachers and presenters who want to turn a passive audience into an active one. Participants submit words or short phrases through their phones or laptops, and the cloud updates live on the main screen. This visible feedback loop gives every contributor a sense of influence over the shared display.
In a classroom, a teacher might open a lesson by asking students to submit one word describing how they feel about a topic, then use the resulting cloud as a springboard for discussion. Teachers also use word clouds for quick formative assessment, asking a class to summarize a concept in a single term so misconceptions stand out in the visual weight of the display. During brainstorming sessions, groups can pool ideas on a project theme and watch clusters of related terms emerge without anyone having to wait for a turn to speak. Presenters at conferences and workshops use the same technique to gather audience questions, surface common concerns, or capture reactions after a keynote, which keeps remote and quiet participants involved alongside vocal ones.
Because the tool is low-effort and anonymous by option, it lowers the barrier for hesitant contributors, including English language learners and students who avoid raising hands. The real-time activity creates a shared focal point, and the resulting artifact can be saved, screenshotted, or revisited later as a record of group thinking.
Word Cloud
To illustrate the practical application of word clouds, consider a dataset of perfume reviews. These reviews, often rich in sensory language, provide an ideal corpus for textual analysis. After preprocessing the text and calculating term frequencies, a word cloud creates an immediate visual hierarchy of scent vocabulary.
In a typical perfume review dataset, certain descriptors emerge prominently:
- Dominant notes: Words like “citrus,” “floral,” and “vanilla” often appear in large font. “Citrus” might encompass sub-descriptors such as “lemon,” “bergamot,” and “orange,” which could also appear individually. “Floral” may be represented by specific flowers like “rose,” “jasmine,” or “lavender.” “Vanilla” frequently stands alone as a note, often associated with warmth and sweetness.
- Secondary descriptors: Other common terms include “woody,” “musk,” “fresh,” “spicy,” and “sweet.”
- Co-occurring clusters: Related terms like “citrus” and “fresh” might appear near each other, reflecting their frequent co-occurrence in descriptions of light, summery fragrances.
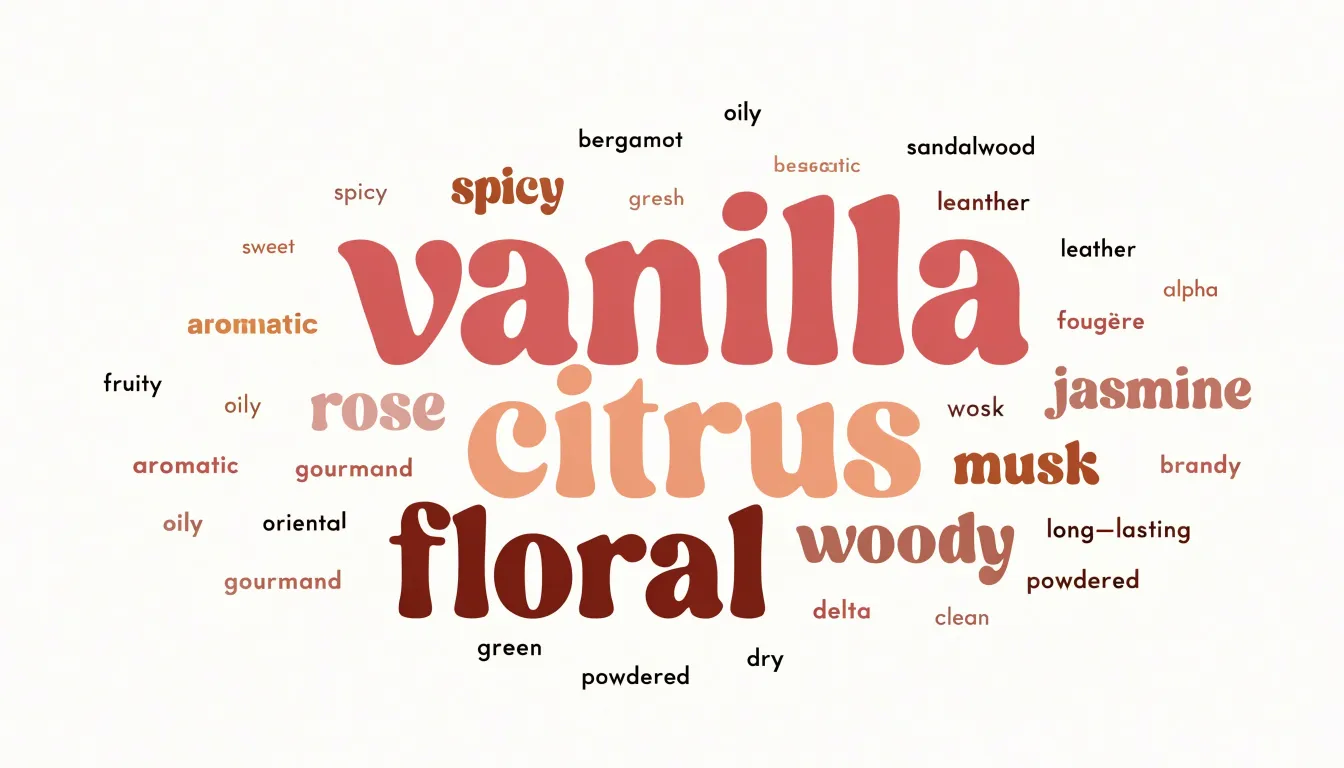
This visual approach reveals market patterns. For example, if “vanilla” appears larger than “rose,” it suggests that reviewers more frequently mention vanilla, perhaps indicating its popularity or prevalence in the market. Such insights can inform fragrance development, marketing strategies, or consumer research, guiding further quantitative or qualitative exploration.
Word Cloud
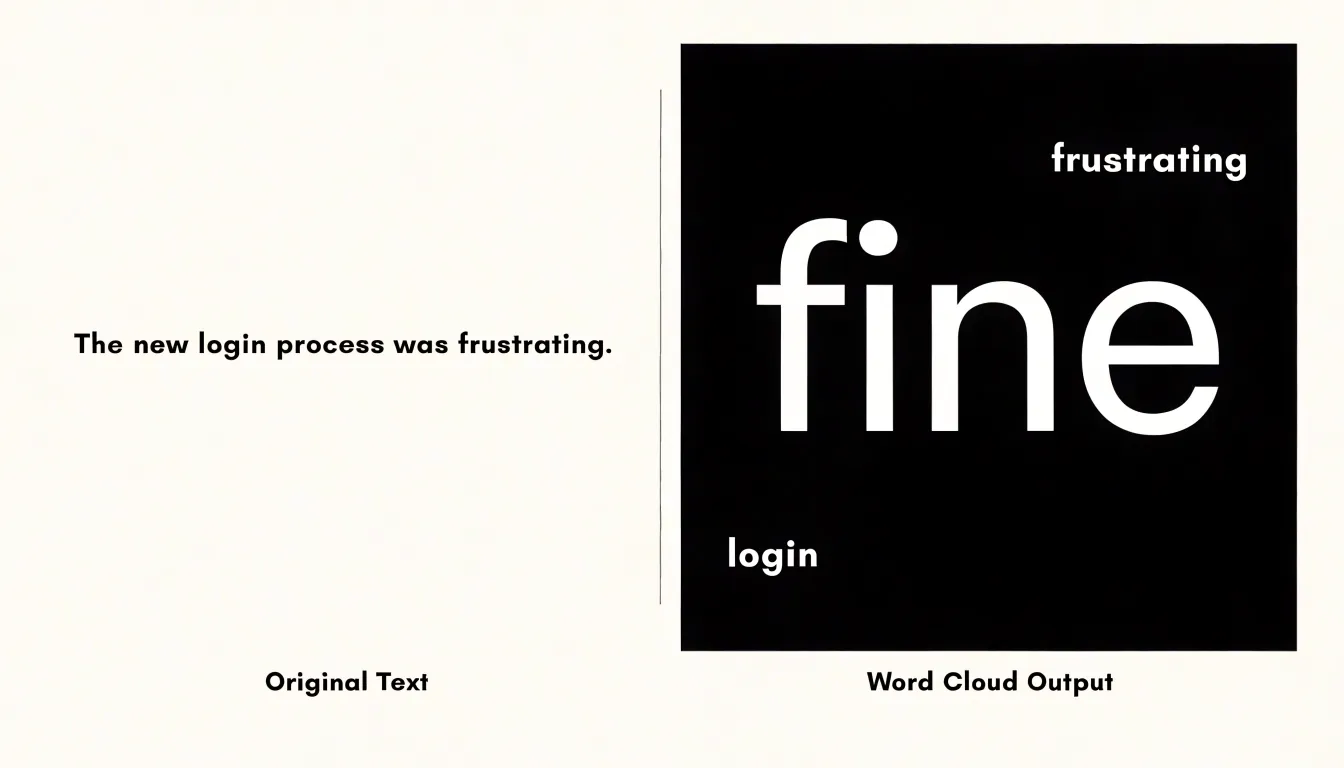
When customer feedback is reduced to a word cloud, each word stands alone, stripped of the sentence that gave it meaning. A customer might write, “The app is fine, but the login process is frustrating.” In a word cloud, “fine” and “frustrating” appear as separate items. The nuance of the sentence—the contrast between overall satisfaction and a specific pain point—is lost. The word “fine” might even appear larger if it is mentioned more frequently across the dataset, overshadowing the real issue. Without the surrounding context, analysts might interpret “fine” as positive feedback and “frustrating” as a minor complaint, when in fact the customer is signaling a critical flaw in the user experience.
The problem deepens with words that carry multiple meanings. “Cheap” could mean affordable or poorly made. “Fast” could mean efficient or rushed. In isolation, these words become Rorschach tests, inviting analysts to project their own assumptions. A product team might prioritize cost reduction based on frequent mentions of “cheap,” when customers actually meant the product felt flimsy.
Moreover, word clouds often highlight generic terms like “good,” “bad,” or “service.” These words dominate the visual, while the specific, context-rich phrases that reveal true sentiment are buried. By stripping away context, word clouds can create an illusion of understanding while obscuring the details that could inform meaningful change.
Word Cloud
Because the largest words draw the eye first, viewers naturally assume that prominence signals significance. That assumption deserves scrutiny. A term can dominate the image simply because it is a convenient label, a category name, or a phrase people repeat out of habit. Generic business vocabulary is a classic example: words like “team” or “process” may recur in dozens of responses precisely because they are vague and easy to reach for, yet they tell you almost nothing about what anyone actually wants or needs. Frequency measures repetition, which is shaped by shared vocabulary and conversational convention as much as by genuine concern.
The overlooked material tends to sit at the opposite end of the scale. A single respondent who describes a specific frustration in careful detail, or who proposes an unusual solution, contributes few matching words to the tally. Their comment may use distinctive phrasing that appears nowhere else in the corpus, so the counting logic assigns it minimal visual weight. In a cloud sized by frequency, that outlier shrinks to near invisibility, even when it is the most actionable piece of feedback in the dataset. One detailed account of a failure mode can be worth more than a hundred repetitions of a general complaint, but the visualization gives the repetition the larger typeface.
Reading word clouds well means treating them as a map of vocabulary rather than a map of priorities. The big words show the shared language of the group; the small ones often hide the specific, the unusual, and the genuinely new. A team that reads only the largest terms risks building around existing consensus while the comment that could change direction goes unread at the edge of the image.
Word Cloud
A word cloud’s arithmetic treats every occurrence of a term as equivalent. The word “great” typed in genuine praise and the word “great” deployed with a roll of the eyes both increment the same counter. When the resulting image renders “great” in large bold letters, the viewer has no way to know whether the corpus was celebrating or mocking. This is emotional tone blindness: the visualization is faithful to the raw vocabulary while remaining silent about the stance behind it.
Sarcasm makes the problem especially sharp because it reuses the same positive vocabulary as sincere praise. A collection of customer reviews, social posts, or workplace messages can be dominated by words like “fantastic,” “love,” and “brilliant” while the actual sentiment is corrosive. Because word clouds strip away word order, punctuation, emoji, and the surrounding clause, they remove the contextual signals that human readers use to detect irony. A reader encountering “fantastic, another Monday meeting” understands the mismatch between the adjective and the situation; the cloud sees only “fantastic” and gives it more visual weight.
Consequently, decision-makers glancing at a large “excellent” may conclude that feedback is warm when the underlying messages are dripping with complaint. This limitation is structural, since frequency-based display has no mechanism for representing polarity. Addressing it requires pairing the cloud with sentiment analysis, reading the source text, or using visual encodings that carry valence alongside size.
Word Cloud
Breaking a sentence into isolated tokens also dissolves phrase-level meaning. Take a phrase like “not guilty” or “customer service.” Rendered as two separate words floating in different parts of the layout, the connection between them evaporates, and each term sits next to unrelated neighbors that pull it toward a different reading. “Service” may land beside “repair” and “fee,” subtly recasting an expression about human support as a line item. The reader’s eye follows proximity, and the algorithm’s placement—not the author’s intent—decides which associations form. Multi-word names suffer the same fate: a company or place split into its component words can be mistaken for two distinct topics, inflating the apparent vocabulary and manufacturing themes that were never there. Idioms fragment into literal pieces, and negation particles drift away from the terms they were meant to reverse.
Font sizing compounds this distortion. The rules that scale word dimensions are rarely linear. A term that appears twice as often may be rendered several times more massive, turning a minor difference in frequency into a dramatic visual hierarchy. Area, the dimension viewers actually perceive, does not track the underlying count; doubling the height of a glyph can quadruple the ink it occupies. Long words also gain unearned prominence simply because their letterforms occupy more space at a given point size. The result is a display whose visual weight reflects the quirks of typography and layout as much as the actual prevalence of language.
Word Cloud
The quality of a word cloud depends on how carefully the underlying corpus is prepared during data cleaning:
- Stop word removal: Common function words such as articles, prepositions, and conjunctions (“the,” “and,” “is”) dominate raw frequency counts without conveying much about the subject matter. A generic stop word list works for general prose, but specialized documents often treat certain everyday-looking terms as meaningful. Reviewing term frequencies before filtering helps identify words that deserve to stay. A safer approach is to filter iteratively and inspect the results after each pass, rather than applying an aggressive list all at once. Also convert all words to lowercase so capitalization does not split counts.
- Lemmatization: This step reduces inflected forms to their dictionary base so that variations of the same word—such as “running,” “runs,” and “ran”—collapse into a single entry. The choice between lemmatization and the cruder stemming approach matters here: lemmatization preserves real words and keeps labels readable, while stemming can produce truncated fragments that confuse viewers. Part-of-speech tagging during lemmatization further improves accuracy by distinguishing nouns from verbs that share a surface form.
- Synonym grouping: Merging terms that mean the same thing ensures conceptual weight is not split across multiple spellings or phrasings. This step requires a curated synonym set or a domain-specific thesaurus, because automatic merging can overreach and combine terms whose meanings diverge in context.
Throughout all three steps, keep a record of what was removed or merged, sample the cleaned output against the original text, and tune thresholds rather than relying on defaults.
Word Cloud
Several practical layout and color adjustments can reduce visual confusion and help readers extract meaning more easily:
- Fix word orientation horizontally: When terms are rotated at various angles across the canvas, the eye must constantly reorient itself to decode each label, which slows scanning and increases misreading—especially for longer or unfamiliar words. Keeping all words level allows readers to move through the display in a natural left-to-right, top-to-bottom rhythm, making size comparisons faster and more accurate.
- Use color purposefully: A carefully chosen palette can reinforce the underlying message by grouping related terms or encoding a secondary variable such as category or sentiment. Even when color is purely decorative, avoid using too many distinct hues, which fragments the display into visual clutter.
- Maintain high contrast: High-contrast combinations help words stand out against the background and support accessibility for readers with low vision or color blindness, while harmonious hues prevent any single term from accidentally dominating attention.
Word Cloud
Side-by-side word clouds fail at comparison because people read font size as an approximate ranking rather than a measurable quantity. When two clouds sit next to each other, the eye cannot reliably judge whether a word in the left cloud is twice as large as the same word in the right cloud, or 1.6 times, or roughly equal. Because perceived area depends on letterforms, word length, ascenders, and descenders, readers end up comparing impressions of prominence instead of actual counts or proportions.
Small but meaningful shifts between datasets disappear entirely. A term that rises from 2 percent to 4 percent of tokens doubles in importance, yet at those magnitudes it may appear in neither cloud or as a barely perceptible change in size. Proportional change, which usually matters most in comparative analysis, has no dedicated visual encoding in the word cloud form.
Furthermore, because color and position are typically assigned arbitrarily or by frequency, the layout provides no stable reference point across the two panels. Words occupy different positions in each cloud, forcing the viewer to scan and hunt rather than compare aligned rows, and differing vocabularies mean the two clouds rarely share enough terms to support a direct read. The result is a pair of images that invite loose qualitative impressions—such as the sense that one corpus feels more technical—while resisting precise statements about magnitude and shift.
Bar Charts
When presenting word frequency data, horizontal bar charts offer a clear and practical way to communicate exact word counts and ranked frequencies. Each bar corresponds to a single word or phrase, and its length encodes the precise number of occurrences. Because the bars extend horizontally, word labels can sit along the vertical axis at a comfortable reading angle, which suits multi-word phrases and longer terms that would be cramped or truncated in a vertical layout or split apart in a word cloud.
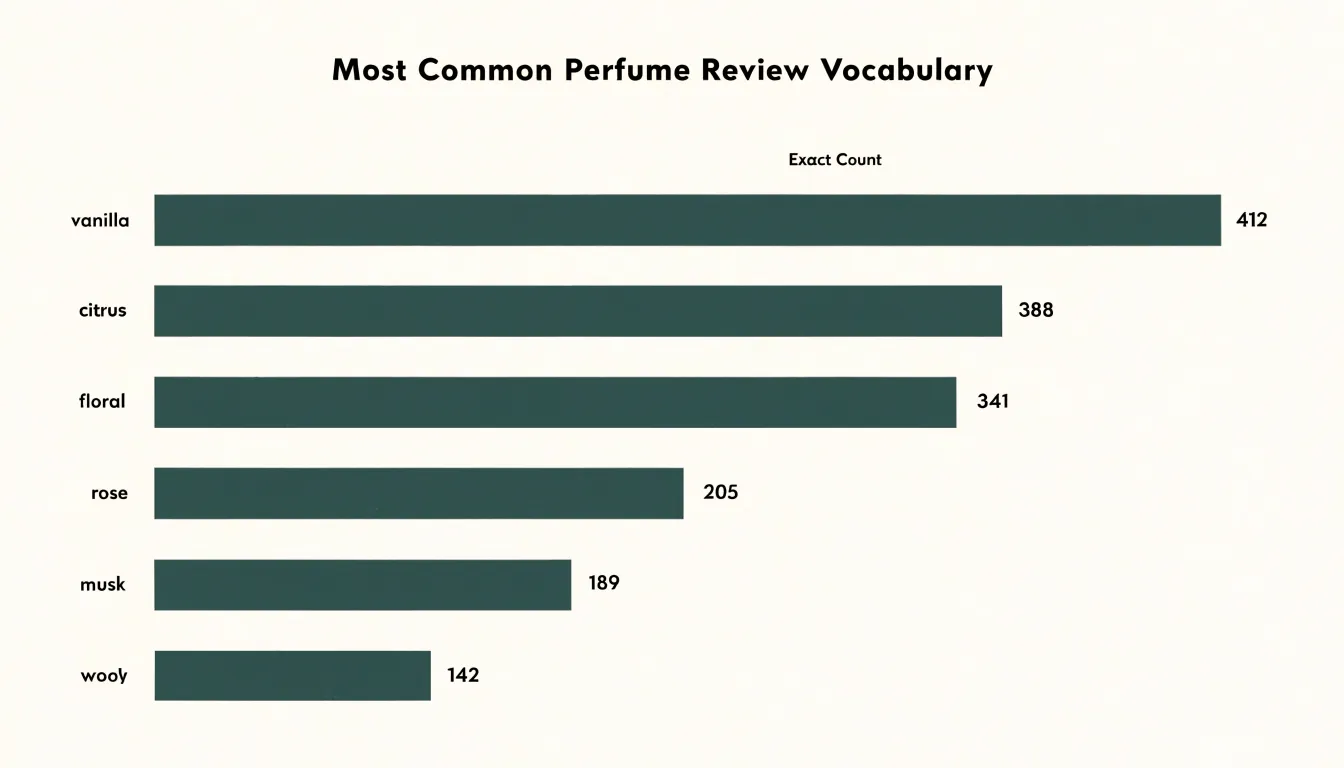
Arranging bars in descending order of frequency turns the chart into a visual league table. The most prominent terms sit at the top, and the eye can travel down the list to compare adjacent entries. Readers can trace a specific word’s bar across to the axis value to recover the exact count, or read value labels placed at the end of each bar without overlapping neighboring elements.
Horizontal bars also scale gracefully as the vocabulary grows. Longer lists of words can be stacked vertically without compressing the labels, keeping the chart legible even when dozens of terms are included. Color can still be applied to group related words or highlight particular categories while keeping the underlying counts visible.
Word Cloud
Because word clouds are so accessible, they can easily become vehicles for misleading graphics. Readers evaluating published word clouds should watch for three common red flags:
- Uncleaned stop words: When words like “the,” “and,” “of,” or “was” appear at prominent sizes, the creator did not remove common function words before generating the image. These terms push genuinely significant vocabulary into smaller type, distorting what the text is about.
- Biased color schemes: Colors often imply categories, importance, or sentiment even when no such information exists in the underlying data. If warm colors are reserved for words the creator favors, or if an unusual palette draws the eye toward particular terms, the graphic may be steering interpretation rather than reflecting the text.
- Artificial font scaling: A word’s size should correspond to its frequency or another stated measure. When creators manually inflate the size of selected words for emphasis, or fail to disclose what the sizing represents, the visual exaggerates the importance of certain terms and understates others.
Spotting these red flags helps readers treat word clouds as interpretive illustrations rather than neutral summaries of text.
Word Cloud
Despite their analytical limitations, word clouds remain practical in three specific scenarios:
- Early exploratory data analysis: When first encountering a large corpus of customer reviews, survey responses, or social media posts, a word cloud provides a rapid overview of recurring issues or unexpected topics—such as frequent mentions of “shipping” or “quality”—that warrant deeper investigation.
- Visual icebreakers: In presentations, team meetings, and workshops, displaying a word cloud can engage an audience without overwhelming them with dense numbers. Asking participants which words stand out and why provides a shared reference point that sparks discussion.
- Casual summary slides: In a report appendix or slide deck where the goal is a quick takeaway rather than precise measurement, a word cloud can encapsulate the key terms from a brainstorming session or a year’s worth of feedback in a memorable visual.
Dashboard
A word cloud earns its place on an analytics dashboard when paired with sentiment scores and trend line charts, each answering a different question about the same body of text. The cloud shows what people are talking about, the sentiment scores show how they feel about it, and the trend lines show how both change over time. Placing these elements together lets an analyst move from a prominent term in the cloud to its attached sentiment and then to its trajectory across weeks or months without switching tools or re-running queries.
A common layout places the word cloud in a prominent panel alongside sentiment gauges or scorecards for the overall tone of the corpus, with trend line charts positioned below to plot sentiment averages and mention volumes over the chosen time window. When a user filters the dashboard by date range, source, or product line, every panel should update together so all views describe the same slice of data.
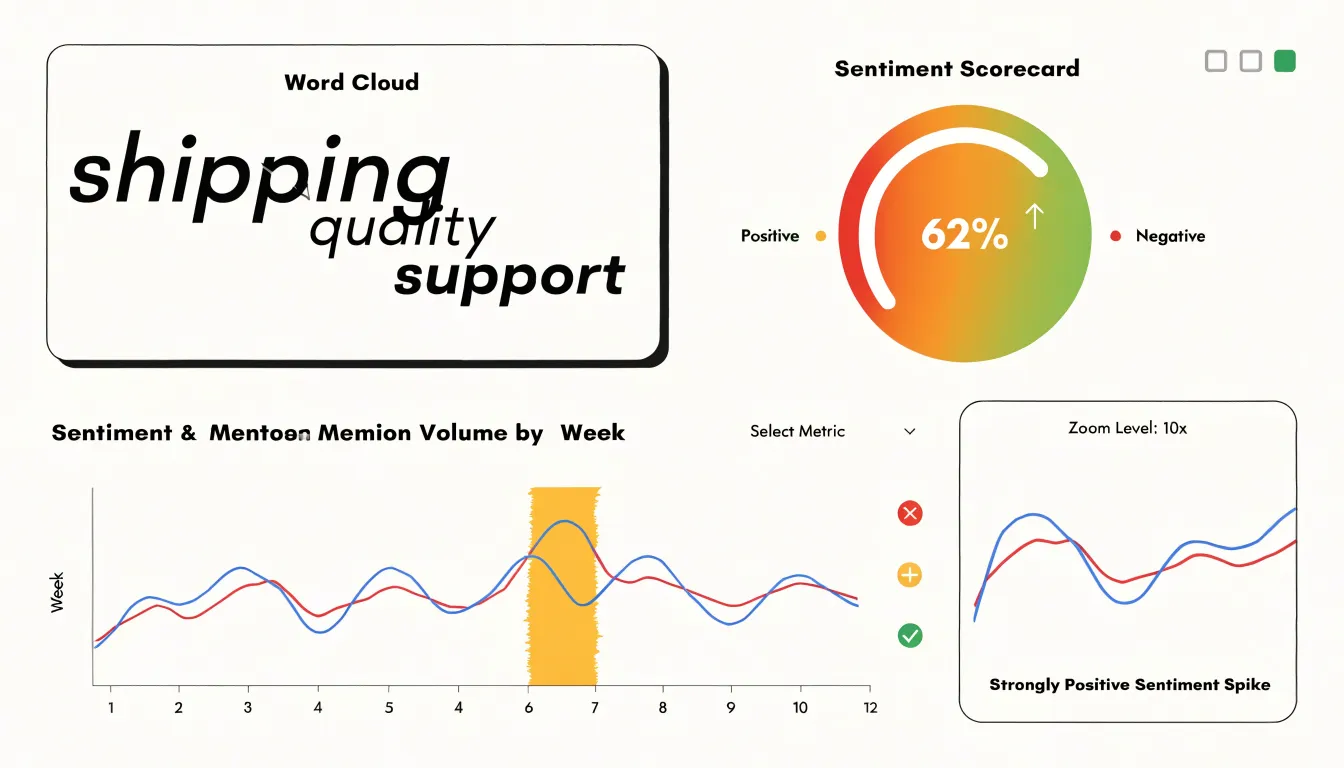
Interactivity and consistent design tie the views together:
- Cross-filtering: Clicking a word in the cloud can filter the sentiment chart to only documents containing that term, turning a static picture into an investigation path.
- Hover details: Hovering over a point on a trend line can reveal the top terms from that period, connecting temporal spikes back to the vocabulary driving them.
- Unified encoding and limits: Shading words in the cloud by their average sentiment embeds emotional signal directly into the text display. Limiting the cloud to a manageable number of cleaned terms and keeping chart axes and legends consistent across panels ensures the dashboard remains readable.
Frequently Asked Questions
What is a word cloud and what does word size mean?
A word cloud turns a body of text into a picture where each word is displayed and its size corresponds directly to how frequently it occurs. The more often a term is used, the larger it appears, so viewers can quickly identify dominant themes and recurring vocabulary.
What are the main limitations of word clouds for analyzing text?
Word clouds strip away context, so words like “fine” and “frustrating” appear separately and the nuance of a sentence is lost. They are also blind to emotional tone, sarcasm, and phrase-level meaning, and prominent words may simply be generic or habitual rather than truly important.
How should I clean text before making a word cloud?
Remove common stop words such as articles, prepositions, and conjunctions, but review term frequencies and filter iteratively rather than applying an aggressive list all at once. Convert words to lowercase, use lemmatization to reduce inflected forms to their dictionary base, and group synonyms with a curated synonym set or domain-specific thesaurus.
Are side-by-side word clouds good for comparing datasets?
Side-by-side word clouds fail at comparison because people read font size as an approximate ranking rather than a measurable quantity. Small but meaningful shifts between datasets can disappear entirely, and the layout provides no stable reference point across the two panels.
Can a word cloud show whether customer feedback is positive or negative?
No. A word cloud’s arithmetic treats every occurrence of a term as equivalent, so “great” in genuine praise and “great” used sarcastically both increase the same counter. Addressing this requires pairing the cloud with sentiment analysis, reading the source text, or using visual encodings that carry valence alongside size.
How can word clouds be used effectively on a dashboard?
A word cloud earns its place on an analytics dashboard when paired with sentiment scores and trend line charts, each answering a different question about the same body of text. The cloud shows what people are talking about, the sentiment scores show how they feel, and the trend lines show how both change over time.
Tony Astor
Tony writes about data visualization and the tools people use to build charts and dashboards. More about Data Illustrator