What Is Data Visualization? Definition and Examples
 By Tony Astor ·

What Is Data Visualization? Definition and Examples
Data visualization is the graphical representation of data using charts, graphs, maps, and dashboards to make patterns, trends, and outliers easy to see and interpret. Common types include bar charts for comparisons, line graphs for trends over time, pie charts for parts of a whole, scatter plots for relationships, heat maps for intensity, and maps for geographic patterns.
Table of Contents
Bar Charts
Bar charts use rectangular bars whose lengths represent values, making them one of the most effective ways to compare quantities across categories such as products, regions, or survey responses. Each bar corresponds to a distinct category, and the relative length of the bars lets viewers grasp differences at a glance without needing to read exact numbers.
Choosing the right orientation matters for readability. Vertical columns work well when category labels are short and the number of categories is moderate, since the horizontal axis keeps labels compact. Horizontal bars become the better choice when category names are long, when there are many categories to display, or when the chart sits in a narrow layout. Rotating long labels on a vertical axis often forces readers to tilt their heads, while horizontal bars keep text level and easy to scan, so matching orientation to label length and count is a practical first step in chart design.
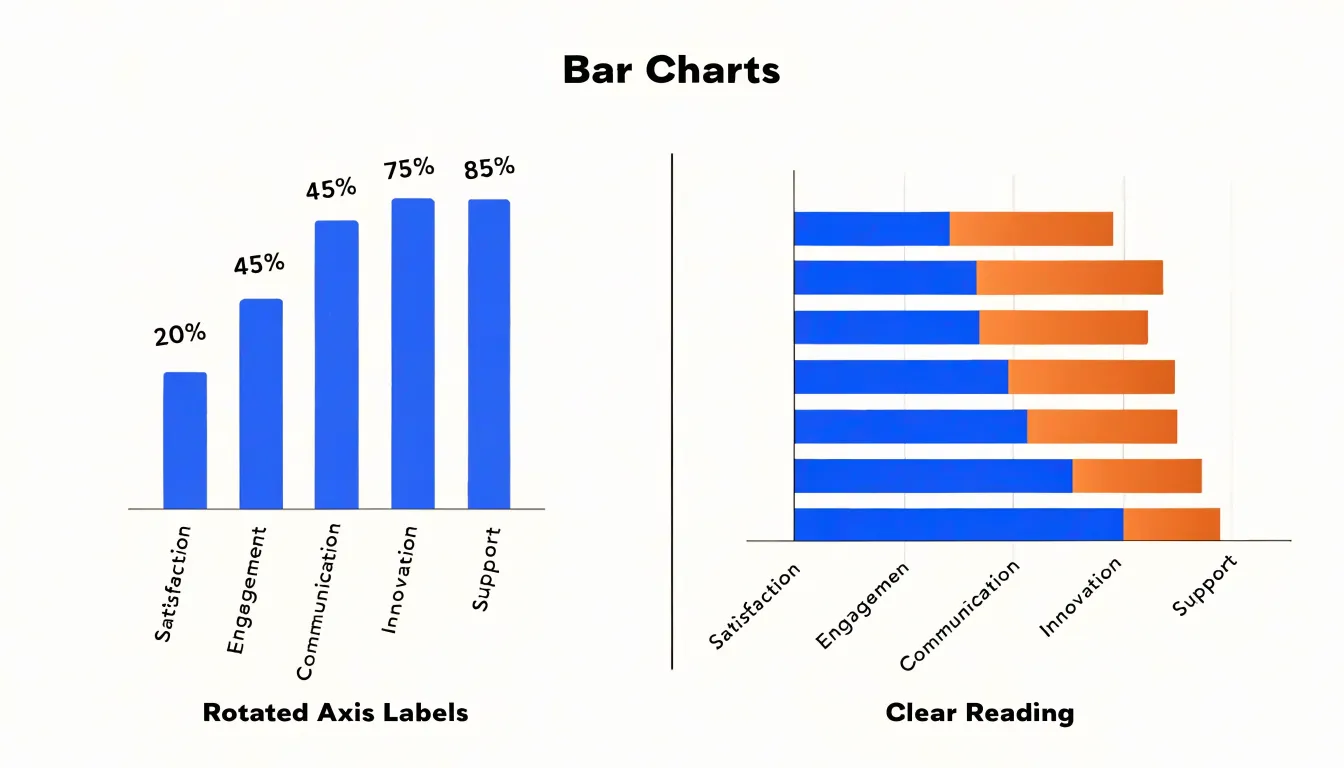
Spacing also shapes how clearly a bar chart communicates. A consistent gap between bars helps viewers perceive each bar as a separate entity and discourages misreading the chart as a continuous area. A common recommendation is to make the space between bars roughly half the width of a bar, adjusting slightly for the number of categories on the axis. Bars that touch each other can blur category boundaries, while gaps that are too wide stretch the eye and weaken comparisons. Grouped and stacked bar charts add a further layer, where spacing within groups should be tighter than spacing between groups to signal which bars belong together. Starting the value axis at zero keeps bar lengths proportional to the data, an essential practice because bar charts encode values through length alone.
Line Graphs
Line graphs serve as one of the most effective tools for tracking change across time. By plotting individual data points along a horizontal axis that represents chronological intervals and connecting those points with a continuous line, this chart type transforms a series of isolated measurements into a readable narrative of movement and direction. The connected line allows viewers to perceive momentum at a glance, whether a metric is climbing steadily, declining, or holding flat across successive periods.
One of the primary strengths of line graphs is their ability to reveal seasonality. When data is plotted across months or quarters, recurring peaks and troughs become visible, helping analysts distinguish predictable cycles from genuine anomalies. A retail team examining monthly sales, for instance, can spot the holiday surges and summer slumps that repeat year after year, informing inventory planning and staffing decisions. Growth rates similarly emerge with clarity; a line that curves upward at an accelerating angle signals compounding expansion, while a flattening slope suggests maturation or saturation.
Line graphs also excel at representing continuous performance metrics, such as website traffic, temperature readings, or revenue, where the underlying phenomenon flows without interruption. Because the line spans every interval between measurements, it conveys continuity that bar charts or pie charts cannot easily replicate. Multiple series can be overlaid on the same axes, enabling side-by-side comparison of trends, such as this year versus last year, or performance across different regions or product lines.
Pie Charts
Pie charts work best when the goal is to show how individual categories combine to form a complete whole, such as the breakdown of a budget across departments or the share of total revenue by product line. The format relies on the viewer comparing angles and slice areas, and that comparison becomes harder as the number of slices grows. Limiting a pie chart to five or six categories keeps each slice large enough to read and preserves the immediate sense of proportion that makes the chart useful. Beyond that range, slices become thin slivers, adjacent colors blur together, and the viewer spends more effort distinguishing segments than interpreting the overall composition. Grouping smaller categories into an “Other” slice is a common way to stay within that range while keeping the main story visible.
Because a pie chart encodes values through area and angle rather than length, readers cannot reliably estimate proportions by eye alone. Two slices that differ by a few percentage points often look nearly identical, and small slices are especially difficult to judge. Careful percentage labeling addresses this limitation by giving the viewer an exact figure alongside the visual impression. Place labels where they remain legible without crowding, and keep the label order consistent with the slice order so that reading across the chart feels natural. Showing both the percentage and, where useful, the underlying value helps the audience move between the visual proportion and the actual figures.
Scatter Plots
A scatter plot places one variable along the horizontal axis and another along the vertical axis, drawing a single point for each observation at the position where its two values intersect. This simple arrangement turns a table of paired numbers into a visual field where patterns become immediately apparent, making it one of the most direct tools for investigating whether two quantities move together. When the points trend upward from left to right, the variables tend to rise in tandem; when they slope downward, one tends to fall as the other grows. The overall shape of the cloud communicates the strength of that relationship, from a tight diagonal band suggesting a strong association to a loose, formless spread indicating little connection at all.
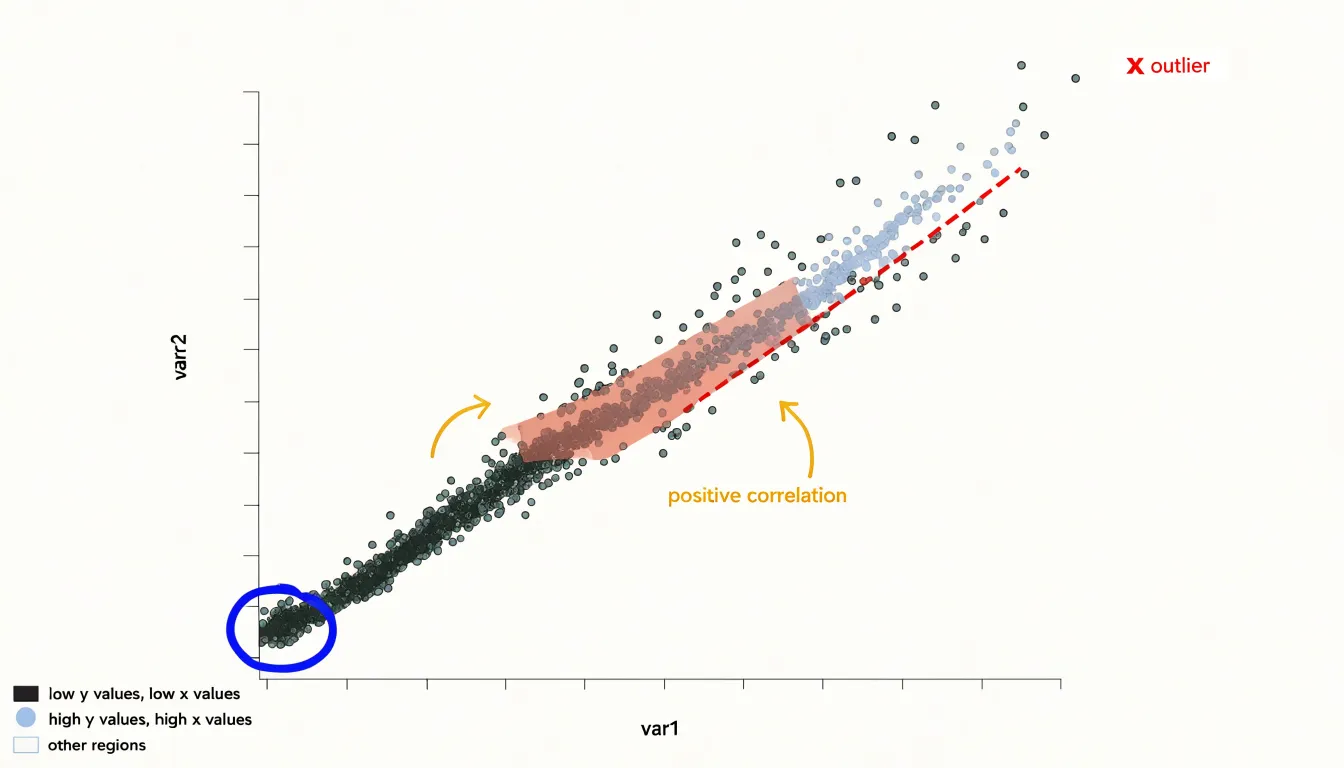
Clusters add another layer of insight. Points that gather into distinct groups can reveal subgroups within the data, such as customer segments with similar spending and visit frequency, or regions of a market that behave alike. Spotting these groupings often raises productive questions about what distinguishes one cluster from another.
Outliers are equally valuable. A point sitting far from the main body of data may signal a measurement error, a data-entry mistake, or a genuinely exceptional case worth investigating on its own terms. In large datasets, such anomalies are easy to miss in summary statistics but stand out clearly against the visual backdrop of a scatter plot.
Because scatter plots display every observation individually, they scale well to substantial volumes of data and preserve detail that averages would conceal. Analysts use them early in an exploration to form hypotheses, and later to confirm whether a suspected correlation holds across the full range of values. Adding color or point size by a third variable extends the technique further, letting viewers compare relationships across categories within a single view.
Heat Maps
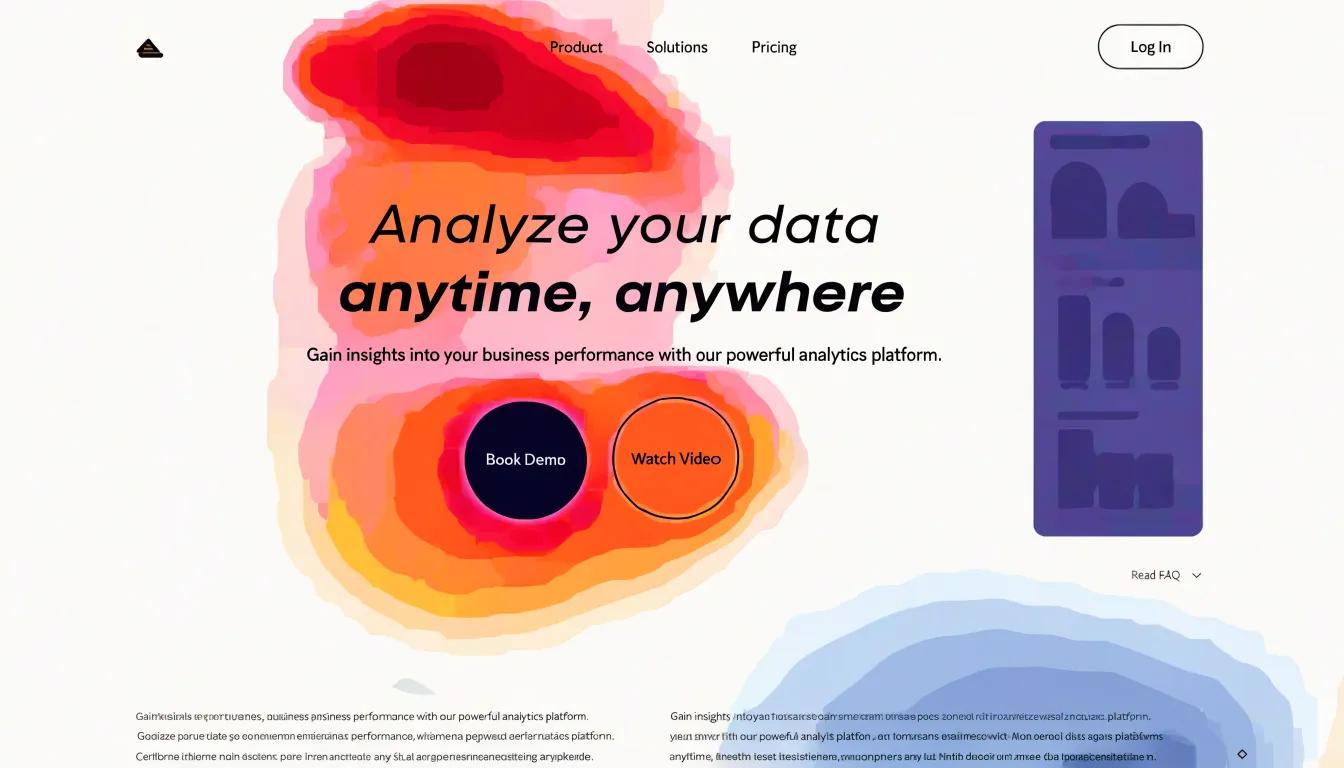
Heat maps use variations in color to represent the concentration or magnitude of values across a two-dimensional space. Each cell or region in the map receives a shade drawn from a color scale, where intensity typically signals higher or lower values. Lighter shades often indicate low activity or small magnitudes, while darker or more saturated shades draw attention to areas of concentrated activity. By translating raw numbers into a visual gradient, a heat map allows a viewer to scan a large body of data and immediately perceive where intensity clusters and where it thins out. This makes heat maps especially effective for matrix-style data, where rows and columns intersect to form many individual data points that would be tedious to read as a table of numbers.
Website click data offers a familiar example. A page or screen is divided into regions, and each region is shaded according to how frequently users click within it. Warm or dark patches reveal the areas that attract the most attention, while pale areas show zones that receive little interaction. Designers and analysts can use these patterns to understand where visitors focus, which elements draw engagement, and where content may be overlooked. The same principle applies to any grid of values, from hourly activity across a week to performance metrics across product categories.
Maps
Maps translate geographic data into a visual form that makes regional patterns immediately readable, showing how a metric such as sales volume, population density, or customer count varies from place to place. The choropleth map is one of the most familiar forms, using color shading to represent values across defined regions like countries, states, or sales territories. A darker shade typically signals a higher value, so an analyst scanning a choropleth can see at a glance which territories are outperforming and which are lagging. This shading approach works especially well for normalized metrics such as sales per capita or revenue per store, since it lets viewers compare regions of very different sizes on a like-for-like basis.
Bubble maps take a different approach, placing circles at specific coordinates where the size of each bubble encodes a value. Because bubbles are anchored to points rather than filled regions, they suit data tied to precise locations such as individual stores, distribution hubs, or customer clusters. Overlaying bubbles on a base map makes it possible to see both the position and the relative magnitude of each data point at once, which helps when identifying clusters of high activity or gaps between coverage areas.
Both map types link spatial metrics to specific locations, and that linkage is where their analytical value lies. A retail team might use a choropleth to reveal regional sales trends, spotting states where revenue is strong relative to population, or a bubble map to show where individual outlets concentrate and where expansion might make sense. Demographic patterns come into focus the same way: shading by median income or age bracket can expose correlations between customer profiles and purchasing behavior across regions. When these maps are combined with filters or hover details, viewers can drill into specific locations for territory planning, resource allocation, and targeted marketing.
Common Pitfalls
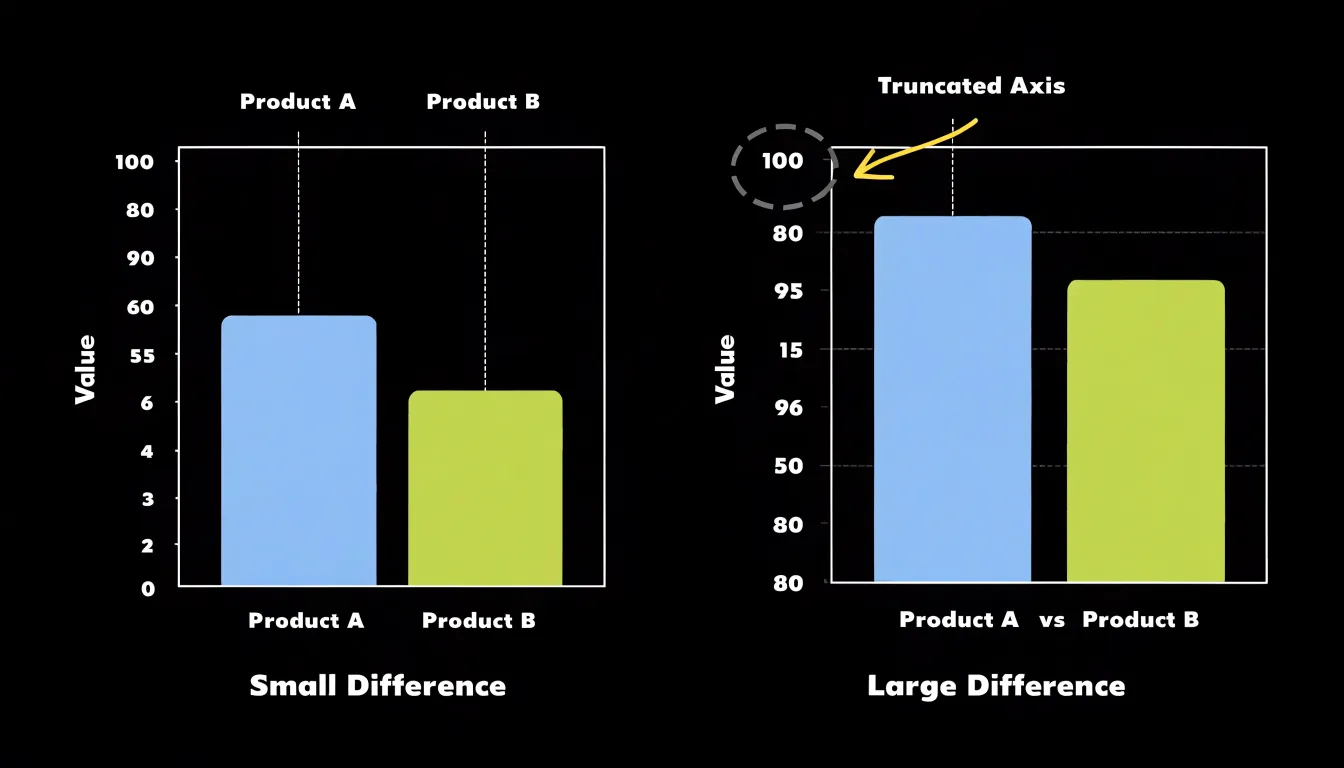
One of the most frequent and damaging mistakes in data visualization involves the misuse of axis scales. When a chart’s vertical axis begins at a value other than zero, the relative heights of bars or the slopes of lines can exaggerate differences that are actually quite small. A bar chart showing sales figures with a y-axis starting at 80 rather than zero might make a modest increase look dramatic, leading viewers to draw conclusions the underlying numbers do not support. Truncated axes are sometimes chosen deliberately to emphasize a trend, but even when used with honest intentions, they distort the viewer’s sense of proportion. Audiences read charts quickly and intuitively, comparing shapes and lengths before they ever examine the tick marks. By the time someone notices that the axis has been cropped, the visual impression has already taken hold. Keeping axes anchored at zero, or clearly marking breaks in the scale, preserves the integrity of the comparison.
Overcrowded graphics present a related challenge. When a single chart carries too many data series, labels, gridlines, and decorative elements, the viewer’s attention is pulled in multiple directions at once. Clutter often accumulates gradually as stakeholders request additional variables or annotations, and the result is a graphic that communicates less, not more. Eliminating unnecessary elements involves removing redundant legends, simplifying color palettes, and resisting the temptation to display every available metric on one canvas. Splitting complex information across multiple focused charts frequently serves the audience better than consolidating everything into a single dense visual. The guiding principle is that every element on a chart should earn its place by helping the viewer understand the data.
Design Fundamentals
Color is one of the most powerful tools in a visualization because it directs the eye before a reader has processed a single word. An intentional palette starts with a small number of hues used consistently: one color to highlight the most important data point or category, a restrained set of supporting tones for secondary series, and neutral grays for context such as gridlines and axes. Saturation and lightness matter as much as hue, since varying them creates natural contrast that separates foreground data from background structure. Palettes should also remain distinguishable for viewers with color vision deficiencies, which means avoiding combinations like red and green as the sole distinction and testing choices against accessible contrast ratios.
Typography plays an equally important role in making a visualization effortless to read. A strong typographic hierarchy establishes clear levels of information: a title that states the main takeaway, subtitles or annotations that add necessary context, axis labels that clarify units and scales, and legends that map colors or shapes to categories. Each level should differ in size, weight, or position so readers can navigate the chart at a glance. Sans-serif typefaces at moderate sizes tend to work well on screens, and generous spacing between labels prevents crowding. Keeping the number of type styles small, perhaps two fonts or a single family in several weights, creates consistency across a dashboard or report. Legible titles, labels, and legends reduce cognitive effort, letting the data itself carry the message rather than the formatting around it.
Data Preparation
Before any visualization is built, raw data must pass through a series of cleaning steps that address the imperfections common to real-world datasets. Missing values are among the most frequent issues. A blank cell in a sales table, for instance, can cause a charting tool to drop an entire category or render a misleading gap. Analysts handle these gaps deliberately: they may remove rows with missing entries when the sample is large enough, substitute a reasonable estimate such as a mean or median, or flag the absence explicitly so viewers understand the limitation. Each choice carries consequences for the final chart, and documenting the approach keeps the visualization honest.
Duplicate records present another hazard. Repeated transactions or double-entered customer rows inflate totals and skew averages, making a bar chart show volumes that never actually occurred. Deduplication requires identifying the fields that define a unique record, then removing or merging redundant entries so each observation counts once.
Raw tables also demand structural attention. Data often arrives in layouts suited to storage rather than analysis, with headers buried in the wrong row, merged cells, inconsistent date formats, or category labels that vary in spelling and capitalization. Restructuring the table into a clean, consistent shape, where each column holds one type of information and each row represents a single observation, allows charting software to interpret values correctly. Consistent units, standardized categories, and properly typed fields prevent errors such as dates read as text or numbers stored as strings. When these preparation steps are completed, charts render accurately and reflect the underlying data faithfully.
Beginner Tools
Beginner-friendly visualization tools lower the barrier to entry by letting people create polished graphics through menus, templates, and drag-and-drop canvases.
- Tableau Public offers a free platform where users connect data files, drop fields onto shelves, and watch charts update instantly. Its interface guides newcomers through choosing chart types and filtering data, while a large gallery of published dashboards provides models to learn from.
- Canva takes a design-first approach, supplying templates for infographics, reports, and social posts that users customize by swapping in their own numbers and labels. It suits communicators who want attractive visuals quickly and are comfortable refining layout rather than writing formulas.
- Microsoft Excel remains the most widely available starting point, bundling chart creation directly into spreadsheets so that selecting a data range and clicking a chart icon produces a working graphic. Built-in recommendations suggest suitable chart types, and formatting options allow adjustment of colors, axes, and labels without any programming.
These platforms share a common philosophy of visual feedback: changes appear immediately, encouraging experimentation and reducing the fear of breaking something. Tutorials, community forums, and template libraries support self-directed learning, and free tiers make initial exploration cost-free. Beginners can progress from simple bar and line charts toward interactive dashboards as their confidence grows, and skills acquired in one tool often transfer to others. The main limitation is flexibility, since highly customized or large-scale visualizations may eventually require more advanced software, yet for early-stage projects and everyday reporting these tools deliver professional-looking results with minimal training.
Real World Examples
In healthcare, electronic health records now often include dashboards that display vital signs, lab results, and medication histories in real time. These visual summaries help clinicians quickly identify deteriorating conditions, such as sepsis, by highlighting abnormal trends. A widely cited case is the use of predictive analytics dashboards in hospitals to reduce sepsis mortality; by visualizing risk scores alongside patient data, care teams can intervene earlier. Another example is the visualization of patient outcomes across departments, which enables administrators to spot disparities and allocate resources effectively. These graphics also facilitate communication among multidisciplinary teams, ensuring everyone has a shared understanding of the patient’s status.
In sports, data visualization has become integral to strategy optimization. Player tracking systems, such as those using GPS and accelerometers, generate vast amounts of data on movement patterns, speed, and distance covered. Visualizing this data through heat maps, spider charts, and trajectory plots allows coaches to assess player performance, monitor fatigue, and design training programs. For instance, in professional soccer, heat maps reveal players’ positioning and movement intensity, helping coaches adjust tactics to exploit opponents’ weaknesses. Similarly, in basketball, shot charts visualize shooting efficiency from different court locations, informing offensive plays. These visual tools also aid in injury prevention by highlighting asymmetries in movement that could indicate risk, helping analysts and coaches enhance team performance and player longevity.
Interactive Features
When a visualization responds to a user’s input, the viewer shifts from passively receiving a summary to actively probing the data behind it. Tooltips are the simplest expression of this idea. Hovering over a bar, a point, or a map region reveals precise values, labels, and contextual notes that would clutter the display if shown permanently. This keeps the overall composition clean while preserving access to exact figures for anyone who wants them.
Dropdown filters extend the same principle across categories and dimensions. A sales dashboard might let a manager narrow results by region, product line, or quarter, with every chart updating instantly to reflect the chosen subset. Users can compare segments, isolate anomalies, and follow a question wherever it leads without waiting for a new report.
Zoom capabilities add a spatial dimension to exploration. Time-series charts can expand from years to days, and scatter plots can magnify dense clusters to reveal individual observations that overlap at full scale. This layered detail lets one view serve both an executive scanning broad trends and an analyst inspecting a single outlier. Together, these controls shorten the distance between a question and an answer, because each interaction produces immediate visual feedback that rewards curiosity and encourages further investigation.
Storytelling
Storytelling in data visualization centers on structuring a visual narrative that guides an audience from initial context toward a clear, actionable conclusion. A well-designed narrative begins by orienting viewers: establishing what the data represents, why it matters, and what questions the analysis set out to answer. This grounding gives people a frame of reference, so the insights that follow land with meaning rather than feeling like isolated statistics. From there, the narrative moves through the key findings in a deliberate sequence, with each chart or visual element building on the one before it. Leading with the most consequential insight risks confusing audiences who lack context, while burying the central message beneath secondary details dilutes its impact. Effective storytellers arrange visuals so the eyes and attention flow naturally, using titles, annotations, and highlighted elements to direct focus toward the evidence that supports the main point.
Equally important is the pacing of the story. A visual narrative might begin with a broad view of overall trends, then zoom into the segment where change is concentrated, and finally connect that finding to a business implication. Each step answers a question raised by the previous one, maintaining a sense of momentum. Annotations and plain-language labels help translate analytical results into terms a business audience can readily absorb, bridging the gap between raw data and decision-making. When the visualization reaches its conclusion, the audience should be able to trace the path from context through evidence to recommendation without effort, understanding not only what the data shows but why it warrants action.
Accessibility
Accessibility in data visualization centers on making charts and graphs usable by people with a wide range of visual abilities, including color vision deficiency, low vision, and blindness. Around one in twelve men and one in two hundred women experience some form of color blindness, which means palettes that rely on red-green distinctions can silently fail for a meaningful share of any audience. Choosing colorblind-friendly palettes, such as those built on blue-orange contrasts or varying lightness as well as hue, keeps categorical series distinguishable for viewers who cannot separate certain wavelengths. Pairing color with redundant encoding, like distinct shapes, patterns, or direct labels on lines, gives every viewer a second channel for telling data apart.
Contrast ratios matter just as much. Text, axis labels, gridlines, and data marks need sufficient luminance contrast against their backgrounds so that readers with low vision or viewing conditions like glare on a phone screen can still parse the chart. Web Content Accessibility Guidelines recommend a contrast ratio of at least 4.5:1 for normal text and 3:1 for larger text and graphical elements, and applying those thresholds to chart typography and marks prevents information from washing out. High contrast benefits every reader, not just those with diagnosed impairments.
Alt text provides a textual equivalent for users who rely on screen readers. Effective alt text describes the chart’s type, its variables, and its central takeaway, so a blind user receives the same insight a sighted user draws from the visual. For complex charts, a short summary plus a linked data table offers a fuller path to the underlying numbers.
Dashboards
Dashboards bring multiple charts and metrics together into a single cohesive view. Rather than flipping between separate reports or spreadsheets, a decision maker can look at one screen and see how different parts of an operation relate to one another. A well-designed dashboard combines complementary chart types so each one answers a distinct question: a line chart might track revenue trends over time, a bar chart could compare performance across regions, and a gauge or KPI tile might show progress toward a quarterly target.
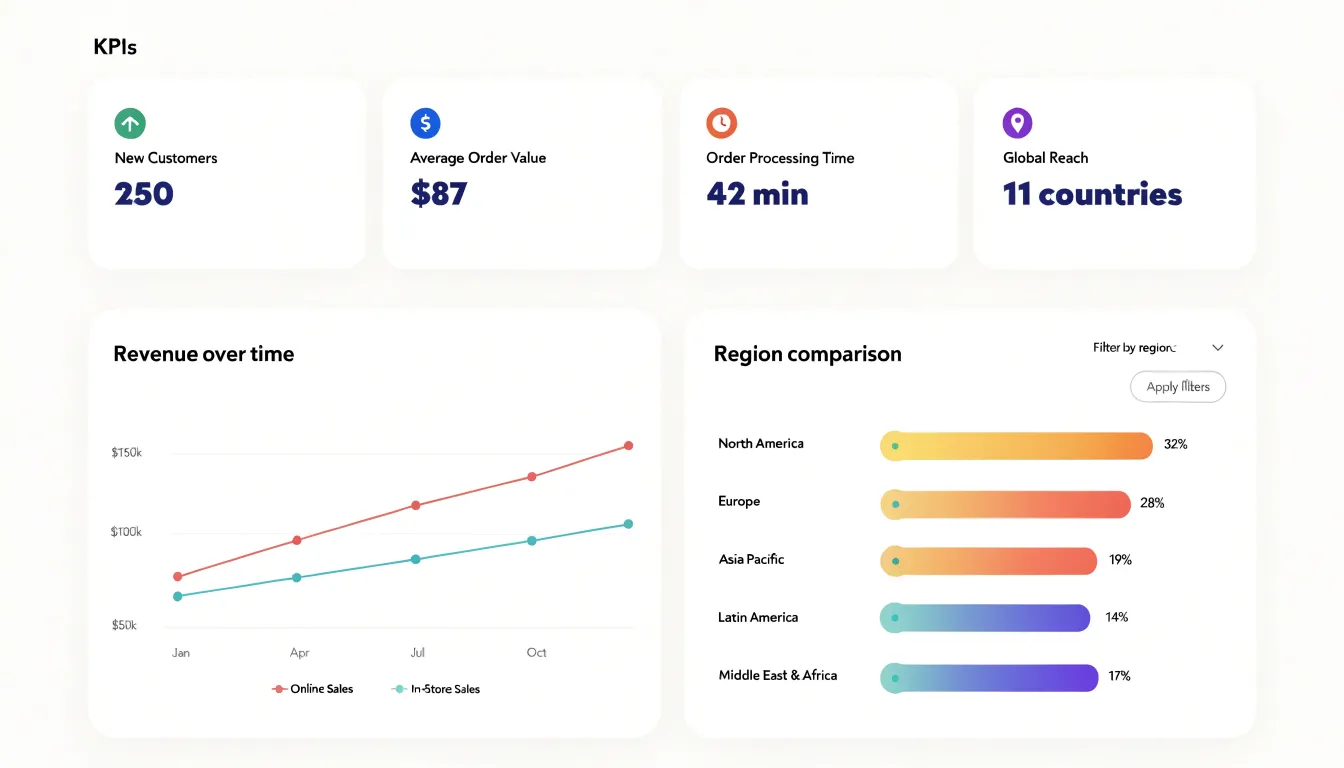
The strength of a dashboard lies in its layout. Careful arrangement guides the viewer’s eye from the most important metrics to supporting detail. Real-time data feeds make dashboards especially valuable for monitoring, since they update continuously and surface shifts as they occur. A logistics manager watching delivery times, inventory levels, and fuel costs in one place can spot a bottleneck forming and act before it escalates. An executive reviewing sales, customer satisfaction, and marketing spend side by side can make faster calls about where to allocate resources.
Good dashboards stay focused, keeping clutter to a minimum and using filters and drill-down options so users can move from a high-level summary into finer detail when a number raises a question.
Frequently Asked Questions
What is a bar chart best used for?
Bar charts are one of the most effective ways to compare quantities across categories such as products, regions, or survey responses. Starting the value axis at zero keeps bar lengths proportional to the data.
When should you use a line graph?
Line graphs are especially effective for tracking change across time, revealing seasonality, and representing continuous performance metrics like website traffic or revenue. Multiple series can also be overlaid on the same axes for side-by-side trend comparison.
How many slices should a pie chart have?
Pie charts should generally be limited to five or six categories to keep each slice large enough to read. Beyond that range, slices become thin and hard to distinguish, so grouping smaller categories into an “Other” slice is a common approach.
What does an outlier in a scatter plot mean?
A point far from the main body of data in a scatter plot may signal a measurement error, a data-entry mistake, or a genuinely exceptional case worth investigating on its own terms.
What is a common chart axis mistake to avoid?
A common mistake is letting a chart’s vertical axis begin at a value other than zero, which can exaggerate differences that are actually small. Keeping axes anchored at zero, or clearly marking breaks in the scale, preserves the integrity of the comparison.
How can I make charts accessible for color blindness?
Use colorblind-friendly palettes such as blue-orange contrasts or vary lightness as well as hue, and pair color with redundant encoding like shapes, patterns, or direct labels. The article also recommends contrast ratios of at least 4.5:1 for normal text and 3:1 for larger text and graphical elements.
Tony Astor
Tony writes about data visualization and the tools people use to build charts and dashboards. More about Data Illustrator