What Is an Infographic? Types and Examples
 By Tony Astor ·
What Is an Infographic? Types and Examples
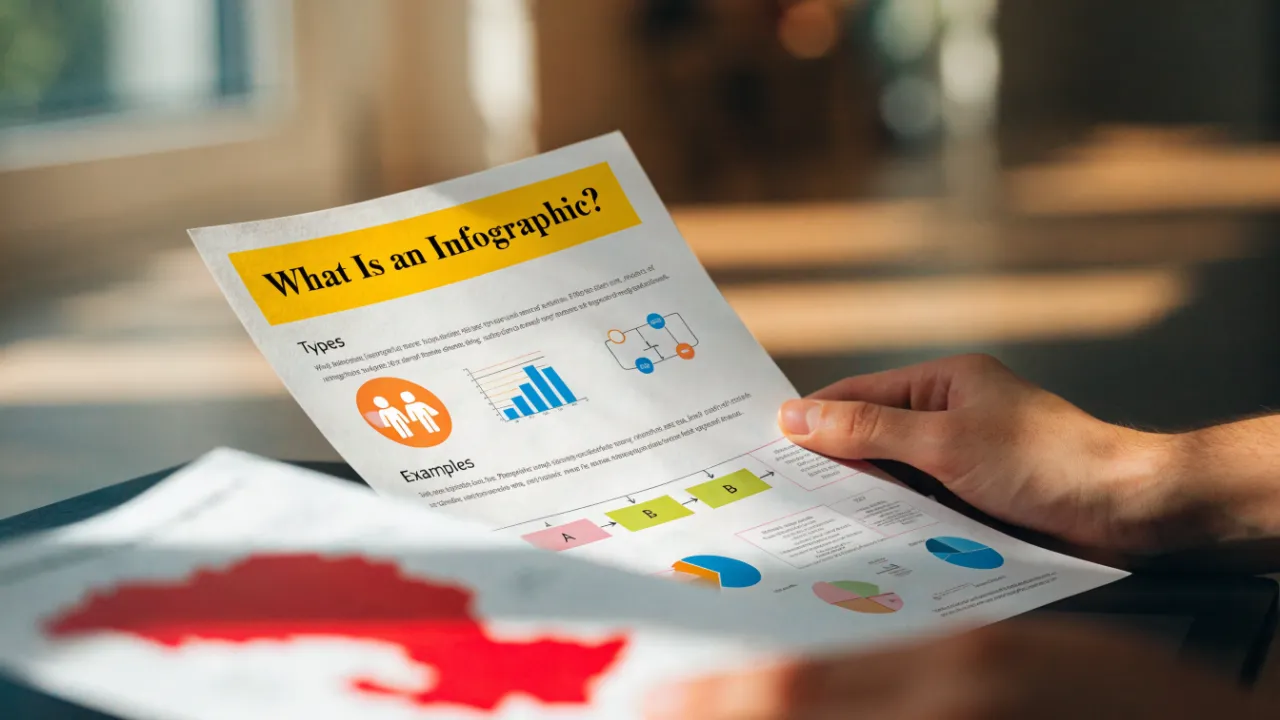
An infographic is a visual representation that combines data, illustrations, and concise text to present information quickly and clearly. Common types include statistical infographics, timelines, process flowcharts, comparison layouts, geographic maps, and anatomical charts. Effective infographics rely on clear hierarchy, limited color palettes, accurate sourcing, and generous white space.
Table of Contents
Statistical Infographics
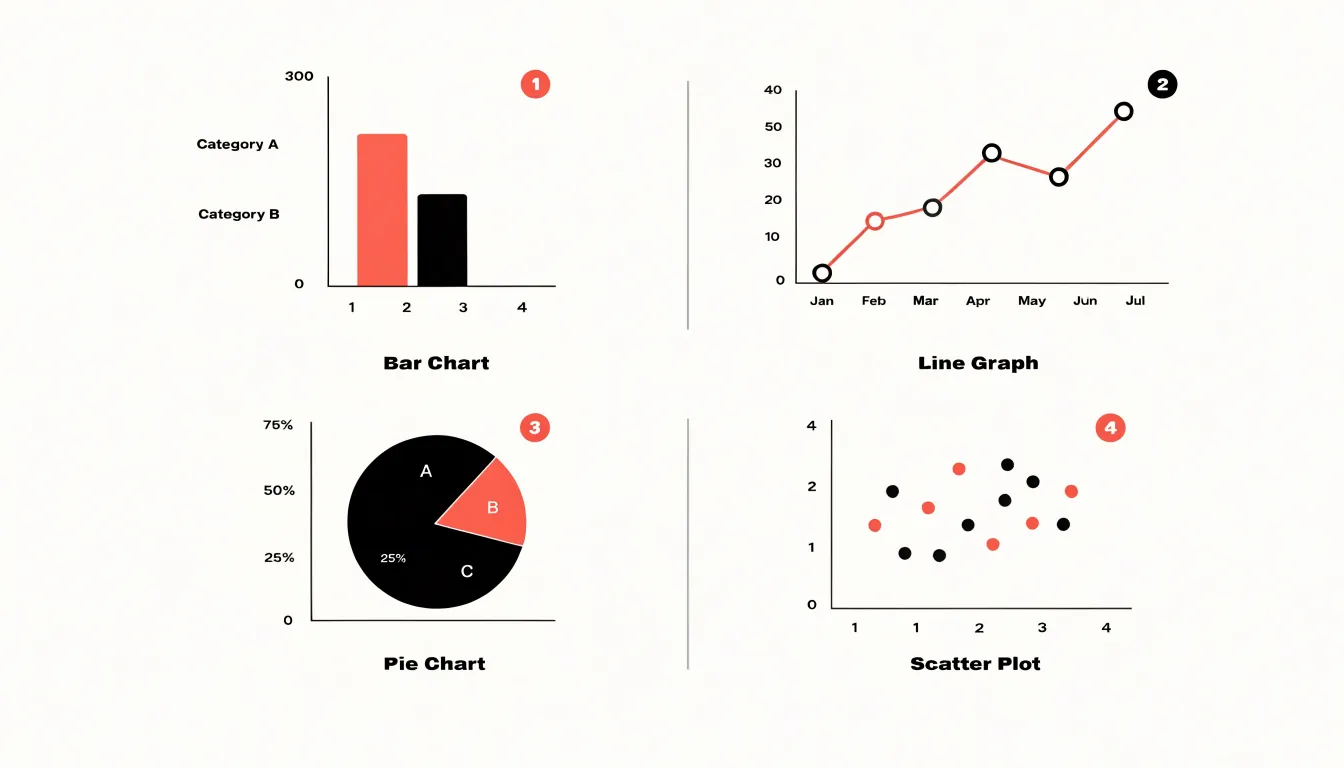
Statistical infographics turn raw numbers into a visual story that an audience can absorb quickly. Their core purpose is to present quantitative data such as survey results, research findings, and performance metrics in a way that reveals patterns, comparisons, and outliers at a glance. The foundation of a strong statistical infographic is choosing the right chart for the job. Bar charts work well for comparing categories side by side, line graphs show change over time, pie charts communicate simple part-to-whole relationships, and scatter plots expose correlations between two variables. When the data carries geographic meaning, a map-based visualization adds context that a plain table cannot provide.
Beyond the chart type, clarity depends on disciplined design choices. A clear headline states the finding in plain language, so viewers understand the takeaway before they study the details. Visual callouts, such as oversized numbers, highlighted percentages, and short annotation labels, draw attention to the most important metrics and guide the eye through the graphic in a logical order. Color should be used purposefully, with a limited palette that separates data series without overwhelming the viewer and with consistent meanings applied throughout the piece.
Accuracy matters as much as appearance. Axes should be labeled, scales should be honest, and sources should be cited so the audience can trust the numbers being shown. Designers also benefit from trimming nonessential decoration, since every extra element competes with the data for attention.
Statistical infographics appear frequently in annual reports, research summaries, news features, and marketing dashboards, where they condense complex findings into a format that supports quick comprehension and informed decision-making.
Informational Designs
Informational designs serve as powerful tools for distilling essential concepts and providing overview guides. When breaking down complex topics, the goal is to create a scannable summary that allows readers to quickly grasp key points without feeling overwhelmed. This begins with a clear structure: use headers to segment information into logical sections, guiding the reader’s eye through the content. Each section should contain concise text blocks that capture the core message in a few words or short sentences. Avoid lengthy paragraphs; instead, use bullet points or numbered lists to enhance readability.
Illustrative icons play a crucial role in informational designs. They act as visual anchors, helping to reinforce concepts and improve retention. Choose icons that are simple, universally recognizable, and directly related to the content. For example, a lightbulb for ideas or a gear for processes. These icons should complement the text, not replace it, providing quick visual cues that make the information more digestible.
Structured headers are another best practice. They create a hierarchy that makes the design easy to navigate. Use larger, bold fonts for main headings and smaller, lighter fonts for subheadings. Consistency in styling helps maintain clarity. Additionally, consider the use of whitespace to separate sections, preventing clutter and giving each element room to breathe.
The overall layout should follow a logical flow, often from top to bottom or left to right, aligning with natural reading patterns. By combining icons, concise text, and structured headers, informational designs transform dense information into an accessible and engaging visual summary that respects the reader’s time and cognitive load.
Process Flowcharts
Process flowcharts belong to the family of infographics that rely on sequence to make information understandable. These diagrams guide the reader through a series of steps, using directional arrows to show what comes first, what follows, and where the path ends. The structure turns a complex procedure into a visible journey, so readers can follow along without holding all the details in their head at once.
In a process flowchart, each step appears as a distinct shape or box, and the arrows between them establish the order of operations. Decision points often appear as diamonds that branch into different paths, giving the diagram the flexibility to handle variations in a routine. This layout works well for step-by-step guides, such as onboarding procedures, troubleshooting sequences, or cooking instructions. The visual rhythm of boxes and arrows keeps the reader oriented and reduces the chance of skipping a stage.
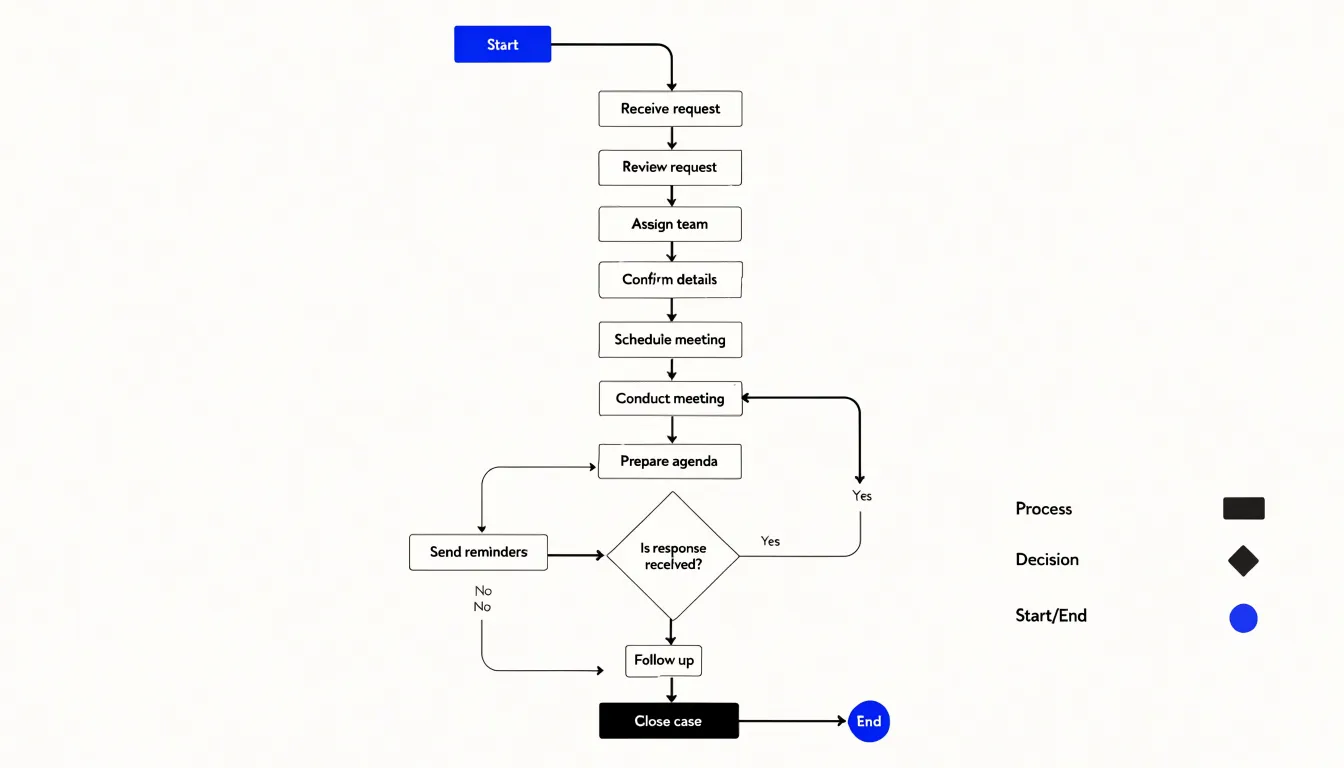
Flowcharts also serve daily wellness routines, where a morning schedule or an exercise plan unfolds as a predictable sequence. Seeing the routine mapped out helps people commit to each step and notice where one habit connects to the next. Multi-step tutorials benefit from the same clarity, since the reader can glance at the diagram to confirm their place in the process. The arrows do the work of instruction, showing progression and keeping the workflow visible from start to finish.
A well-made process flowchart relies on consistent shapes, clear labels, and a readable top-to-bottom or left-to-right flow. The result is a compact reference that supports comprehension at a glance.
Timeline Graphics
Timeline graphics organize information along a linear visual path, guiding the viewer’s eye from one point in time to the next. The core structure is a horizontal or vertical axis marked with dates, stages, or intervals, with events, milestones, or data points attached at their proper positions. This arrangement transforms a list of dates into a story, showing how one moment connects to the next and where significant change occurs. Designers use consistent markers, clear typography, and a restrained color palette to keep the chronology legible, while icons or small illustrations at each node add context without overwhelming the sequence.
Historical timelines are a natural application, allowing readers to follow the arc of a movement, an invention, or a civilization across decades or centuries. Project roadmaps adapt the same format to shorter horizons, plotting phases, deliverables, and decision points so teams and stakeholders can see dependencies at a glance. In the wellness and botanical industries, timeline graphics can trace essential oil harvesting cycles through the seasons, from planting and bloom to distillation and bottling, highlighting the optimal window for each step. In every case, the linear path does the heavy lifting, converting duration and sequence into spatial relationships that the eye can scan quickly.
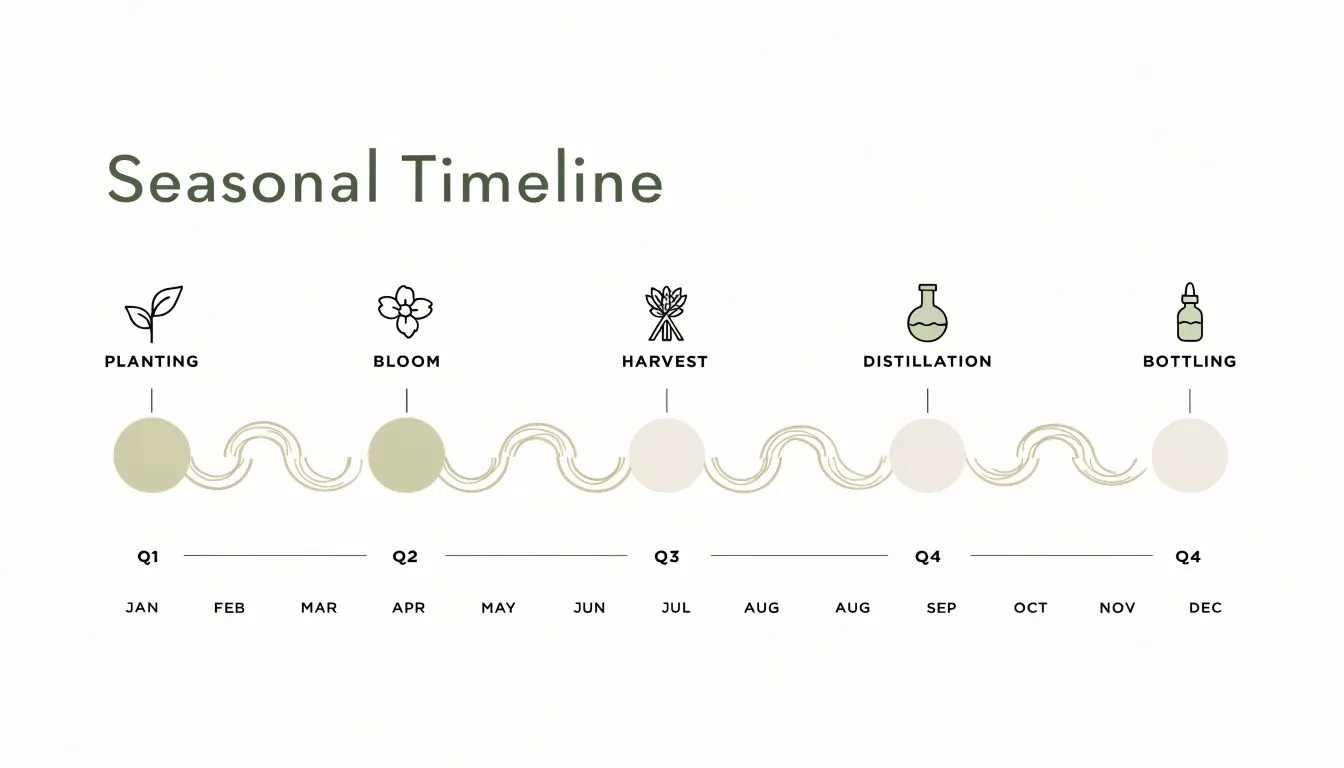
The strength of a timeline lies in its ability to balance breadth and detail. Designers can compress long spans into a single overview or expand key periods to show finer granularity, often using color shifts or branching paths to indicate parallel developments. Annotation and labeling keep the graphic self-contained, while a clear visual hierarchy ensures readers grasp the overall progression before examining individual entries. When executed well, a timeline turns chronology into a navigable landscape, making past events and future plans equally accessible.
Geographic Maps
Geographic maps give regional information a spatial anchor that tables and plain charts cannot provide on their own. By plotting data onto a recognizable map layout, readers can see where something happens, where it comes from, and how patterns shift from one place to another. This spatial framing helps audiences connect abstract figures to real places, making the information easier to remember and act on.
In the botanical and wellness fields, map-based infographics are especially useful for showing origins. A single map can highlight the growing regions for particular herbs, trace the journey of a plant from farm to finished product, or compare the climates and harvest seasons of different source areas. When a map focuses on essential oil sourcing, it can mark the countries and regions that supply ingredients such as lavender, tea tree, or citrus, and add context like harvest windows, distillation hubs, or trade routes. This turns a list of suppliers into a story about geography and agriculture, giving consumers a clearer sense of provenance and quality.
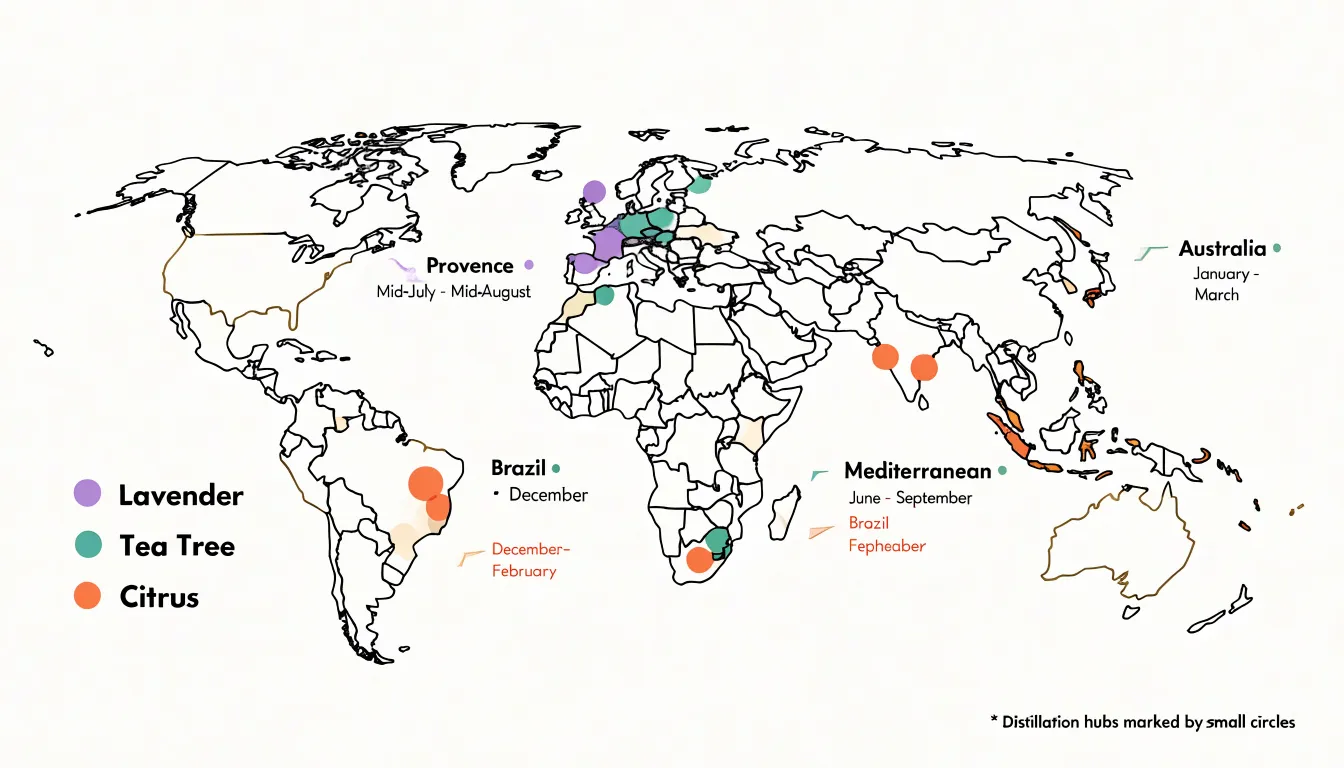
Maps also work well for localized health data. Regional rates of a condition, access to care, environmental exposures, or the spread of a health trend can all be displayed across a familiar geographic frame. Color coding or point markers let viewers compare areas at a glance, while callouts can draw attention to notable hotspots or underserved regions.
The key to an effective geographic map is restraint: a limited palette, a clear legend, and labels only where they matter. When designed well, the map becomes a navigational tool that guides the reader through the data, inviting exploration while keeping the central message visible. For topics tied to place, that combination of location and information is what makes the format so persuasive.
Comparison Layouts
Comparison layouts give readers a structured way to weigh the differences between products, methods, or options that share common ground. The core idea is a side-by-side matrix in which each column represents an option and each row represents a criterion, so the reader can scan across a single attribute and see how every alternative performs. This arrangement transforms scattered facts into a decision aid, since the eye moves naturally along rows and columns to spot trade-offs at a glance.
Consider a comparison of carrier oils such as jojoba, argan, and sweet almond. The matrix might list rows for absorption rate, comedogenic rating, shelf life, cost per ounce, and suitable skin types, while columns hold each oil. A reader weighing a purchase can follow the absorption row across three columns and immediately see which option suits oily skin versus dry skin. The same structure works for extraction methods: cold pressing, solvent extraction, and CO2 extraction can be compared on yield, purity, cost, and environmental impact, with brief notes or icons in each cell to keep the layout readable.
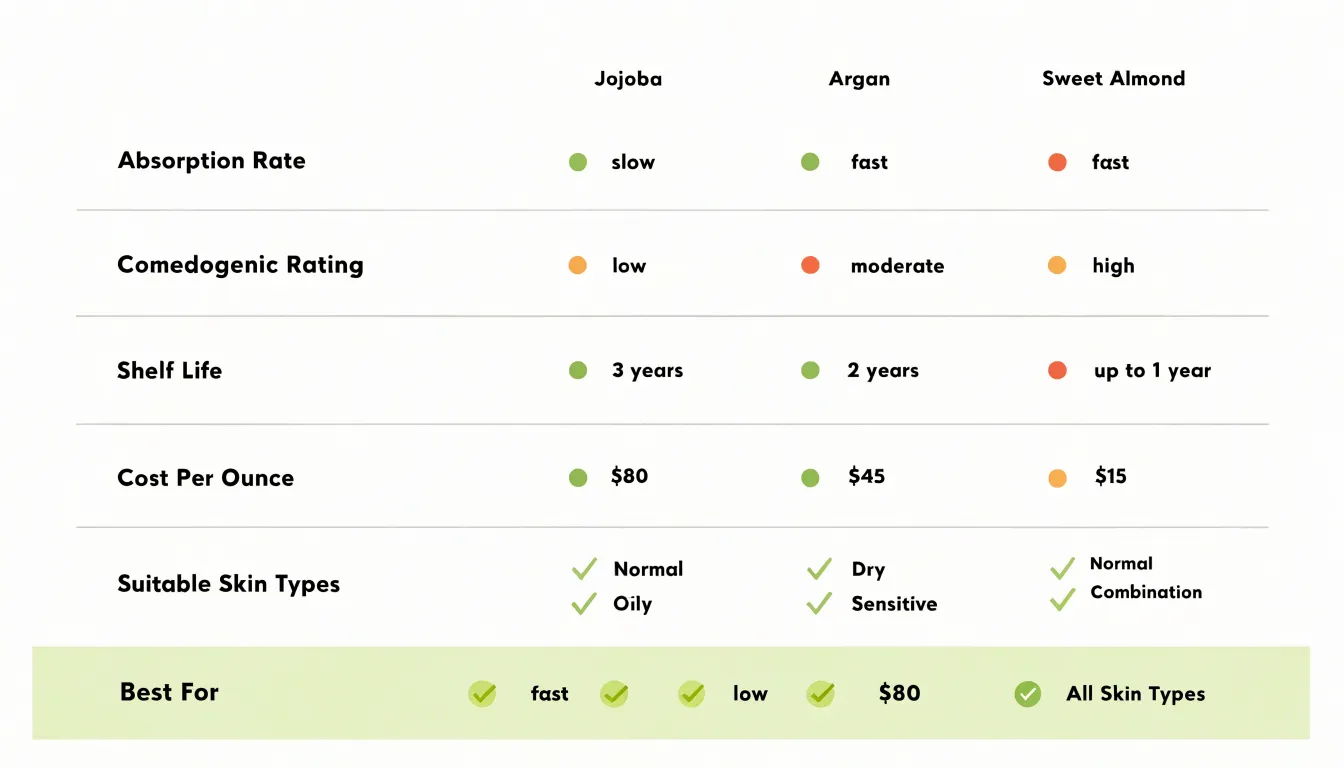
Good comparison infographics rely on consistency. Every column should describe the same criteria in the same order, and cells should use parallel phrasing so differences stand out rather than being buried in inconsistent language. Visual cues such as color coding, checkmarks, rating dots, or highlighted cells draw attention to standout features or the best fit for a stated use case. A short legend or summary row at the bottom can reinforce the takeaway, while a header that names the decision context, such as best for sensitive skin, helps readers interpret the grid correctly.
When designed well, these layouts reduce cognitive load and support confident decision-making, turning a dense set of specifications into a clear, scannable picture of how each option differs from the next.
Hierarchical Pyramids
Hierarchical pyramids organize information by importance and priority, arranging data into tiered visual structures that guide the reader’s eye from the broad base upward to a narrow peak. The shape itself carries meaning: the wide foundation represents the most essential or foundational element, while each ascending layer builds upon it, communicating sequence, dependency, and relative weight. This makes the pyramid an effective choice when the order of information matters and when the audience needs to grasp priority at a glance.
One common application is safety guidelines, where foundational precautions belong at the base. A workplace safety infographic might place universal rules such as wearing protective equipment or following lockout procedures at the bottom, with situational or role-specific protocols rising toward the top. Because people tend to scan from the base upward, the format reinforces that higher-level steps rest on the basics being understood first.
Another frequent use is ingredient dilution ratios, such as those found in cleaning products or chemical handling instructions. The base tier can show the core concentrate or base substance, with subsequent tiers indicating water ratios, mixing order, and final application strength. This structure helps readers avoid the dangerous mistake of reversing the sequence, since the visual hierarchy mirrors the physical process.
Pyramids also work well for illustrating organizational priorities, learning progression, or the layers of a tiered service offering. Designers typically pair the shape with clear labels, consistent colors, and short text blocks to prevent overcrowding at the narrow peak. When the underlying relationships are genuinely sequential, the hierarchical pyramid turns abstract priority into an intuitive visual map.
List Infographics
List infographics organize information into a sequence of numbered or bulleted items, giving readers a quick, scannable way to absorb essential tips without reading long paragraphs. In aromatherapy content, this format works especially well because readers often want actionable guidance they can apply immediately. A well-designed list infographic might present ten quick tips for blending essential oils safely, pairing each tip with a small icon such as a dropper bottle, a diffuser, or a carrier oil. Numbered items suit step-by-step remedy recipes, where the order matters, while bulleted lists are better for collections of standalone usage hacks, like adding a drop of lavender to a bedtime pillow spray or diluting peppermint oil for a temple rub.
Visual hierarchy keeps the list easy to follow. Each item gets its own row or card, with a bold lead-in phrase followed by a short explanation of one or two sentences. Consistent icons, a limited color palette, and generous whitespace prevent the design from feeling cluttered. Designers often alternate background shades or use numbered circles to guide the eye downward in a clear rhythm.
Because list infographics are modular, they are easy to update when new tips emerge or when a recipe changes. They also adapt well across formats, shrinking neatly into a social media carousel or expanding into a printable reference sheet for a workshop handout. The combination of clear structure, engaging visuals, and concise text makes list infographics an effective choice for sharing aromatherapy knowledge with both beginners and experienced users who value fast, practical reference material.
Anatomical Charts
Anatomical charts translate the inner workings of the human body into visuals that readers can follow without any medical training. These charts use labeled diagrams, cutaway illustrations, and simplified schematics to show where organs sit, how they connect, and the routes that substances take once they enter the body. For topics involving topical absorption, an anatomical chart can trace the journey of a compound from the surface of the skin through the layers of the epidermis and into the bloodstream, marking each barrier along the way. A cross-section of the skin, with the stratum corneum, dermis, and underlying capillaries clearly labeled, turns an abstract process into a visible sequence of steps.
The same approach works well for olfactory pathways. A diagram of the nasal cavity, olfactory epithelium, and olfactory bulb can show how airborne molecules travel from the nostrils to receptor cells and onward to the brain, where scent perception begins. Arrows and color coding help readers grasp the direction and speed of these pathways at a glance, while callout labels explain the role of each structure.
Anatomical charts also excel at showing how plant compounds interact with bodily systems. An illustration of the digestive tract, for example, can highlight where specific compounds are metabolized, which organs they reach, and how they influence processes such as circulation or immune response. Layering a simplified diagram of a plant molecule over a body system helps viewers connect the source material to its destination.
By combining accurate structure with clear labeling, anatomical charts make complex biological information accessible to general audiences, students, and health-conscious readers alike.
Interactive Visuals
Interactive visuals turn a static infographic into a two-way experience. On a wellness website, a visitor can hover over a chart showing sleep patterns and see a tooltip reveal the exact hours logged on a given night. They can click a region of the body map to surface stretches suited to that area, or drag a slider to watch an animated bar chart shift as they adjust their daily water intake. These small moments of control keep the audience moving through the content rather than scanning and leaving.
The mechanics behind this engagement are straightforward. Clickable elements invite exploration, giving visitors a reason to move their cursor and stay on the page. Hover tooltips layer detail on top of a clean visual, so the design stays uncluttered while deeper information remains one gesture away. Animated charts draw the eye and show change over time, which suits wellness topics like habit tracking, mood trends, and fitness progress. Each interaction rewards curiosity with immediate feedback.
The payoff shows up in dwell time and retention. When a visitor spends time clicking through a body map or adjusting a slider, they are absorbing the material and building familiarity with the brand behind it. Engagement metrics tend to rise alongside this behavior, and visitors who interact with content are more likely to return or share it. For wellness sites, where trust and repeat visits matter, that added time on page carries real value.
Good interactive design keeps the audience in mind. Interactions should feel intuitive, load quickly, and work smoothly on mobile screens where most wellness content is read. Clear labels and gentle animation help every visitor, including those less comfortable with technology, find their way through the experience and come away informed.
Essential Design Principles
Color is one of the first elements a viewer processes, and it carries meaning before a single word is read. Effective infographics rely on a limited palette drawn from color theory: complementary hues for contrast, analogous shades for cohesion, and consistent accent colors that direct attention to key data points. Contrast matters for accessibility as well, since text and background combinations must meet readability standards for viewers with low vision or color blindness. Designers often choose palettes that work in grayscale too, ensuring the graphic remains legible when printed in black and white or viewed on screens with reduced color rendering.
Typography establishes the reading order of an infographic. A clear hierarchy uses size, weight, and spacing to signal what matters most: a bold headline, a mid-weight subheading, and a lighter body font guide the eye through the content in a logical sequence. Limiting a design to two or three typefaces keeps the piece cohesive, while generous line spacing and appropriate letter spacing prevent text from feeling cramped. Sans-serif fonts tend to work well for small labels and data callouts, where clarity at a distance is essential.
White space is the third pillar of professional composition. Intentional spacing around charts, text blocks, and icons gives each element room to breathe and prevents visual clutter from overwhelming the message. Margins frame the content, gutters separate sections, and padding inside data labels improves legibility. White space also creates rhythm, guiding the viewer from one section to the next without the need for heavy dividers or arrows.
Together, these principles serve accessibility and credibility. Consistent color use, readable type, and balanced spacing help audiences of all abilities absorb the information quickly, and they signal that the graphic was produced with care. A polished visual presentation builds trust in the data itself.
Data Accuracy Guidelines
Before any design work begins, the foundation of a credible infographic is the quality of its data. For content that touches on health or medicine, this means sourcing information from reputable, peer-reviewed studies and verifying scientific data sources at every step. Peer-reviewed journals such as The Lancet, The New England Journal of Medicine, or PubMed-indexed publications provide a level of scrutiny that helps ensure the statistics you visualize have been vetted by experts. Relying on these sources reduces the risk of propagating misinformation and strengthens the authority of your visual content.
Verification goes beyond simply finding a study. It involves checking the study’s methodology, sample size, and publication date to confirm that the findings are current and applicable. Cross-referencing multiple reputable sources can help identify consensus or highlight areas of debate. For medical topics, it is also wise to consult clinical guidelines from established bodies like the World Health Organization or the Centers for Disease Control and Prevention. These organizations often synthesize the best available evidence, making them reliable starting points.
When sourcing data, always trace statistics back to their original context. Avoid secondhand citations that may have distorted the original findings. Keep a record of each source, including a direct link or citation, so that the information can be reviewed and verified later. This practice not only supports accuracy but also builds trust with your audience, who may want to explore the data further.
Design choices should never compromise data integrity. Ensure that any visual representation—such as charts, graphs, or icons—accurately reflects the numbers and proportions in the source data. Avoid manipulating scales or omitting context that could mislead. By adhering to these guidelines, you create infographics that are both visually engaging and scientifically sound, maintaining high medical credibility and serving the audience with trustworthy information.
Common Design Pitfalls
Crowded layouts stand among the most frequent problems in infographic design, and their harm goes beyond aesthetics. When a designer attempts to fit too many data points, labels, icons, and decorative elements into a single frame, the viewer’s eye has no clear entry point or path to follow. The result is visual clutter: a composition in which every element competes for attention and none succeeds. Readers facing this kind of density often disengage entirely, or they skim in ways that cause them to miss the central message. The remedy begins with ruthless prioritization, deciding which two or three ideas the graphic must communicate and removing anything that does not directly support them. White space, far from being wasted room, gives each element the breathing space it needs to be seen and understood.
Misleading charts present a subtler danger because they can look polished and professional while quietly distorting the underlying facts. A truncated axis is the classic example: starting a bar chart at a value other than zero exaggerates differences between categories, making a modest gap appear dramatic. Similar distortions arise from inconsistent scales, cherry-picked time ranges, or three-dimensional effects that make some elements look larger than others. Poor contrast choices compound the confusion, since low-contrast text or color combinations that fail to distinguish adjacent categories can render data unreadable for many viewers, including those with color vision deficiencies. Designers should verify that axis scales remain honest, that color palettes separate categories clearly, and that text meets reasonable legibility standards. Careful attention to these details protects the credibility of the graphic and ensures that scientific or statistical information reaches the audience accurately rather than in distorted form.
Real World Examples
Examining high-performing infographics from leading wellness platforms reveals a consistent set of design choices that serve both reader comprehension and commercial goals. A common pattern appears in graphics that explain a daily wellness routine: the layout moves the eye along a single vertical path, beginning with a short headline, continuing through three to five labeled steps, and closing with a clear action prompt. Each step pairs a simple icon with a two- or three-sentence explanation, keeping the cognitive load low while still delivering practical detail. Color is used strategically rather than decoratively, with a muted background palette reserving one saturated accent color for buttons, product callouts, and key data points. This accent color subtly guides the reader toward affiliate links without disrupting the educational flow.
Data visualization offers another instructive example. Successful supplement comparison graphics often present nutrient dosages through horizontal bar charts or icon arrays rather than dense tables, letting readers grasp relative values at a glance. These charts typically annotate the recommended daily intake with a thin reference line, which gives the numbers context and builds trust in the information being shared. Trust signals matter for conversions, so many top-performing graphics include a small source citation near the data and a brief author or reviewer credit.
Placement of affiliate elements follows a recognizable logic across these examples. Inline text links appear within step descriptions where the product is contextually relevant, while dedicated product cards sit at the end of the graphic after the educational content has delivered its value. Mobile-first sizing is another shared trait, with large tap targets, legible type at small widths, and vertical stacking that avoids side-by-side reading. Together, these choices show how educational clarity and affiliate conversion reinforce each other when design decisions are made deliberately at every stage of the graphic.
Frequently Asked Questions
What is a statistical infographic used for?
Statistical infographics turn raw numbers into a visual story, presenting quantitative data such as survey results, research findings, and performance metrics so patterns, comparisons, and outliers are visible at a glance. They are common in annual reports, research summaries, news features, and marketing dashboards.
Which chart should I use in a statistical infographic?
Bar charts compare categories side by side, line graphs show change over time, pie charts communicate simple part-to-whole relationships, and scatter plots expose correlations between two variables. When the data has geographic meaning, a map-based visualization adds context.
How can I make an informational infographic easy to scan?
Use headers to segment information, keep text blocks concise, and use bullet points or numbered lists instead of lengthy paragraphs. Simple recognizable icons, structured headers, whitespace, and a logical top-to-bottom or left-to-right flow help readers grasp key points quickly.
What are process flowcharts used for?
Process flowcharts guide readers through a sequence of steps using directional arrows to show order and decision points. They work well for step-by-step guides such as onboarding procedures, troubleshooting sequences, cooking instructions, wellness routines, and multi-step tutorials.
How should a comparison infographic be laid out?
A comparison layout uses a side-by-side matrix with each column representing an option and each row representing a criterion, keeping criteria in the same order and phrasing parallel across cells. Visual cues such as color coding, checkmarks, rating dots, or highlighted cells can draw attention to differences and the best fit for a stated use case.
Where should basic safety precautions go in a hierarchical pyramid infographic?
In a hierarchical pyramid, foundational precautions belong at the wide base, with situational or role-specific safety protocols rising toward the top. For example, a workplace safety infographic might place universal rules such as wearing protective equipment or following lockout procedures at the bottom.
Tony Astor
Tony writes about data visualization and the tools people use to build charts and dashboards. More about Data Illustrator