Waterfall Chart vs Stacked Bar Chart: Key Differences
 By Tony Astor ·

Waterfall Chart vs Stacked Bar Chart
A waterfall chart shows how sequential positive and negative changes move a starting value to a final total, with each floating bar beginning where the previous one ended. A stacked bar chart instead divides each bar’s total length into sub-categories, comparing part-to-whole composition across categories. Use waterfalls for progression and change; stacked bars for composition.
Table of Contents
Waterfall Chart
A waterfall chart shows how a sequence of individual changes moves a value from where it starts to where it finishes. The chart opens with an initial starting point, often called the base or opening balance, drawn as a full column anchored to the baseline. From there, each subsequent column represents one discrete change, and its vertical position floats rather than beginning at zero. A positive change rises from the top of the previous running total, while a negative change hangs down from that same level, so every bar connects visually to the one before it.
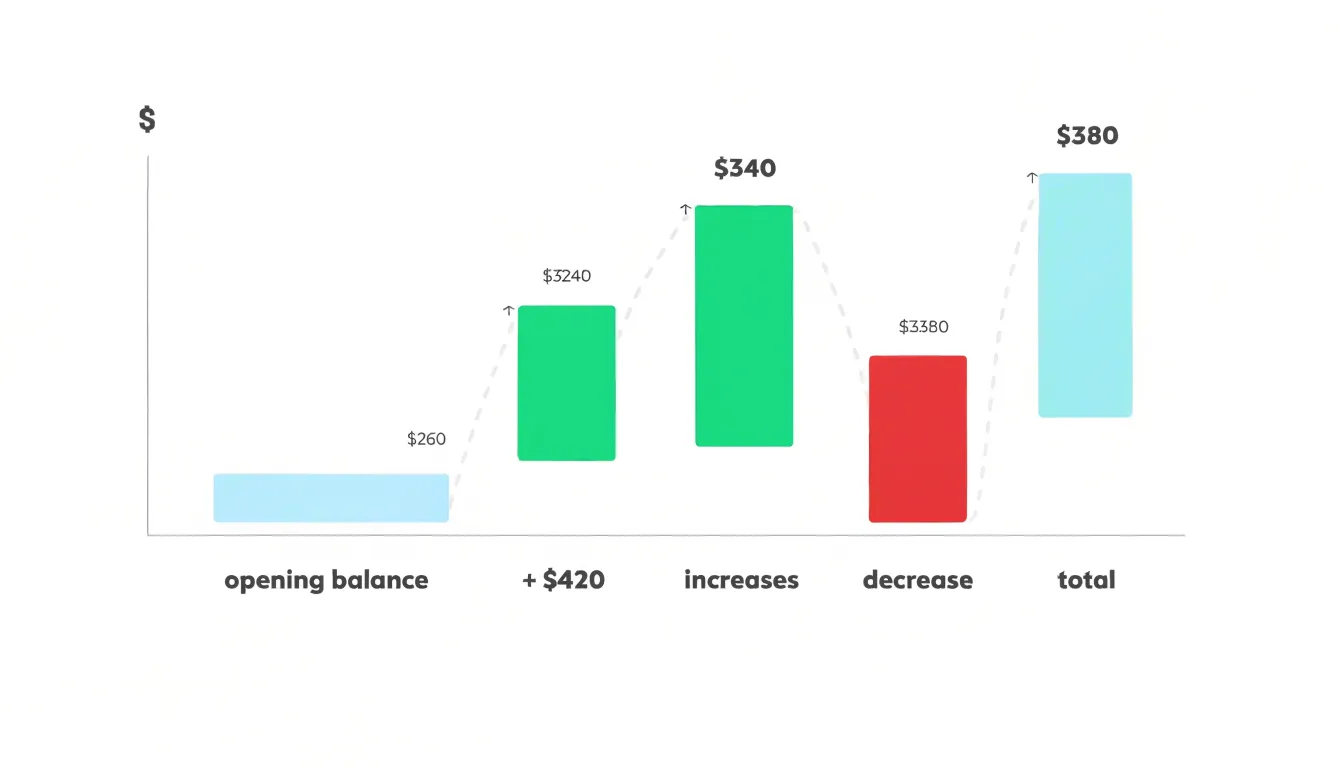
This stepping arrangement makes the cumulative effect of each contribution immediately readable: the eye follows the staircase from left to right and sees exactly how much each item added to or subtracted from the total in progress. The final column typically closes the sequence as a full-height bar showing the end result, confirming that the sum of all intermediate movements reconciles with the overall change.
Because the running total is carried forward at every step, waterfall charts excel at explaining the composition of change rather than mere magnitude. Viewers can isolate a single step to see its individual weight, or scan the whole sequence to identify which movements dominated the outcome. Colour coding conventionally separates increases from decreases, and subtotal columns can mark meaningful checkpoints along the way.
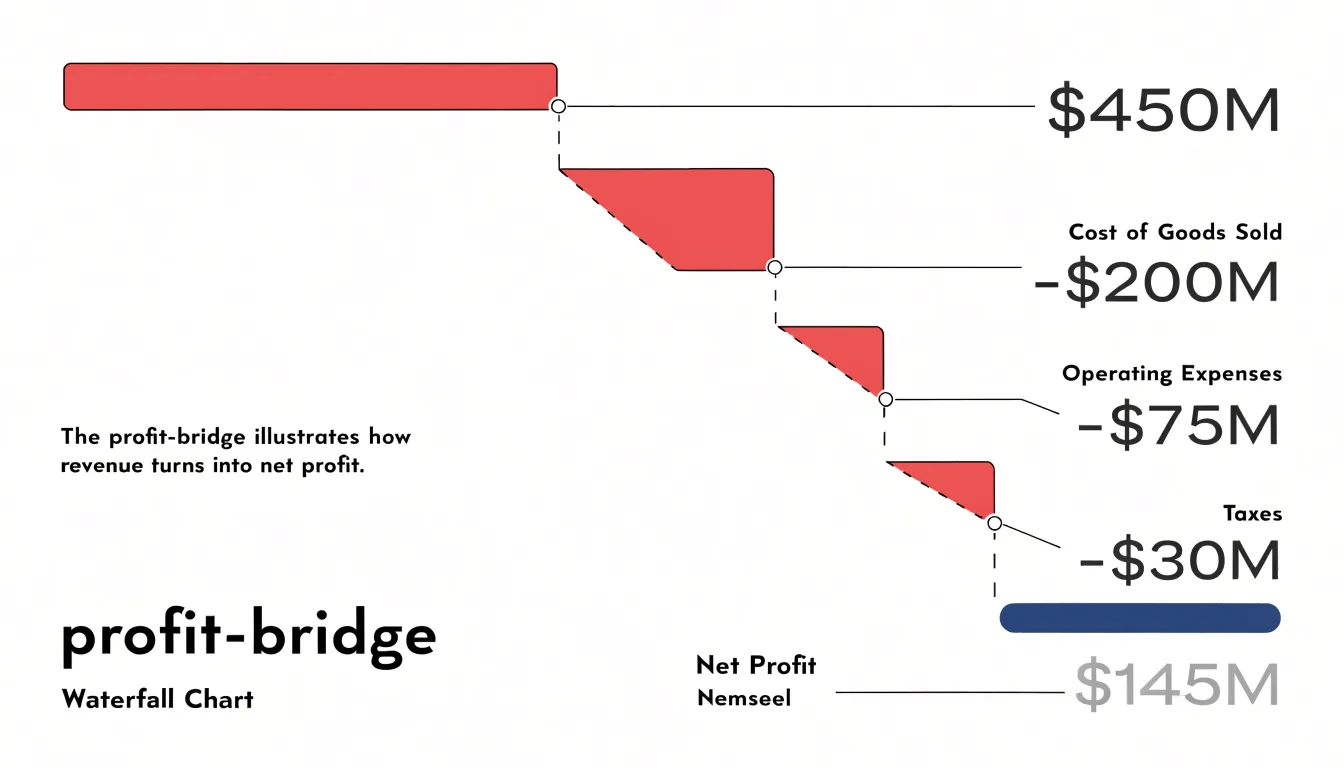
Common applications include profit bridges that walk from revenue down to net income, cash flow statements that track an opening balance through receipts and payments, headcount reconciliations, and variance analyses comparing budget to actual. In each case the chart answers a specific question: given a known start and a known end, which individual factors produced the difference, and in what order did they act.
Stacked Bar Chart
A stacked bar chart presents each entity as a single bar whose full length represents a cumulative total, with that length divided into segments that correspond to sub-categories. The overall bar height answers a question about magnitude, such as total revenue, total headcount, or total spending, while the internal divisions show how that magnitude breaks down into its component parts. This dual reading makes the chart useful when the primary interest lies in comparing totals across distinct entities and the secondary interest lies in understanding the internal composition of each total. For example, a chart of regional sales might show one bar per region, with each bar split into product-line segments; the viewer can immediately see which region sells the most in aggregate and which product lines drive that result.
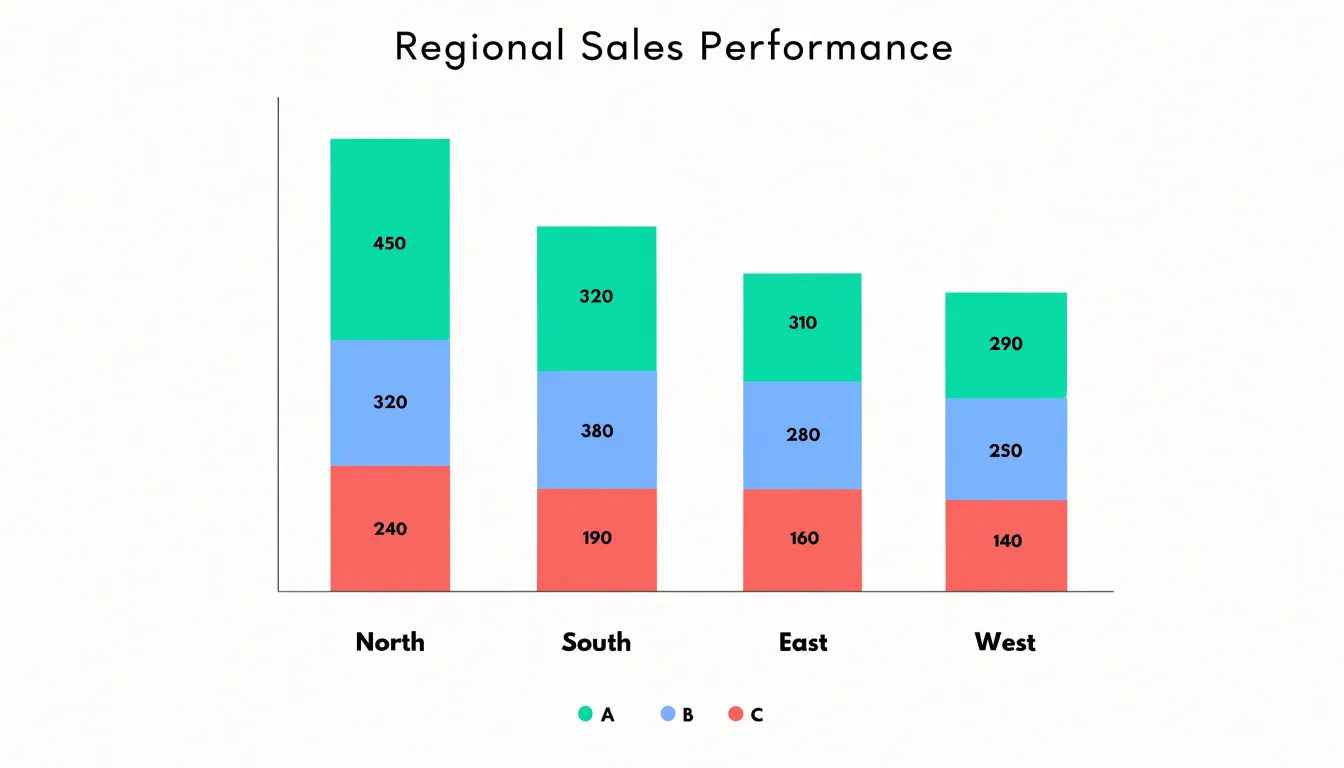
The design works because every bar shares the same zero baseline and the same scale, so total lengths can be compared directly across entities. Stacked bars handle multiple sub-categories without requiring separate charts for each one, which keeps the comparison compact and visually coherent.
The trade-off is that only the bottom segment sits on a common baseline, so segments higher in the stack shift position depending on what sits beneath them and are harder to compare precisely across bars. Ordering segments consistently, limiting the number of sub-categories, and labeling values directly can mitigate this limitation.
Core Differences
The core difference between waterfall charts and stacked bar charts lies in the dimension of data each one is designed to reveal: progression versus composition.
A waterfall chart organizes data as a chronological or logical narrative. Connector lines link each floating step to the next, prioritizing sequence so the reader follows the journey of how a figure began, which factors pushed it up or down, and where it landed. It reserves its forward motion for cumulative progression, treating each step as a cause leading to an effect.
A stacked bar chart treats its data as a static snapshot of parts making up a whole. The purpose is to show the relative proportions of each segment at a given point in time, so readers can quickly judge which components dominate and how the pieces divide the total. The internal arrangement of segments serves comparison of ratios rather than sequence; there is no inherent narrative moving from one segment to the next. When multiple bars appear side by side, they invite comparison of part-to-whole ratios across categories or periods, leaving the movement between totals as a secondary observation.
Choosing between them depends on whether the question concerns how a value evolved step by step or how a total divides among its parts.
Reading Waterfall Charts
Reading a waterfall chart requires recognizing that the empty space beneath a floating column is not empty data. It is the accumulated running balance at the time of that step, which is why the vertical position of a bar carries as much meaning as its height. The bottom edge of a rising bar sits at the prior running balance and the top edge shows the new total; for descending bars, the top aligns with the previous balance and the bottom marks the adjusted figure.
Color coding reinforces this reading. In most implementations, blue or green columns mark increases and red or orange columns mark decreases, while totals at the beginning and end sit on the baseline in a neutral tone. A quick scan of color across the chart reveals the rhythm of accumulation and drawdown: clusters of red between stretches of blue tell you where value is being consumed rather than created. The height of each band corresponds to the magnitude of change, so a tall red bar next to a short one signals a dominant cost driver and a minor adjustment respectively.
Subtractive drivers deserve particular attention. Cost items such as discounts, returns, or operating expenses lower the running balance, and tracing where each reduction lands shows which stage of the process absorbs the most value. Follow the connector lines between columns; they mark the exact level at which one bar hands off to the next. When a middle bar looks surprisingly large relative to its neighbors, check the label to confirm whether it is a subtotal marker anchored to the baseline or a genuine floating change, since misreading that distinction compresses or distorts the whole story.
Reading Stacked Bars
When reading a stacked bar chart built on a zero baseline, the first segment rises from zero, the second begins where the first ends, and so on. Because upper segments do not share a baseline, readers should compare segments of the same color across bars by noting where each segment starts and ends, rather than judging by the middle of a segment in isolation.
Segment order carries meaning and should stay consistent. If categories appear in the same sequence in every bar, viewers can trace a category across the chart with their eye and see how its share changes. Reordering segments between bars makes comparisons unreliable. Place the most important or most stable category at the bottom, where it anchors the bar on the common baseline and remains easiest to read.
Relative bar lengths also require careful attention. Total lengths compare wholes across bars, but a longer bar does not mean every category inside it is larger. A tall bar may be driven by one dominant segment while other segments remain small. Readers should resist judging a single category by the overall height of the bar that contains it. Checking the axis and the baseline, confirming that segments sum to the total, and looking at the direct labels around the chart all help prevent misreading.
Financial Tracking
Financial tracking relies on clear visibility into how individual line items combine to produce a final result, and the waterfall chart serves this purpose well in budget and profit reporting:
- Variance analysis: A waterfall begins with a baseline figure such as the planned budget and displays each contributing factor as a floating bar that raises or lowers the running total. A department head reviewing quarterly spending can see at a glance which categories pushed costs above or below plan, making the bridge from budgeted to actual figures explicit and auditable.
- Net profit progression: Starting with gross revenue, the waterfall steps through cost of goods sold, operating expenses, taxes, and other deductions, arriving at net profit as the final bar. Each intermediate step shows the cumulative effect of the preceding items, so readers can trace exactly where margin eroded or improved. Placing these charts side by side across fiscal quarters reveals trends in cost structure and profitability without requiring readers to reconstruct the arithmetic themselves.
- Revenue bridge reporting: A bridge chart opens with prior-period revenue and attributes the change to new business, lost accounts, price adjustments, and volume shifts. The final bar reconciles to current-period revenue, giving leadership a narrative of growth drivers and drags for board presentations and investor communications.
Category Comparison
Stacked bar charts excel at survey and demographic reporting because they keep the part-to-whole relationship visible within every category:
- Market segmentation studies: Each bar can represent a customer segment such as age bracket or income tier, with colored segments showing the share of respondents who prefer each product line. A reader can scan across bars to compare segment sizes and look down within a single bar to see how preferences split.
- Likert survey data: Each question becomes a bar, and the segments run from strongly disagree through neutral to strongly agree. The resulting shape reveals at a glance whether responses cluster at one end, spread evenly, or concentrate in the middle, which is often more informative than a single average score.
- Demographic distributions: Bars represent regions or age groups while segments show categories such as education level or household composition.
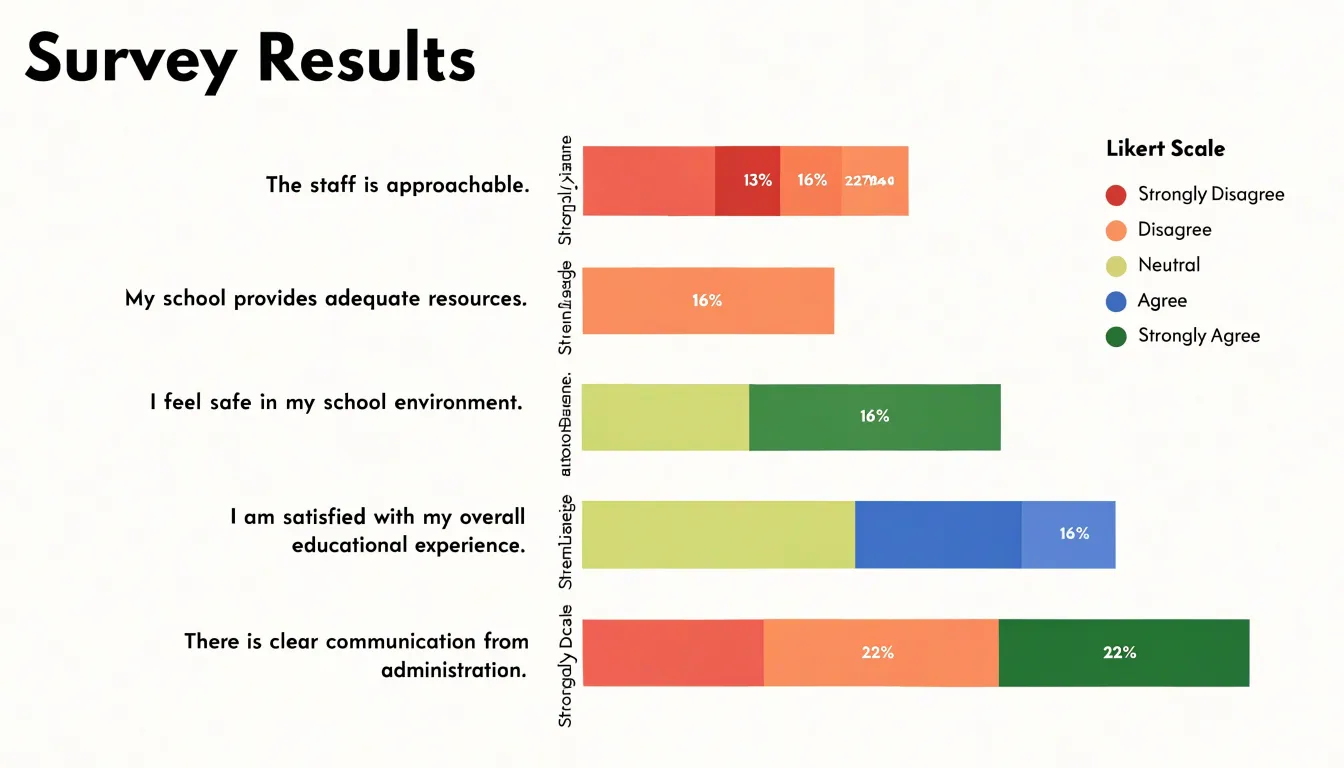
Comparisons across distinct audience groups stay intuitive when every bar shares the same segment order and color scheme, so readers learn the legend once and apply it throughout the chart. For clarity, order segments in a meaningful sequence rather than alphabetically, keep segment counts to roughly five or six, label percentages directly when precision matters, and use consistent colors across related charts so audiences can track the same category from figure to figure.
Handling Negative Values
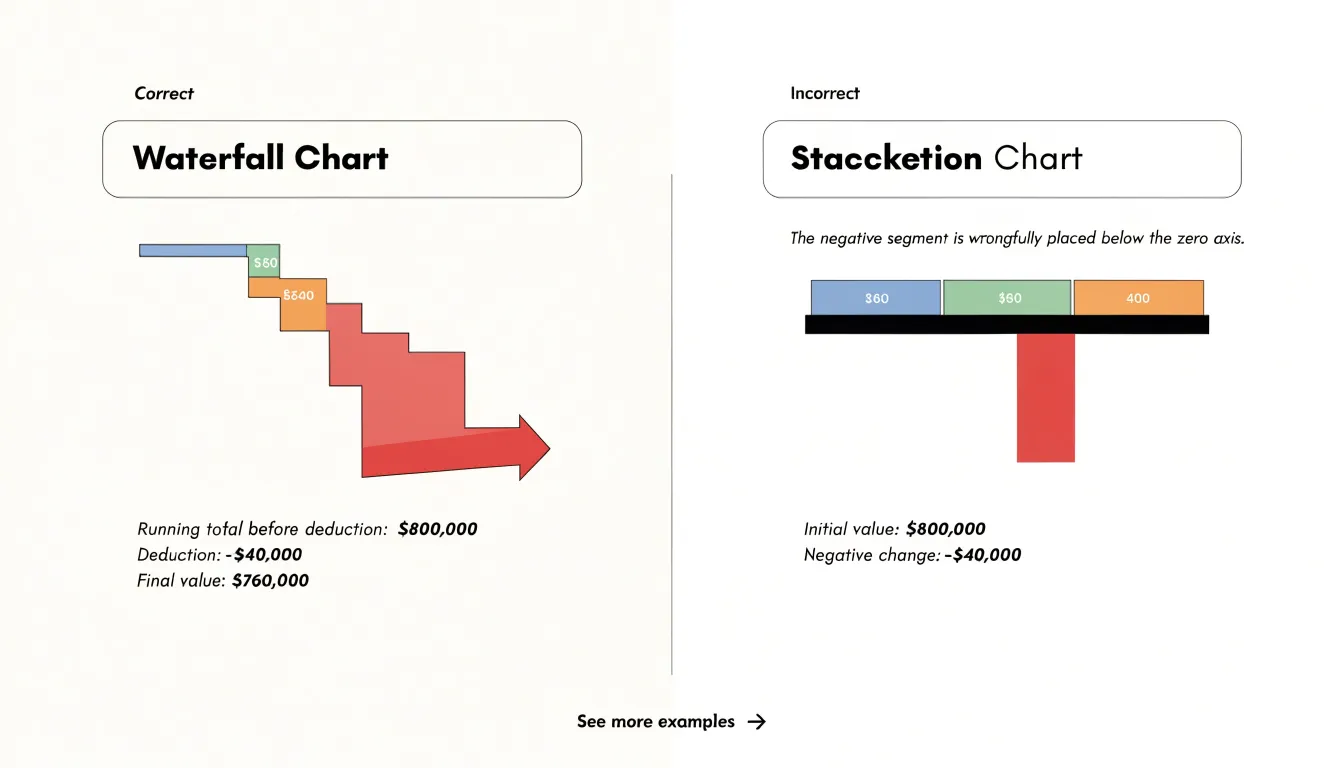
Negative values present a clear situation where chart choice affects comprehension. A stacked bar chart builds each category by placing segments end to end, which works well when all contributions are positive. When a segment represents a deduction, however, the stacked format has no natural place to put it. Designers often resort to plotting the negative value below the zero axis or letting it subtract from the running total in a way that visually overlaps earlier segments. The result obscures the logic of the calculation: a reader cannot easily see which baseline the deduction applies to, and the relationship between the starting total, the reduction, and the ending total becomes difficult to trace.
A waterfall chart handles negative values by design. Because each bar begins at the level established by the previous running total, a deduction is simply drawn as a downward step from that level. The visual metaphor of stepping down mirrors the arithmetic itself, so a cost reduction, a returned item, or a loss is shown as a clear subtraction from a specific starting point rather than as an abstract segment buried in a stack. Stakeholders can point to a single step and understand its effect on the total without mentally reconstructing the stacking order.
Managing Many Categories
Stacked bar charts remain readable when the number of categories grows, provided the design supports the viewer’s ability to compare segments across bars. A common practice is to begin with three to six top-level groups and consolidate smaller categories into an “Other” bucket so the chart keeps its visual clarity.
Color legibility is the central constraint once sub-segmentation becomes complex. Reserve the strongest hues for the primary groups and use lighter tints, patterns, or desaturated variations for secondary segments within them. This creates a visual hierarchy that mirrors the structure of the data. Palettes built from a single base color with graded lightness steps work well for ordered categories, while distinct hues suit unrelated groups. Limit the palette to roughly five to seven colors; beyond that, adjacent segments become difficult to tell apart at a glance.
A clear legend is essential when many categories are present. Place it close to the chart, group entries in the same order as the segments appear, and use direct labels on the largest segments where space allows. Interactive tooltips and hover highlighting can carry the finer detail, letting the static view stay clean. Sorting bars by total or by a key segment, and annotating the most important takeaways, helps readers navigate the additional complexity.
Time Series
Waterfall charts are ideal for time series where each step represents a discrete milestone, adjustment, or operational event. By arranging bars so that each starts where the previous one ended, the chart creates a visual narrative of incremental fluctuations—whether a revenue figure rising after a product launch, a cost base shifting with each procurement decision, or a project budget depleting as phases complete.
In continuous operational contexts, waterfalls can capture shifts that occur at regular intervals, such as daily production output or weekly customer churn, by treating each period’s net change as a distinct step. This shows how small, ongoing adjustments accumulate into significant movements over time.
For project management, the waterfall format maps naturally onto phase-by-phase progress: each completed stage adds or subtracts from the total, highlighting whether the project remains on track or veers off course at specific milestones. This granular view supports root-cause analysis by pinpointing which phase introduced a deviation. Unlike line charts that smooth transitions, waterfalls preserve the discrete nature of events, making them particularly useful for auditing and reporting where the exact sequence of changes matters.
Cross-Sectional Snapshots
A cross-sectional snapshot captures the composition of several fixed groups at one moment in time, and the stacked bar chart is built for this view. Because every bar shares a common baseline and scale, a reader can scan horizontally across departments, regions, or product lines and compare breakdowns unit for unit without translating between incompatible axes.
This side-by-side arrangement makes differences in composition immediately legible. If the marketing bar for a given quarter is split evenly among five channels while the sales bar is dominated by a single segment, the imbalance shows up as a difference in segment heights at a glance. Analysts can see which groups carry a heavy concentration in one component and which are more evenly distributed, and they can judge whether a large share of one component in one group is matched, exceeded, or absent in another.
Meanwhile, overall bar heights reveal the relative size of each group’s total, so a department with a modest overall figure but a striking internal mix remains easy to spot next to a much larger peer. This combination of total and composition in one frame suits reporting cycles where stakeholders need an overview of many business units at once, such as quarterly reviews, budget allocations, or regional performance summaries.
Common Design Pitfalls
Both chart types fail when overloaded or poorly scaled:
- Over-segmentation and clutter: In a waterfall chart, adding numerous small adjustments creates a dense thicket of bars that obscures the overall trend and gives minor contributions equal visual weight to major ones. Group small items into an “Other” category or use a secondary chart for details. Similarly, stacked bar charts with more than five to seven segments become difficult to read across bars.
- Misleading baselines: In both waterfall and stacked bar charts, the quantitative axis should start at zero to accurately represent the magnitude of totals and changes; otherwise, the visual impact of increases, decreases, and relative segment sizes is distorted. Always start the axis at zero unless there is a compelling reason, and clearly indicate any truncation. In waterfalls, floating bars can also confuse viewers if their start and end points are unambiguous or if connector lines are omitted.
- Ambiguous color choices: Using too many similar hues or inconsistent colors across charts causes misinterpretation. In waterfall charts, use distinct, consistent colors for increases, decreases, and totals. In stacked bar charts, maintain the same color assignment for each category across all bars. Avoid red-green combinations that are problematic for color-blind viewers, and consider using patterns or direct labels as additional cues.
Audience Readability
When presenting to non-technical stakeholders, consider what visuals they already encounter in their daily work. Executives often review dashboards and summary reports built around standard bar charts, line charts, and pie charts, so these formats carry a built-in familiarity that reduces the time spent explaining the graphic itself.
Cognitive load matters just as much. Every element in a chart—legends, axis labels, color keys, annotations, and marks—demands mental effort to decode. Waterfall charts can carry a higher burden because they combine cumulative totals with incremental changes, requiring the reader to track both the running balance and each individual step. Stacked bars add their own load by asking viewers to compare unaligned segments across categories while also judging the overall height of each bar.
A clean layout with restrained color, clear labels, and a single obvious focal point lowers this effort, while decorative extras, dense grids, and crowded legends add noise. Testing a draft chart on a colleague outside the analytics team offers a practical check on whether the chosen format communicates immediately.
Decision Framework
Before committing to either chart, run through a three-part diagnostic checklist:
- Check the data structure: Ask whether your values decompose into sequential changes from a defined starting point to an ending point. If your numbers represent a running total that rises and falls through additive or subtractive steps, a waterfall structure maps directly onto that logic. If instead your values are independent categories that each break into consistent, positive sub-components, a stacked bar arrangement preserves that categorical comparison more naturally.
- Clarify the primary communication goal: Write down the single sentence you want a reader to repeat after viewing the chart. When that sentence centers on how individual contributions drove a net change, choose the waterfall format. When the sentence centers on comparing totals across categories while showing internal composition, choose the stacked bar format.
- Weigh stakeholder technical depth: A general business audience often grasps waterfall charts quickly because the bridge metaphor from start to finish is intuitive, though connector lines and positive-versus-negative coloring benefit from a brief legend. Analysts and finance teams are comfortable with both formats, while audiences less familiar with quantitative displays may find stacked segments harder to read when many components are present.
Frequently Asked Questions
What is the difference between a waterfall chart and a stacked bar chart?
A waterfall chart shows progression—how a sequence of changes moves a value from a starting point to an ending point—while a stacked bar chart shows composition, or how a total divides into parts at a point in time. Waterfall charts prioritize sequence and cumulative change, whereas stacked bars focus on part-to-whole comparison.
When should I use a waterfall chart instead of a stacked bar chart?
Use a waterfall chart when the question is how a value evolved step by step or which individual contributions drove a net change. Use a stacked bar chart when you need to compare totals across categories while also showing each total’s internal composition.
How do you read a waterfall chart?
In a waterfall chart, floating columns show each change, and the empty space beneath a floating bar represents the accumulated running balance at that step. The bottom and top edges of rising and falling bars align with the prior balance and the new total, and connector lines show where one bar hands off to the next.
How does a waterfall chart handle negative values?
A waterfall chart draws a deduction as a downward step from the level established by the previous running total, so the subtraction is tied to a specific starting point. By contrast, a stacked bar chart has no natural place to put a negative segment and can make the calculation harder to trace.
What are common design pitfalls for waterfall and stacked bar charts?
Common pitfalls include over-segmentation and clutter, misleading baselines, and ambiguous color choices. The quantitative axis should start at zero to avoid distorting totals and changes, and colors should be distinct and consistent.
How many segments should a stacked bar chart have?
Keep segment counts to roughly five or six for clarity, and note that stacked bars with more than five to seven segments become difficult to read across bars. For many categories, start with three to six top-level groups and consolidate smaller categories into an “Other” bucket.
Tony Astor
Tony writes about data visualization and the tools people use to build charts and dashboards. More about Data Illustrator