Waterfall Chart: Showing How a Value Builds Up or Down
 By Tony Astor ·

Waterfall Chart
A waterfall chart is a visual tool that tracks how a starting value changes through a sequence of intermediate steps, using floating bars that connect to show cumulative impact. Each bar represents a single increase or decrease, with the final bar showing the ending total. It is used to reconcile figures, spot outliers, and attribute changes to specific categories.
Table of Contents
Waterfall Chart
A waterfall chart tracks how a starting value builds up or down through a sequence of intermediate steps, with each step represented as a floating column that begins where the previous one ended. An opening bar establishes the baseline metric, and each subsequent bar rises or falls by the amount of a single transaction, adjustment, or category shift. Connecting lines between the bars anchor each step to the level reached before, so the eye follows the cumulative path from opening balance to closing balance without losing track of where any change originated. Positive movements typically extend upward from the running total, negative movements extend downward, and a final bar consolidates the accumulated result.
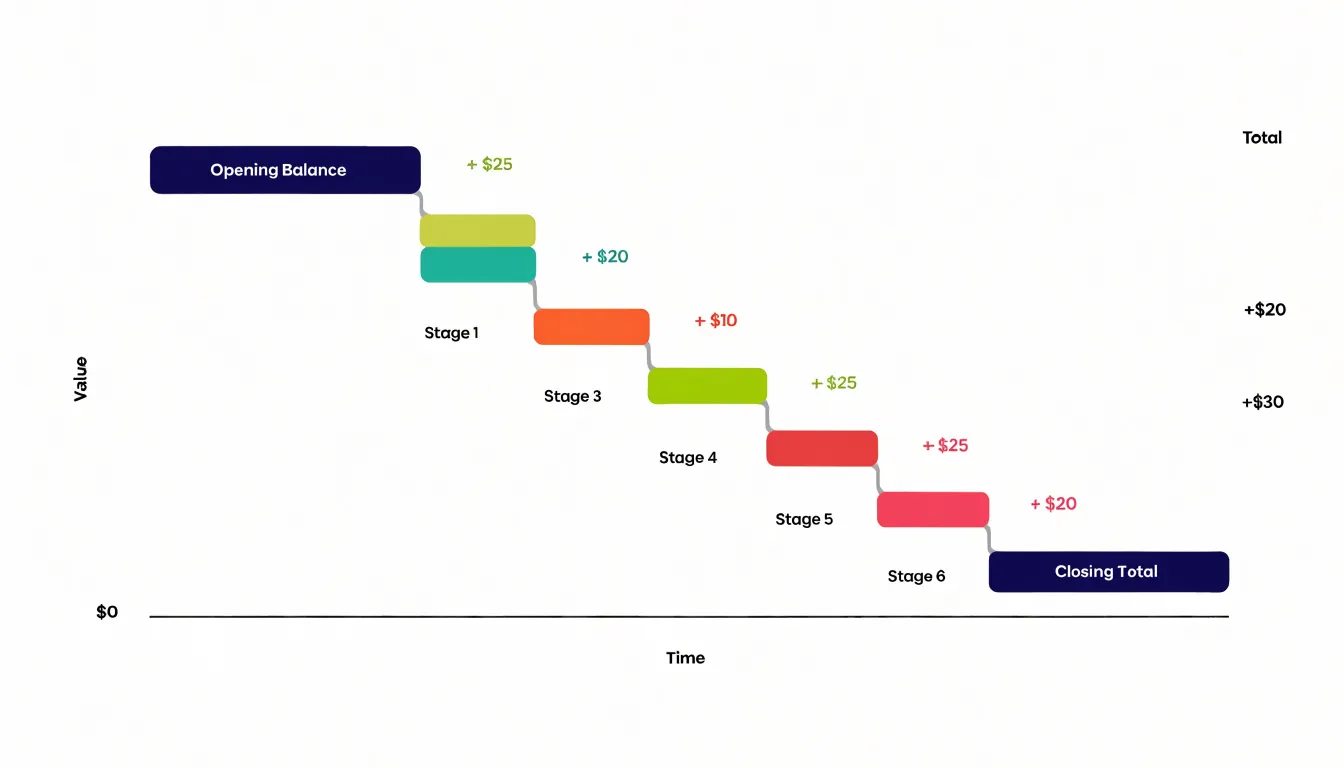
The value of this step-by-step tracking lies in the visibility it gives to individual contributions. A simple start-and-end view shows that a metric moved from one number to another, but hides the cause. The waterfall exposes each increment in sequence, so a large gain in one category and an offsetting loss in another appear as separate, legible events rather than cancelling out into a single net change. Analysts can attribute movements to specific transactions, periods, or cost categories, and readers can see at a glance which steps contributed most to the overall shift.
This sequential view supports several practical uses:
- Reconciliation: Clarifies exactly which items bridge two reported figures.
- Outlier detection: Highlights anomalies, since an unusually tall step stands out against its neighbours.
- Composition analysis: Reveals whether growth came from many small increments or a few dominant ones.
Because the chart preserves the order and magnitude of each step, it gives decision-makers a clear basis for understanding where to intervene or where momentum is concentrated.
Waterfall Chart
Placing positive and negative changes side by side along a shared running total allows stakeholders to distinguish gains from losses without performing mental arithmetic or consulting a separate table. Because all changes share the same scale, the relative size of each gain and loss is directly comparable. A large upward bar next to a small downward bar makes the net effect obvious at a glance.
This juxtaposition is particularly useful when the order of changes matters, such as in financial statements or performance tracking. Stakeholders see not only the net result but also the path taken to reach it, allowing them to spot patterns in the sequence and focus attention on the most significant movements. Presenting the full path in a single view reduces cognitive load and supports faster decision-making.
Waterfall Chart
Waterfall charts are well suited to everyday financial planning and operational tracking across several domains:
- Personal budgeting: A chart can begin with monthly income and step through rent, utilities, groceries, transport, and discretionary spending, ending at the amount left over or saved. Each bar isolates one category, showing immediately which expense consumes the largest share and where a small adjustment would free up meaningful cash.
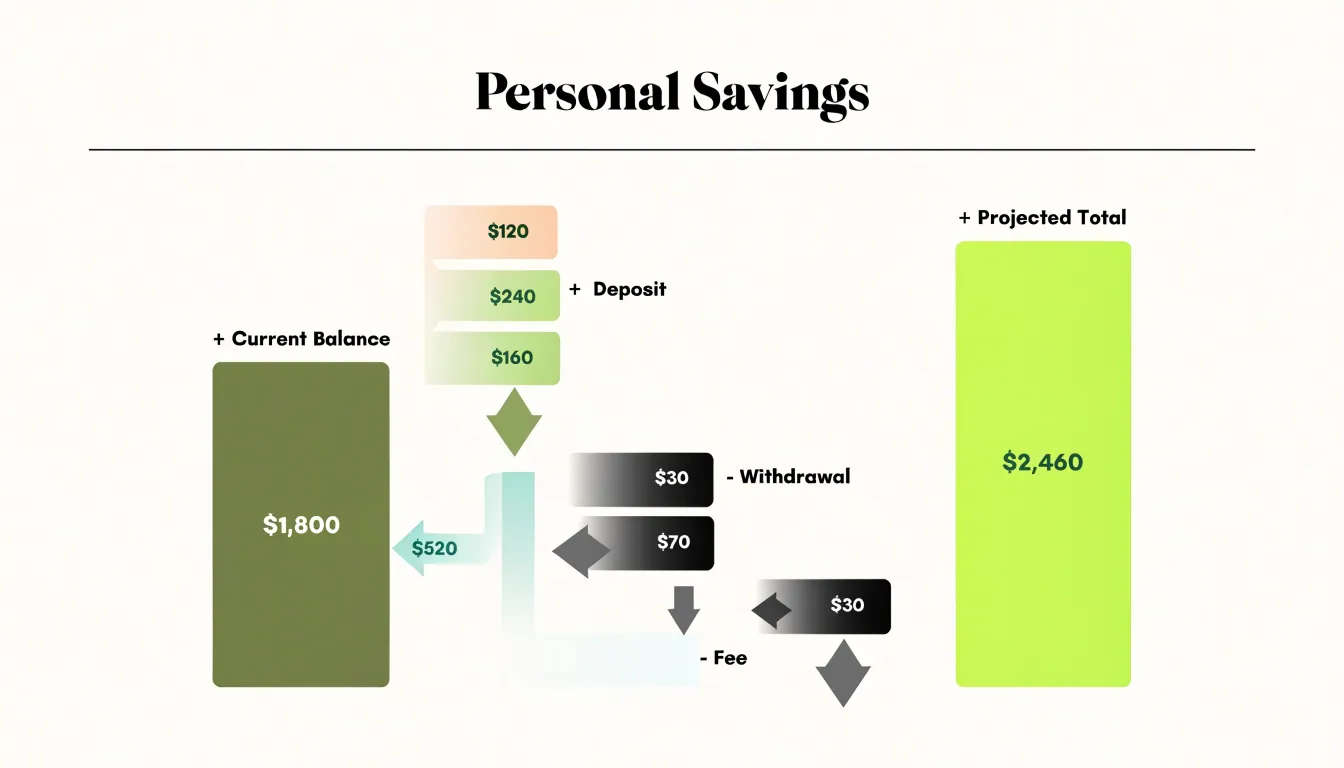
- Savings goals: Start with the current balance, add deposits, subtract withdrawals and fees, and arrive at the projected total to show how steady contributions compound over time.
- Inventory and stock variance: A warehouse manager can open with the stock level at the start of a period, then show receipts, sales, returns, shrinkage, and damage as separate steps that resolve into the closing count. This highlights where losses originate and how much each source contributes to the final variance. Retailers use similar layouts to reconcile expected stock against physical counts and trace discrepancies across suppliers or locations.
- Net worth growth: Beginning with assets and liabilities at the start of a year, a waterfall can walk through salary, investment gains, debt repayment, major purchases, and interest costs to reach the year-end position.
Advisors and finance teams in banking, manufacturing, logistics, and retail rely on waterfall structures to monitor dynamic resource shifts because every intermediate total remains visible.
Waterfall Chart
A waterfall chart consists of three distinct structural elements:
- The baseline column: Establishes the starting value, typically anchored at the bottom of the chart as a solid bar (such as beginning inventory or an opening budget balance). It sets the reference point against which every subsequent step is measured.
- Intermediate floating bars: Illustrate the incremental changes between the start and the end. The vertical position of each floating bar shows the cumulative total after that step, while its height or depth shows the magnitude of the change.
- The final sum column: Presents the ending value after all steps have been applied. It is typically a solid bar resting on the same baseline as the starting column, allowing for a direct visual comparison between the beginning and ending states.
Waterfall Chart
A reader scanning a waterfall chart should be able to tell at a glance which bars push the running total upward and which pull it down, before reading a single axis label. The most familiar convention treats increases as green and decreases as red, drawing on widespread cultural associations with growth, profit, and warning. Deviating from this convention forces readers to pause and decode.
To ensure colors hold up under real-world viewing conditions, follow these guidelines:
- Design for accessibility: Increases and decreases should differ clearly in both hue and lightness so the chart remains legible in grayscale printing and to readers with color vision deficiencies. Red and green alone fail this test for many people, so pair color with a secondary cue, such as a lighter or darker shade, a subtle pattern, or plus and minus labels on each bar.
- Maintain background contrast: Muted pastels on a white page blur into the gridlines, while overly saturated tones create glare that tires the eye.
- Stay consistent across reports: Once a color means increase, it should keep that meaning across every chart in a dashboard, deck, or recurring report. Document the palette in a shared style guide and apply it consistently to totals, subtotals, and step bars.
Waterfall Chart
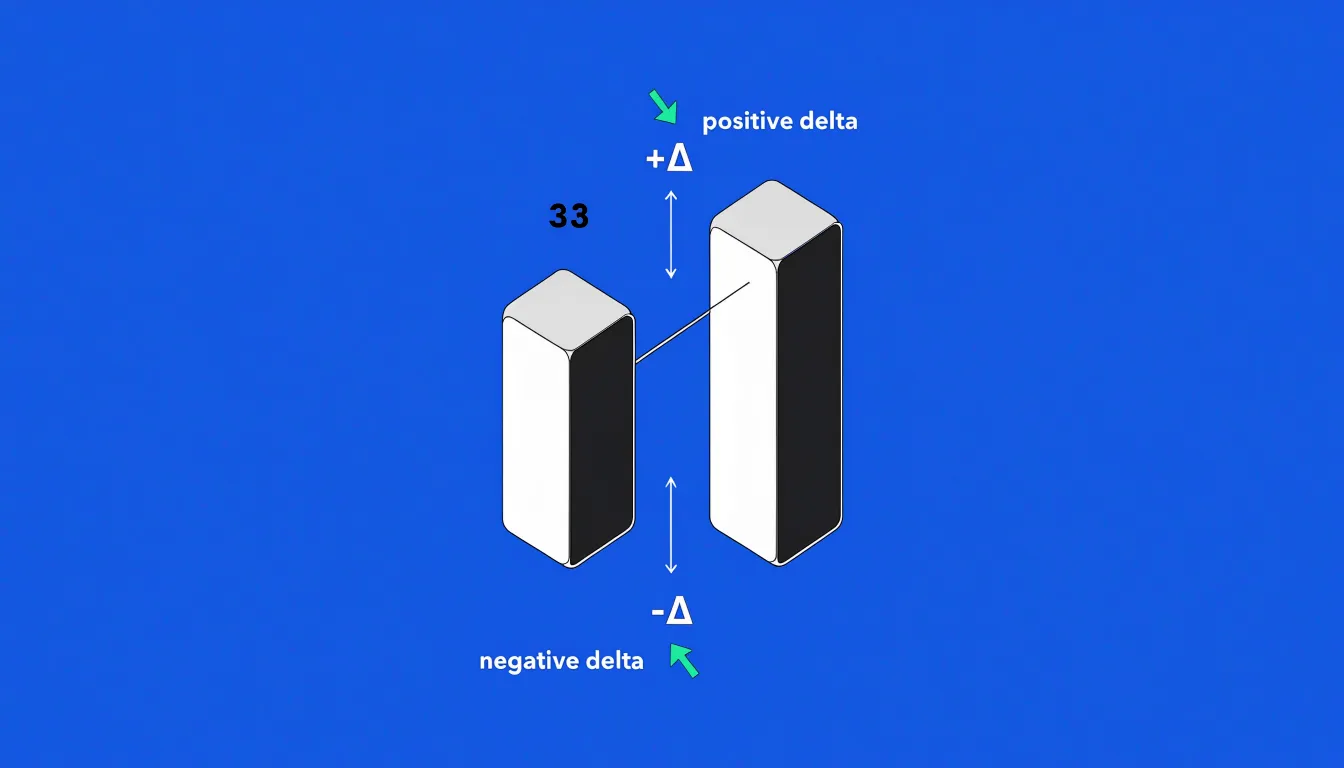
Floating bars represent incremental deltas rather than absolute totals anchored to a common baseline. Each floating bar spans a vertical range defined by its starting and ending values, so its length corresponds to the magnitude of the change. It does not extend to the horizontal axis unless the value it represents happens to be measured from zero.
The starting point for each floating bar is the endpoint of the previous bar:
- Positive delta: The bar begins at the top of the preceding bar and extends upward.
- Negative delta: The bar begins at the bottom of the preceding bar and extends downward.
The edges of these bars represent the intermediate running totals after each step, forming a continuous chain from the starting column to the ending column.
Waterfall Chart
A profit-and-loss (P&L) statement packs a great deal of information into rows of figures, which readers without a finance background often struggle to interpret. A waterfall chart simplifies income and expense reports by starting with total revenue and stepping down through each category of expense or adjustment, creating a visual bridge from gross income to net margin.
When presenting to executives who need a fast, accurate grasp of performance without reading every line of the ledger, finance teams structure the chart to highlight key drivers:
- Revenue streams: Product lines, service contracts, and other income sources appear as upward steps at the top to establish the starting position.
- Cost drivers: Downward steps separate expenses into categories such as cost of goods sold, operating expenses, and one-time charges.
An executive can scan the chart to identify whether a single expense category consumed an outsize share of revenue or a particular income stream carried the quarter. Marking budget figures alongside actuals, or running the same chart across consecutive periods, lets leadership see where variance accumulated and turns a compliance document into a focused tool for diagnosing profitability.
Waterfall Chart
Project managers use waterfall charts to track how resources and progress evolve over the project lifecycle:
- Scope changes: Each addition or removal appears as a distinct step, showing the cumulative impact on the project baseline and helping managers spot scope creep early.
- Team hour burn-downs: The chart can show planned versus actual hours consumed over time, with each period’s burn-down represented as a downward step. When actual burn-down exceeds planned, the steeper decline signals potential delays, prompting managers to investigate bottlenecks like underestimated tasks or resource overallocation.
- Budget allocations: Tracking cumulative spending with each expense category as a step makes resource leaks—such as unexpected costs or area-specific overspending—visible early enough to take corrective action before final deliverables are impacted.
Waterfall Chart
Standard bar graphs are built for comparing discrete categories or highlighting final values, but they fall short when explaining how a starting figure transforms into an ending figure. Because every bar in a standard bar chart stands alone on a common baseline, viewers must mentally calculate the cumulative effect of positive and negative movements.
A waterfall chart solves this by connecting the steps. While a traditional bar chart focuses on the final values of isolated categories, the waterfall’s floating segments and connectors emphasize the flow from one value to the next, making cumulative variance immediately apparent.
Waterfall Chart
Preparing and formatting your data before building a waterfall chart prevents common rendering problems, such as totals being mistaken for increments or bars stacking incorrectly. Follow these preparation steps:
- Create a three-column structure: Set up dedicated columns for category or step labels, positive values (increases), and negative values (decreases). Separating positive and negative movements gives software tools an unambiguous signal about direction.
- Add a sequence column: Explicitly number each step from the starting total to the ending total. Relying on row order alone invites errors if the table is sorted or filtered later. Include clearly labeled rows for opening and closing totals to serve as anchors.
- Clean the data: Replace blank cells with zeros so gaps do not interrupt connector lines or shift categories out of alignment. Normalize number formats by removing currency symbols, thousands separators embedded as text, and stray spaces that cause values to be read as strings. Remove duplicate category labels and standardize spelling and capitalization.
- Reconcile the totals: Verify that every increase and decrease reconciles to the difference between the opening and closing totals to catch sign errors and misclassified entries before charting.
Waterfall Chart
Excel (2016 and later)
- Lay out your data with category labels in one column and a single adjacent column of values capturing each step from the opening balance to the closing total.
- Select the full range, go to Insert, and choose the Waterfall chart from the chart gallery.
- Excel automatically recognizes subtotal rows if you mark them; to anchor opening, closing, or subtotal bars to the baseline, right-click the specific data point and choose Set as Total.
- Use the Format Data Series pane to adjust gap width, and enable connector lines through the chart options.
Google Sheets
When using the stacked column workaround in Google Sheets, follow these steps:
- Add three helper columns alongside your labels: one for the base offset, one for decreases, and one for increases. The base column holds the running value below each bar so the visible segment floats at the right height.
- Select the labels and helper columns, then insert a Stacked Column Chart.
- Format the base series with no fill so they disappear, and hide the legend entries for the base series.
Troubleshooting
- Bars refuse to sit on the baseline: Usually indicates a mislabeled total or a stale cached range.
- Wrong subtotal colors in Excel: Subtotal bars sometimes render in the wrong color until you manually set the point fill.
- Visible base in Sheets: The invisible base can show a faint outline if the border color is not explicitly set to none.
- Inverted negative values in Sheets: Negative values can stack in the wrong direction unless you fix the axis minimum explicitly.
Waterfall Chart
While incremental bars float to show movement, subtotals and final totals mark the running balance at a given checkpoint and must sit firmly on the horizontal axis, rising from zero. If these bars are left in their default floating state, the eye reads them as just another step change, breaking the chart’s visual logic.
In most spreadsheet tools, you configure this point by point:
- Select the individual data point representing a subtotal or grand total.
- Right-click to open the formatting options (such as the Format Data Point pane).
- Enable the setting that designates the point as a total (labeled Set as Total, a checkbox for total, or a setting to fix the base value to zero). Repeat this for each intermediate subtotal.
Once anchored, these solid columns provide stable reference points that summarize cumulative performance between floating change bars.
Waterfall Chart
To keep a waterfall chart accurate and easy to interpret, avoid these common design pitfalls:
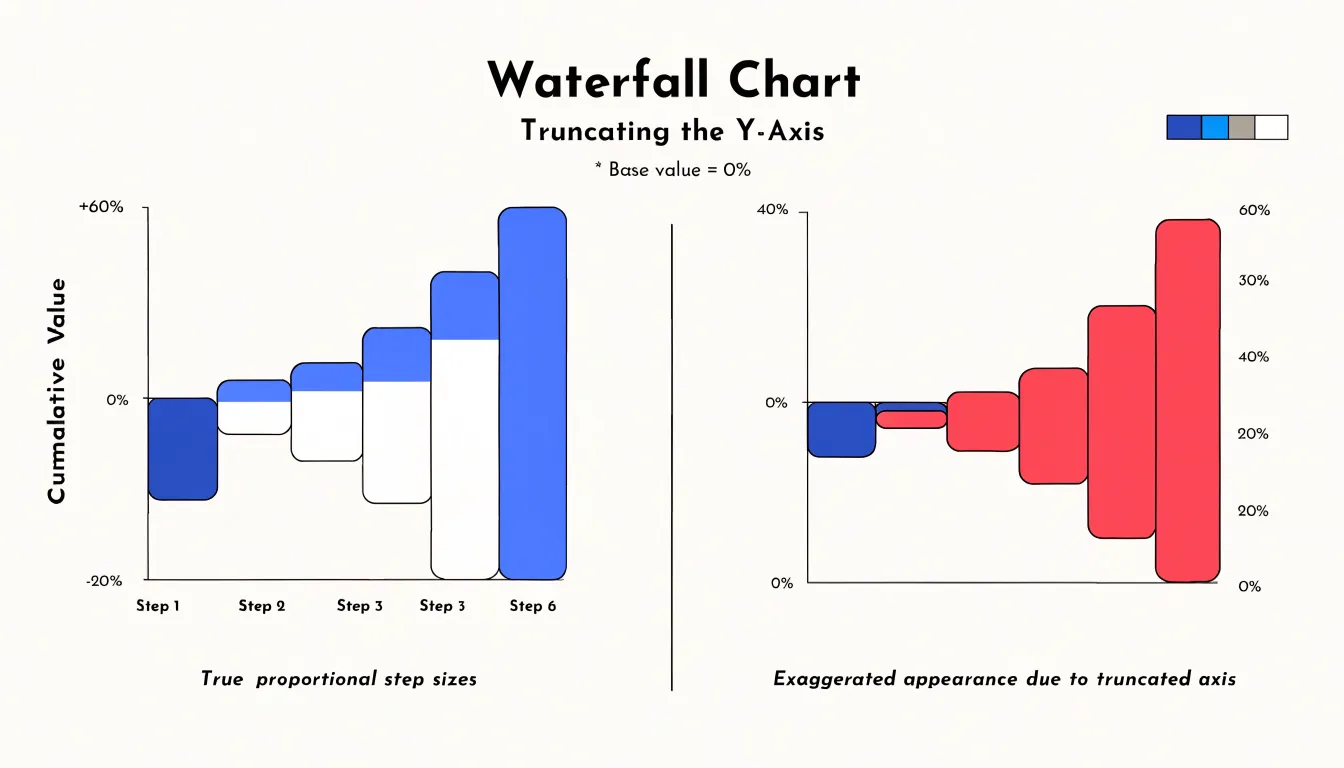
- Truncated Y-axis: Starting the vertical axis at a value other than zero exaggerates differences and distorts the relative size of incremental steps. Always use a zero baseline and include visible starting and ending total bars.
- Visual clutter from minor categories: Displaying too many tiny increments individually makes the chart noisy and obscures the main drivers. Consolidate minor values into a clearly labeled “Other” category, and detail its contents in a footnote or supplementary table if necessary.
Waterfall Chart
Refining connector lines, data labels, and overall layout gives the chart a restrained, executive-ready aesthetic:
- Connector lines: Run connectors horizontally from the top edge of one bar to the top edge of the next (or from the bottom edge for decreases). Keep them thin, use a neutral gray, and set them behind the bars so they do not compete with the data. Use dashed or dotted lines when distinguishing subtotal transitions from incremental steps. Align every connector precisely to the bar edge, as even a few pixels of misalignment reads as sloppiness.
- Data labels: Place labels inside the bar when it is tall enough to hold the text comfortably, using white or a light tint for contrast against a saturated fill. For short bars or small values, move the label just above the bar for positive changes and just below for negative ones, keeping a consistent offset. Use a single font size throughout, right-align numbers so digits line up, and apply uniform decimal places and unit symbols.
- Visual restraint: Limit the palette to two or three meaningful colors, reserving the strongest color for the total or final bar. Remove gridlines and borders that add no information, and leave generous white space around the chart.
Waterfall Chart
Following a finance team as they chart a single month’s cash flow illustrates how these mechanics work in practice:
- Opening cash balance: Sits as the first column, anchored at the total carried over from the previous month.
- Operating revenue: Incoming customer payments and collected receivables push the running total upward.
- Overhead expenses: Payroll, rent, utilities, and software subscriptions pull the total down in a series of descending steps.
- Capital investments: Equipment purchases, server upgrades, or facility improvements appear as a distinct downward block, kept separate from routine overhead to isolate discretionary spending.
- Ending cash: Lands as the final total column, anchored at the level the business finished the month with.
When repeated across twelve consecutive months, each month’s ending balance becomes the next month’s starting point, linking the charts into a continuous narrative of liquidity. Scanning the series reveals exactly where and why the ending balance dropped below prior periods or fell short of forecast. A January shortfall, for instance, might trace directly to a capital purchase made alongside a seasonal slowdown in collections. Rather than reading through rows of ledger entries, the team can point to the exact bar responsible and decide whether to delay spending, accelerate receivables, or adjust the forecast.
Waterfall Chart
In group settings and executive dashboards, a waterfall chart serves as a shared reference point, preventing the side conversations that arise when people reconstruct calculations in their heads. To make the most of the chart in dashboards and live meetings:
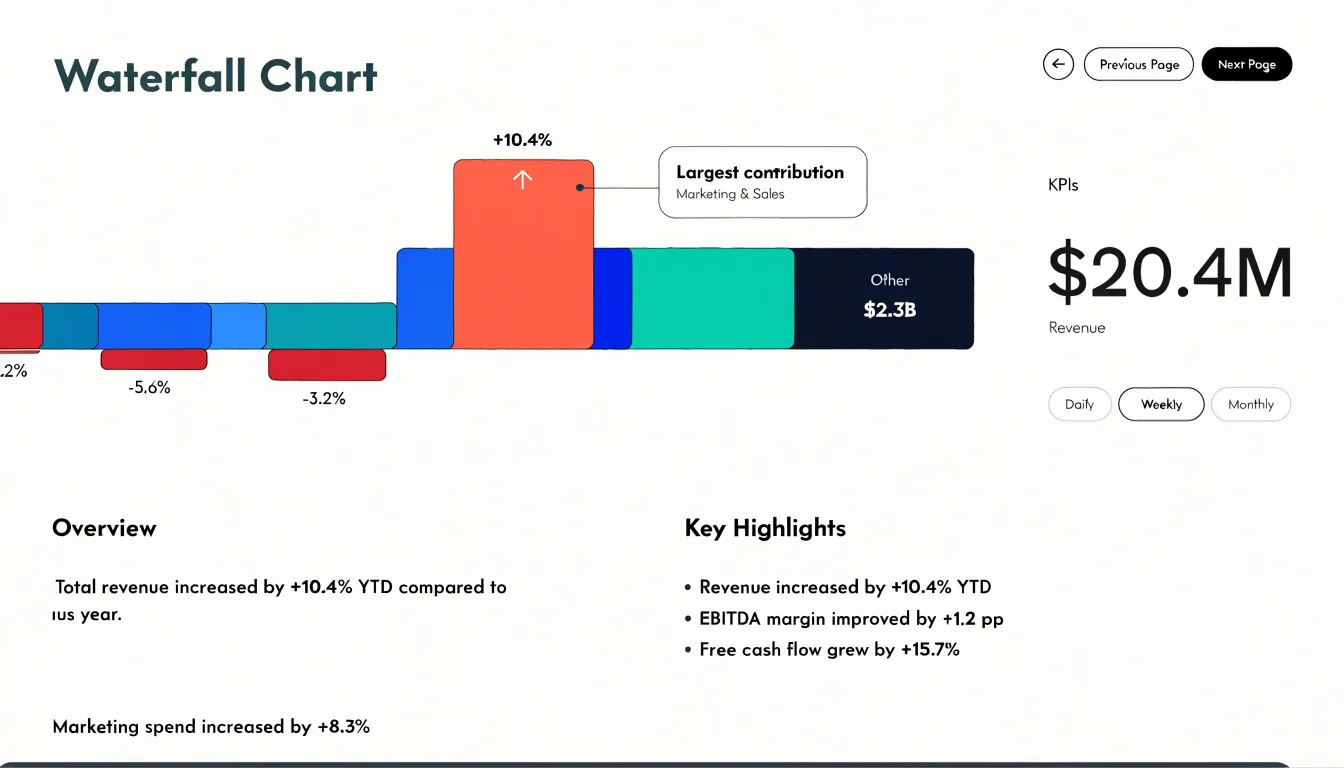
- Dashboard placement: Place the chart near the top of the view, sized large enough that individual bars remain legible on a projected screen, and pair it with a summary figure. Group minor items into a residual bar so the view focuses on a handful of primary drivers.
- Callout annotations: Add a short label above the largest bar, a bracket marking the net change, or a note flagging an unusual step to direct the audience’s attention.
- Meeting presentation: Walk the audience along the chart from left to right, framing the first bar as the starting situation, the middle bars as the forces at work, and the final bar as the outcome. Highlight one bar at a time with color or emphasis while dimming the rest, advancing the highlight as you speak. Rehearse the sequence so the visual pacing matches your spoken pacing, and leave the completed waterfall on screen during the discussion to anchor follow-up questions.
Frequently Asked Questions
What is a waterfall chart?
A waterfall chart tracks how a starting value builds up or down through a sequence of intermediate steps, with each step shown as a floating column that begins where the previous one ended. The opening bar establishes the baseline, and a final bar consolidates the accumulated result.
How do floating bars show increases and decreases?
Floating bars represent incremental deltas rather than absolute totals anchored to a common baseline, so each bar’s length corresponds to the magnitude of the change. A positive delta begins at the top of the preceding bar and extends upward, while a negative delta begins at the bottom and extends downward.
What are common uses of a waterfall chart?
Waterfall charts support reconciliation, outlier detection, and composition analysis. They are also used for personal budgeting, savings goals, inventory and stock variance, and net worth growth.
How does a waterfall chart simplify a profit-and-loss statement?
It starts with total revenue and steps down through each expense or adjustment, creating a visual bridge from gross income to net margin. Revenue streams appear as upward steps, while cost drivers such as cost of goods sold, operating expenses, and one-time charges appear as downward steps.
How do I create a waterfall chart in Excel?
In Excel 2016 and later, lay out category labels and a single adjacent column of values from the opening balance to the closing total, select the full range, go to Insert, and choose Waterfall. Mark subtotal rows if needed, and use Set as Total on specific data points to anchor opening, closing, or subtotal bars to the baseline.
How can I make a waterfall chart clear and accessible?
Use increases and decreases that differ clearly in both hue and lightness so the chart stays legible in grayscale and for readers with color vision deficiencies, and pair color with a secondary cue such as plus and minus labels. Avoid a truncated Y-axis, and consolidate minor categories into a clearly labeled “Other” category.
Tony Astor
Tony writes about data visualization and the tools people use to build charts and dashboards. More about Data Illustrator