Waffle Chart: A Clearer Alternative to the Pie Chart
 By Tony Astor ·

Waffle Chart
A waffle chart is a square grid, usually 10×10, where each cell represents a fixed fraction of the total; in a 100-cell grid, each square equals one percentage point. Filled cells show a part-to-whole proportion, making percentages countable at a glance rather than estimated, with precise, readable results even for small values.
Table of Contents
Waffle Chart
A waffle chart takes the form of a square grid in which every cell stands for a fixed fraction of the total. The most common construction is a 10 by 10 grid, giving one hundred cells in all. Because the grid holds exactly one hundred squares, each individual square corresponds to one percentage point of the whole. Filling sixty squares, for instance, shows sixty percent directly, with no mental arithmetic required from the reader. The grid itself acts as a constant reference frame: the full square always represents the complete total, so the eye can gauge any portion against that fixed boundary.
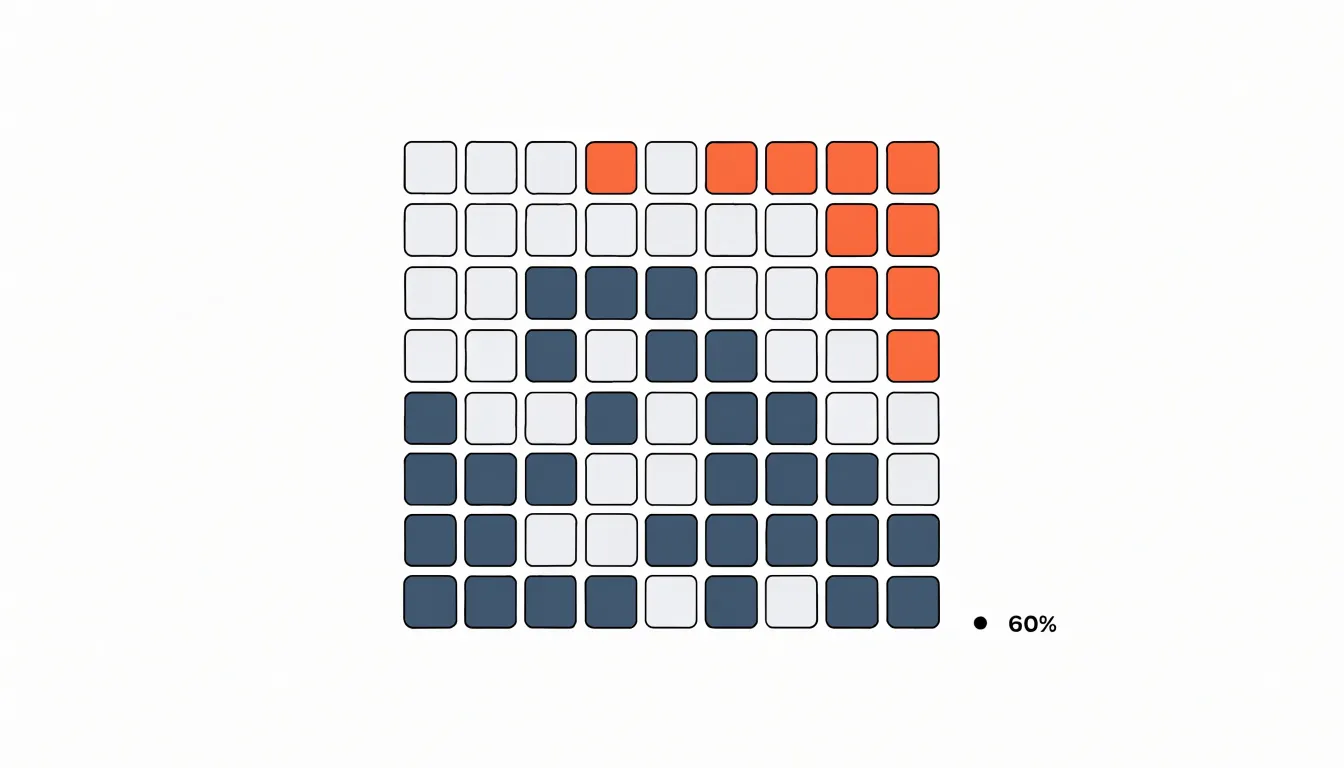
The structure of the grid is what gives the chart its character. Rows and columns are uniform, so squares align cleanly and the filled region forms a compact block that is easy to count and compare. In the standard layout, cells are filled from one corner, usually the bottom left or top left, proceeding row by row. This convention means the boundary between filled and unfilled squares shifts steadily as the value changes, making differences between categories legible at a glance. Many implementations leave a small gap between cells, which helps readers perceive individual squares without losing the sense of an overall block.
The ten by ten format is popular because it maps so naturally onto percentages, but the underlying principle scales to other totals. A grid of five by twenty or ten by twenty still works, provided each square represents a known share of the whole; when the total is not one hundred, each cell simply stands for a proportional slice rather than a single point. What stays constant across these variations is the core idea: a regular array of equal units whose filled count encodes a part of the whole, turning an abstract proportion into something countable and visually stable.
Pie Chart
The pie chart remains one of the most recognizable forms of data visualization, appearing everywhere from annual reports and news articles to dashboards and classroom presentations. Its appeal rests on familiarity: audiences immediately understand that a pie represents a whole divided into parts, and the circular form carries an intuitive sense of completeness. This cultural ubiquity keeps pie charts in steady circulation, even among analysts who are aware of their shortcomings.
The central problem lies in how readers perceive the slices. Judging the relative size of circular sectors requires the eye to compare angles and arc lengths, a task the human visual system handles far less accurately than comparing lengths or positions along a common scale. When slices are similar in size, viewers struggle to rank them correctly, and small differences between neighbouring sectors become nearly impossible to detect. The difficulty compounds when labels and percentages are absent, leaving readers to estimate proportions from geometry alone. Studies of graphical perception have repeatedly shown that people systematically misjudge the areas and angles of pie slices, particularly when many categories are present or when slices are narrow.
Despite these cognitive hurdles, the pie chart persists because it communicates a specific message efficiently: that a set of categories composes a single whole. For simple datasets with two or three clearly distinct parts, the format can convey the overall structure at a glance. The convention is also deeply embedded in organizational and journalistic practice, so abandoning it carries communication costs of its own. Understanding both the enduring appeal and the perceptual limits of the pie chart provides a useful foundation for appreciating why alternative representations, including the waffle chart, have been developed to make part-to-whole comparisons easier to read.
Angle Reading
Pie charts and other radial graphics require readers to judge angular size, a fundamental constraint of human vision rather than a matter of education or familiarity. Even experts can be fooled by well-crafted radial displays. When two slices differ by only a few degrees, the difference is nearly imperceptible; even larger differences are systematically underestimated or overestimated depending on their orientation. This limitation means that a slice representing 23% and another representing 27% can appear identical, masking meaningful variation in the data.
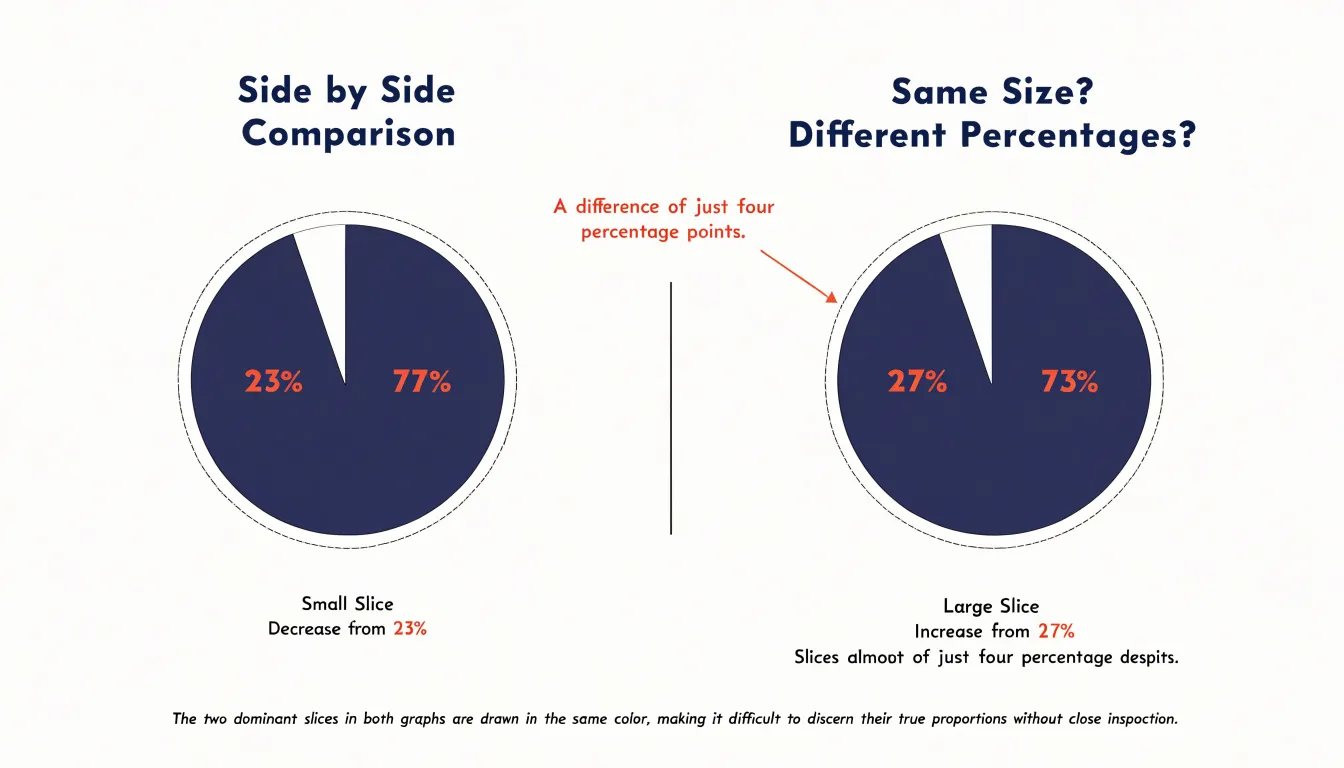
Similarly, arc length—the curved outer edge of each slice—is difficult to compare because the arcs are not aligned on a straight line and their curvature distorts perceived extent. The problem is compounded by surrounding context: a slice next to a large neighbor may seem smaller than it is, while the same slice next to a small neighbor may seem larger. These perceptual biases lead to common misinterpretations, such as overestimating the size of a slice that is oriented vertically or underestimating differences between adjacent slices.
In contrast, position along a common scale—as in a bar chart—allows for precise comparisons because the visual system can directly compare the lengths of aligned bars. For this reason, radial charts are best used for coarse comparisons or to show part-to-whole relationships when exact values are not critical. When precise discrimination is needed, alternative encodings that rely on position, length, or countable units are more effective.
Square Counting
When a reader looks at a waffle chart, they are not asked to judge the relative size of an irregular wedge or compare the lengths of distant bars. They are asked to count, and counting is one of the most basic and reliable visual operations available to the human mind. By dividing the whole into equal squares, the design turns an abstract percentage into a set of discrete, tangible objects.
Discrete visual units align closely with the way people naturally process quantities. Small children learn number concepts by handling countable objects, and adults retain a strong instinct for tallying distinct items. A filled square is either present or absent, which removes ambiguity. There is no need to estimate where a boundary falls or interpolate between tick marks. The reader can point to each square, run a finger along a row, and arrive at a confident figure. This process is quick and largely automatic, freeing mental resources for interpreting what the number means rather than working out what the number is.
Where estimating spatial slices demands cognitive effort, waffle charts convert area judgments into count judgments. The geometry of the grid does the work of measurement, and the viewer simply observes how many cells are filled. The result is faster comprehension, fewer reading errors, and a chart that remains legible even to audiences with limited data literacy.
Percentage Precision
In a standard 10 by 10 grid, the one-to-one mapping between cells and percentage points eliminates the need for estimation. When a category covers 37 cells, it represents exactly 37 percent. Readers can determine the exact figure by counting the filled cells or by recognizing the pattern, such as three full rows and seven additional cells. Even partial rows are easy to read because cells align in a consistent pattern.
This precision is particularly valuable when exact figures matter, such as in progress tracking or survey results. The chart communicates precise metrics without relying on data labels or legends, reducing visual clutter and cognitive load. Readers can compare categories by comparing cell counts, and the uniform cell size ensures that differences are proportional and accurately perceived. The discrete nature of the grid also avoids the ambiguity of continuous scales, where interpolation between tick marks can introduce error. By mapping each cell to a specific percentage point, waffle charts provide an unambiguous representation that supports quick, accurate reading in a compact format.
Small Percentages
Waffle charts offer a distinctive advantage when the data includes very small percentages. In many chart types, a category representing under five percent of a total can become difficult to render clearly. A pie chart may reduce that share to a thin sliver that is hard to see and even harder to label, while a bar chart can produce a bar so short that its magnitude is lost against the surrounding elements. Because the waffle chart’s basic unit is a single square of uniform size, a small percentage simply occupies a small number of full squares rather than a stretched or compressed shape.
This matters for readability. When a category accounts for four percent, it appears as four clearly defined cells in a one-hundred-cell grid. Each cell retains its full dimensions, which means the eye can locate and count the relevant squares without strain. There are no microscopic fragments to decipher and no ambiguity about where one category ends and another begins. The grid structure also provides natural boundaries between cells, so even adjacent small categories remain visually distinct.
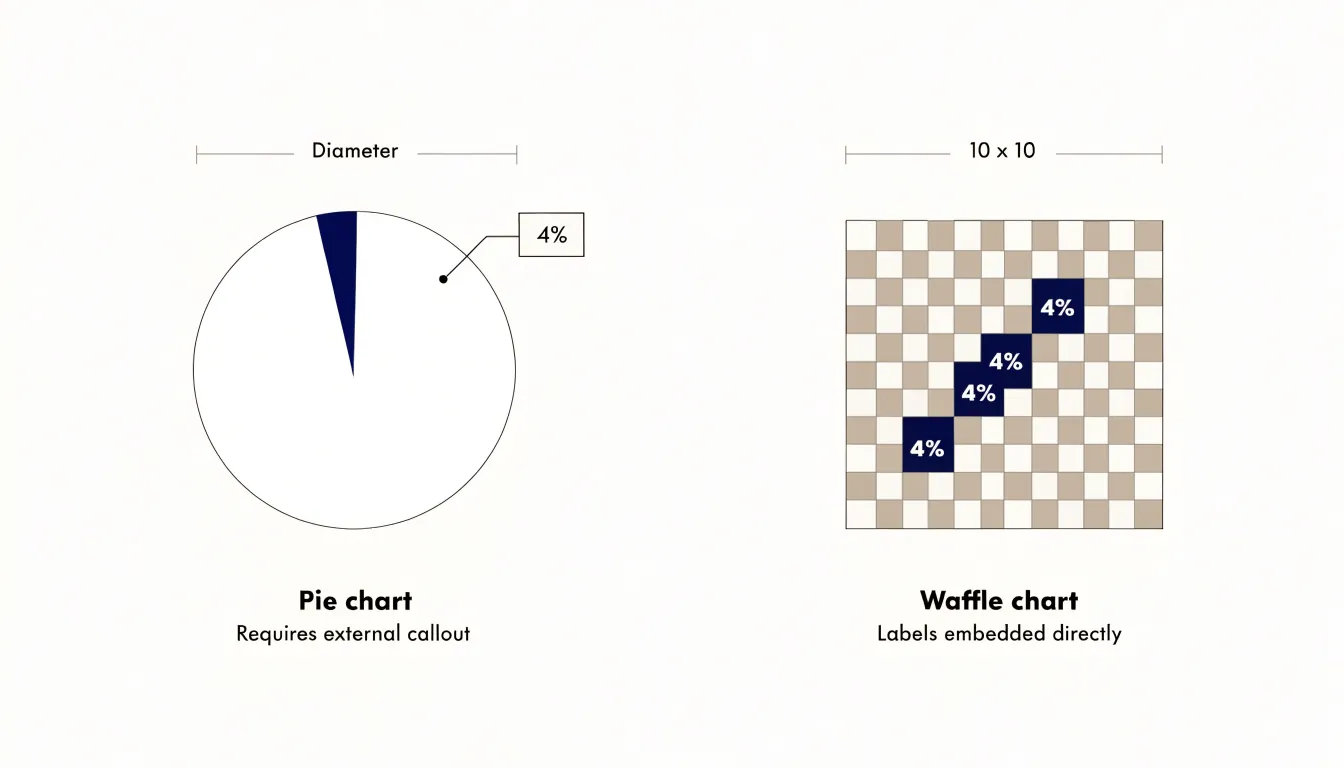
Labeling becomes more manageable as well. With a pie chart, tiny slices force designers to place callouts outside the chart, often with leader lines that cross other elements and create clutter. In a waffle chart, the small percentage occupies a compact cluster of cells that can be labeled directly or referenced through a simple legend. The uniform grid gives labels a predictable home, and the discrete cells make it obvious exactly which squares a label refers to. This combination of full-sized units, clear boundaries, and orderly labeling allows waffle charts to communicate minor proportions with precision and without overwhelming the viewer.
Grid Layout
Choosing the right number of squares for a waffle chart grid begins with the resolution of the data itself. While the standard 10x10 matrix is an intuitive default for whole percentages, datasets carrying finer distinctions benefit from a larger custom matrix, such as 20x10 or even a full thousand-cell grid. This allows each unit to represent a smaller share, preserving detail that a hundred-cell grid would round away.
Display constraints play an equally important role in the decision. Small canvases, mobile screens, and dashboard tiles often cannot accommodate a hundred legible squares without shrinking each cell to the point where gaps and borders blur together. In these situations, a 5x5 grid offers a compact twenty-five-cell alternative, trading granularity for clarity and ensuring that each square remains comfortably visible. The trade-off is that each cell now represents four percent, so values must be rounded, and the visual should be annotated to make the per-square value explicit.
Beyond resolution and space, the shape of the grid matters for perception. Square matrices like 10x10 or 5x5 support quick subitizing of rows and columns, while rectangular or irregular custom matrices can distort the impression of the whole. The chosen dimensions should divide evenly into meaningful units of the total, aligning with the rounding strategy and the accompanying labels. Testing a few candidate grids against the actual data values helps confirm that the final layout communicates the intended proportion accurately and remains readable at its display size.
Color Choices
Color choices in a waffle chart carry a significant share of the communication load, since each cell operates as a small unit of meaning within a larger grid. When selecting a palette across categories, the first practical consideration is contrast: adjacent categories should be distinguishable at a glance, even on small screens or when the chart is projected in a meeting room. Building the palette around luminance steps as well as hue differences keeps categories separable.
Equally important is restraint. Every additional hue introduces another signal for the eye to parse, and a waffle grid already presents many repeated marks. Limiting the palette to a handful of dominant colors, with a muted neutral for the largest or least interesting category, keeps attention on the comparison that matters. Sequential categories can often share a single hue at varying intensity, which reads more calmly than a rainbow of unrelated colors. Reserve the brightest or most saturated color for the category the reader should notice first.
Brand consistency adds another layer. Pulling primary and secondary colors from an existing brand palette anchors the chart in the surrounding visual identity, provided those colors survive contrast checks. Where a brand color is too pale or too similar to a neighbor, adjust its lightness rather than abandoning it entirely. Consistency in application also matters: the same category should use the same color across every waffle chart in a report, so readers can carry their understanding from one figure to the next without relearning the legend. A short internal palette guide, documenting which colors map to which categories, prevents drift as more charts are added.
Finally, label placement and cell borders interact with color. Thin borders in a background tone can separate cells without adding noise, and direct labels reduce reliance on a legend, which in turn lowers the contrast burden on the palette itself.
Use Cases
Waffle charts earn their place in the reporting toolkit when the primary communication goal is proportional clarity for an audience that needs to grasp a figure quickly and without friction. KPI tracking is a natural fit. When a dashboard reports that a division has reached 87 percent of its quarterly target, a grid of one hundred squares with eighty-seven filled conveys that achievement at a glance, letting an executive absorb the status before reading a single label. The same logic applies to survey responses, where a waffle chart can show how a sample splits across four or five answer categories while preserving the sense that each square represents a real respondent. Progress metrics benefit in similar fashion: onboarding completion, workforce certification rates, or budget utilization all become instantly legible when displayed as a partly filled grid.
These scenarios share a common structure. The data represents parts of a single whole, the categories are few, and the audience cares about the relative size of each part more than about precise numerical comparison across many groups. Executive audiences in particular respond well to the format because it requires no axis reading and no mental arithmetic.
Presentation contexts also favor the waffle chart. Slides shown in meetings, printed briefings, and summary panels on dashboards all reward graphics that communicate in a single visual beat. A waffle chart holds attention without demanding interpretation, and its compact grid fits comfortably alongside headline numbers and short commentary. When the message is a share of a whole and the reader needs to feel that share rather than study it, the waffle chart is a dependable and persuasive choice.
Multi-Slice Pie Charts
A pie chart works best when it carries a small number of slices, ideally three or four at most. Once a pie chart grows beyond that threshold, the visual experience shifts from quick comprehension to careful deciphering. When eight or ten slices crowd the circle, the smaller wedges become thin slivers that are nearly impossible to distinguish from one another, while mid-sized slices blur together into a ring of similar-looking segments.
The practical consequence of this clutter is a heavy dependence on the legend. With a clean three-slice chart, a reader can match colors to categories almost instantly. With a crowded pie, the reader must repeatedly glance back and forth between a long list of legend entries and the corresponding wedges, holding color-category pairings in working memory. This back-and-forth scanning slows comprehension and increases the chance that a reader misattributes a value to the wrong category, especially when the palette contains several similar hues.
Small slices also leave no room for direct labels inside the chart, pushing values and category names into the legend or around the perimeter with leader lines. The result is a busy graphic where the data-to-ink ratio suffers and the overall shape reads as a fragmented mosaic rather than a clear part-to-whole relationship.
For these reasons, multi-slice pie charts are a pattern worth avoiding. When a dataset naturally has many categories, other forms such as bar charts, sorted by value, allow readers to compare lengths accurately and label each item directly. Keeping pie charts to a handful of slices preserves their core strength: an immediate, intuitive sense of how a few parts compose a whole.
Creation Tools
Creating a waffle chart is straightforward with several popular options that cater to different skill sets and workflows:
- R (
ggplot2andwaffle): Theggplot2package offers a flexible foundation, while thewafflepackage provides a dedicated function to generate waffle charts with minimal code. Thewafflepackage allows you to specify the number of rows and columns, customize colors, and add labels for publication-ready graphics. - Python (
matplotlib,plotly, andpywaffle): Python users can leverage general libraries likematplotlibandplotly, or specialized packages likepywaffle, which handles the grid layout and proportion calculations. Withpywaffle, you can create a chart in just a few lines, adjusting parameters like the number of rows, colors, and icons. - Excel: For those who prefer a point-and-click interface, Excel offers a workaround using conditional formatting or stacked bar charts, though it requires some manual setup.
- Tableau: By creating a grid of squares and using calculated fields to fill them based on your data, you can build interactive waffle charts that update dynamically. Tableau’s drag-and-drop environment makes it accessible to users without programming experience, and the resulting charts can be easily shared or embedded in dashboards.
Side-by-Side Comparison
Small multiples turn a single waffle chart into a comparison instrument. The core technique is to hold the grid geometry constant: every panel uses the same 10 by 10 layout, the same cell size, and the same category order and colors, so that a viewer’s eye can travel from one chart to the next and register differences in fill patterns without relearning the visual grammar.
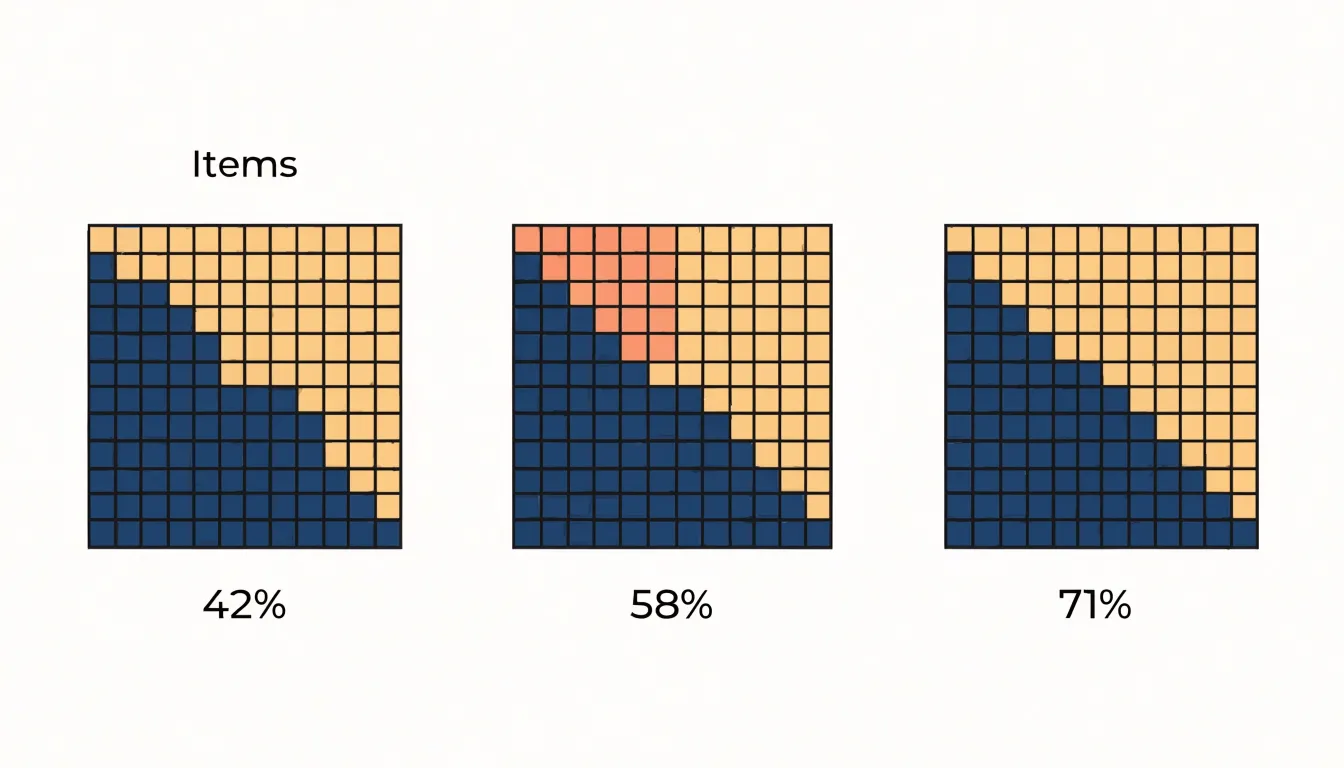
When comparing demographics, regions, or timeframes, lock the panel dimensions and spacing so that no chart appears larger or more important than another, and give each panel a clear label placed consistently, above or below the grid. Arrange panels in a single row for two or three datasets, and move to a row-by-column grid when there are more, keeping the reading order aligned with a meaningful sequence such as ascending population or chronological order. Shared legends should appear once, positioned where it serves all panels, and category colors must remain identical across charts; changing a hue between panels forces the viewer to consult the legend repeatedly. For timeframes, keep the ordering of panels chronological and consider adding a subtle baseline annotation showing the starting proportion, so drift across periods is legible at a glance.
White space between panels matters as much as within them; tight gaps merge the charts visually, while excessive gaps break the comparative rhythm. Where a single summary statistic helps, place a compact percentage label in each panel rather than relying on the reader to count shaded cells. Finally, test the arrangement at small screen sizes, since small multiples shrink quickly; a two-panel row often stacks vertically on mobile, preserving the fixed cell size and category colors so the comparison remains intact.
Accessibility
Roughly one in twelve men and one in two hundred women live with some form of color vision deficiency, and many more readers contend with low vision, aging eyes, or screens viewed in poor lighting. Because a waffle chart encodes values through small repeated cells, accessibility choices carry real weight.
Colorblind accessibility starts with palette selection. Red-green combinations, the most common deficiency, cause particular trouble, so palettes built on blue-orange or purple-yellow contrasts serve a wider audience. Varying lightness as well as hue gives each category a distinct luminance signature that survives desaturation. Tools that simulate deuteranopia, protanopia, and tritanopia let designers preview how a palette reads before publishing.
High-contrast standards provide a second layer of protection. Text labels, axis annotations, and gridlines should meet contrast ratios of at least 4.5:1 against their backgrounds, and cell boundaries need enough separation that adjacent categories remain distinguishable. Providing a dark mode or a high-contrast variant extends this further.
Screen reader compatibility involves embedding semantic structure. Each chart needs a concise alternative text summary describing the overall message, plus a data table in the markup so assistive technology can traverse individual values. ARIA roles and labels help screen readers announce the chart type and its key figures.
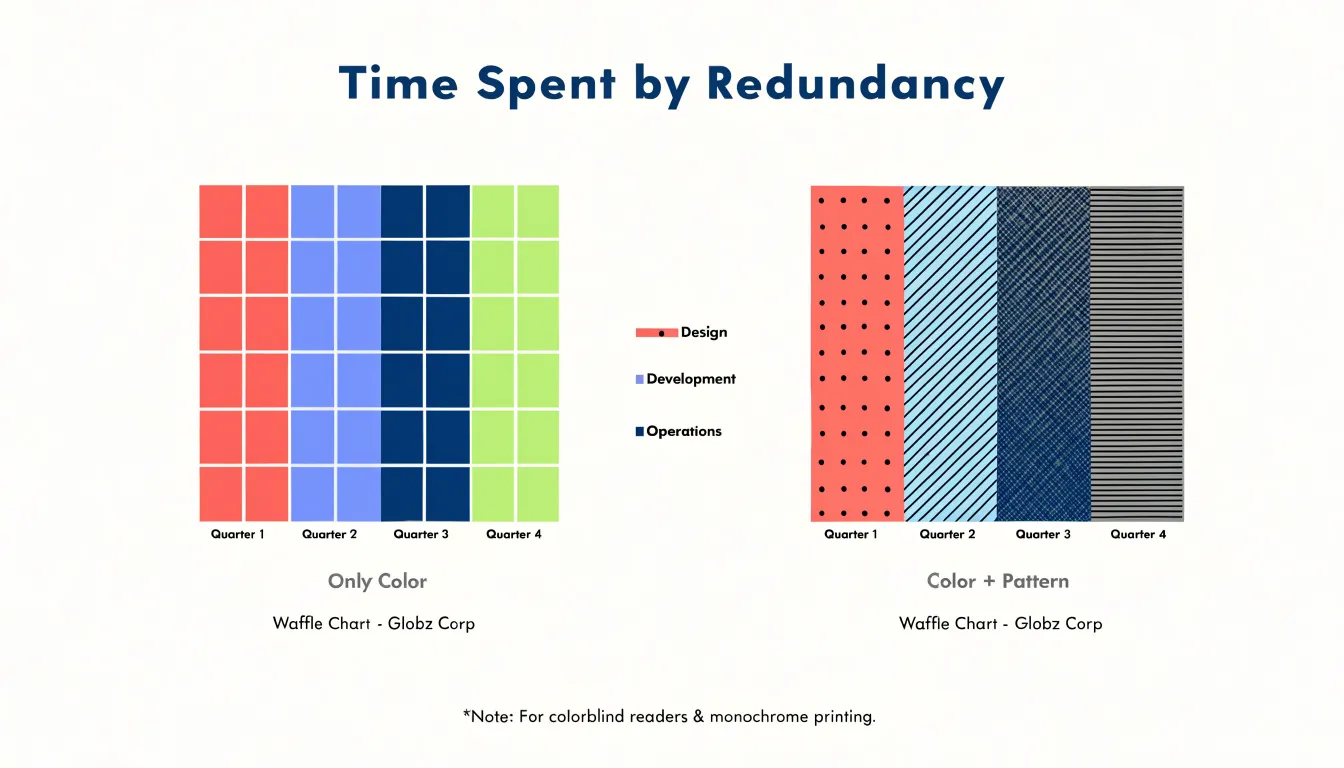
Alternative pattern fills offer a final safeguard. Assigning distinct textures, such as dots, stripes, or cross-hatching, to each category lets readers distinguish cells without relying on color at all. Combining pattern with color creates redundancy, so the chart works for colorblind readers, monochrome printing, and low-vision users simultaneously.
Common Mistakes
Waffle charts appear deceptively simple, and that simplicity is precisely where many designers go wrong:
- Overcomplicating the grid icons: The grid invites decoration, tempting designers to turn each cell into a miniature illustration, a tiny person, a detailed product silhouette, or a pictogram packed with internal lines. At small sizes these icons turn into visual noise, and readers spend their attention decoding symbols instead of comparing proportions. A clean, uniform mark such as a simple square or circle keeps the focus on the pattern of filled versus empty cells.
- Mismatched scale ratios: The value each cell represents must stay constant across every category and every panel in the chart. Designers sometimes resize one group’s cells, split a square into halves, or adjust the grid dimensions for one series to make the numbers fit neatly. These changes break the shared visual grammar of the chart: a filled cell no longer means the same quantity everywhere, making side-by-side comparisons misleading. Choosing a common denominator that works for the largest value and letting smaller categories show partially filled rows preserves honest comparison.
- Overcrowding category colors: Once the number of categories in a single matrix climbs past roughly four or five, adjacent hues become hard to distinguish and the fill patterns blur together. Readers struggle to map colors back to a legend, especially for small segments representing minor categories. Grouping rare categories into an “other” bucket, or splitting one crowded matrix into several small multiples, keeps each grid readable and each color meaningful.
Dashboard Overview
Executive dashboards often accumulate dozens of visual elements over time, and multi-slice pie charts are among the most common contributors to that clutter. When a dashboard stacks four or five such charts side by side, the effect is a wall of overlapping angles and colors that slows comprehension and makes the reporting surface feel heavier than it needs to. Waffle charts offer a practical remedy by converting each proportion into a tidy, countable grid.
Within an executive reporting context, this simplicity pays off in several ways. Leaders scanning a dashboard under time pressure can absorb several waffle charts at once without pausing to match legend colors to slices. Because every chart in the grid shares the same square-based structure, the eye moves easily between panels and comparisons feel natural. Designers also gain flexibility: adjacent squares can be grouped into blocks to show subcategories, and unused squares preserve a consistent visual footprint across panels of different sizes. The uniform geometry brings a calm, orderly rhythm to the layout, reducing the visual noise that accumulates when mixed chart types compete for attention.
The aesthetic benefit complements the functional one. Clean grids with restrained color palettes and generous white space produce dashboards that look deliberate rather than crowded. Fewer decorative elements mean the data itself becomes the focal point, and the overall composition holds together as a coherent reporting surface that executives can trust at a glance.
Frequently Asked Questions
What is a waffle chart and how does a 10 by 10 grid work?
A waffle chart is a square grid where each cell represents a fixed fraction of the total; in a 10 by 10 grid, the 100 cells mean each square is one percentage point. The full square represents the complete total, so filling 60 squares shows 60 percent.
Why are waffle charts easier to read than pie charts?
Waffle charts turn area judgments into count judgments using equal squares, while pie charts require judging angles and arc lengths, which people handle less accurately. Counting filled squares is quick and largely automatic, so readers can determine values with less cognitive effort.
How do waffle charts show very small percentages?
In a one-hundred-cell grid, a small percentage appears as a small number of full squares, such as four clearly defined cells for four percent. Each cell keeps its full dimensions and the grid provides boundaries, so small categories remain visible and easier to label.
How do I choose the right grid size for a waffle chart?
The standard 10 by 10 grid is an intuitive default for whole percentages, while finer data can use a larger matrix such as 20 by 10 or even a thousand-cell grid. On small canvases or mobile screens, a 5 by 5 grid can trade granularity for clarity, but each cell then represents four percent and the chart should be annotated to make the per-square value explicit.
What are common mistakes to avoid when making a waffle chart?
Avoid overcomplicating cells with detailed icons, mismatching scale ratios by resizing cells or changing grid dimensions, and overcrowding category colors beyond roughly four or five. Keeping each cell’s value constant and using a clean, uniform mark helps preserve honest comparison.
How can I make a waffle chart accessible for colorblind or low-vision readers?
Use palettes built on blue-orange or purple-yellow contrasts and vary lightness as well as hue, since red-green combinations cause particular trouble. Text labels and gridlines should meet contrast ratios of at least 4.5:1, and charts should include alternative text, a data table, and distinct pattern fills as a safeguard.
Tony Astor
Tony writes about data visualization and the tools people use to build charts and dashboards. More about Data Illustrator