Voronoi Diagram: What It Is and How It's Used
 By Tony Astor ·

Voronoi Diagram
A Voronoi diagram partitions a plane into convex polygonal cells, one per seed point, where every location in a cell is closer to that cell’s seed than to any other. Cell boundaries are perpendicular bisectors between neighboring seeds, and vertices are equidistant from three or more seeds.
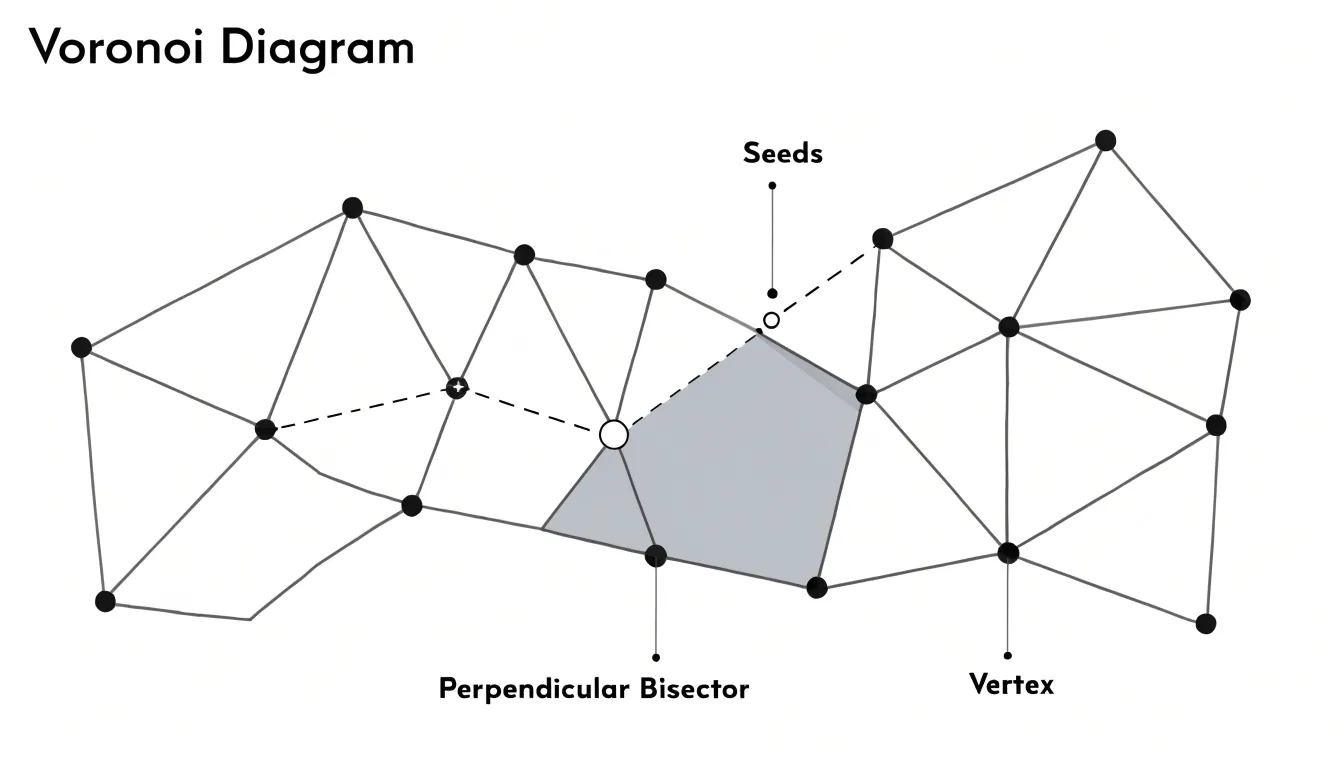
Table of Contents
Voronoi Diagram
At the heart of every Voronoi diagram lies a simple rule: each point in space belongs to the seed point that is closest to it. This nearest-neighbor assignment partitions a plane into convex polygonal regions, or cells, with one cell for each seed.
The boundary between any two adjacent cells is the perpendicular bisector of the line segment connecting their seeds. Because every point on that bisector is equidistant from both seeds, points on one side are closer to the first seed, while points on the other side are closer to the second. When multiple seeds are present, a seed’s cell is formed by the intersection of half-planes defined by the perpendicular bisectors shared with all competing seeds. This intersection yields a convex polygon, which remains unbounded if the seed lies on the outer convex hull of the seed set.
The edges of the diagram are the segments of perpendicular bisectors lying between vertices. The vertices are the points where three or more cells meet, sitting at an equal distance from the corresponding seeds. Geometrically, each vertex is the center of a circle that passes through three or more seeds while containing no other seeds in its interior. The resulting structure is a planar graph that captures all proximity relationships among the seeds, providing an efficient model for spatial partitioning and nearest-neighbor queries.
Natural Examples
Voronoi patterns emerge spontaneously in the natural world wherever cells or structures grow outward simultaneously from scattered starting points and compete for limited space. Each center claims the closest territory, and polygonal boundaries form where expanding regions meet:
- Giraffe coats: Each patch of darker hair begins as a center of pigment-producing cells. As these centers expand during development, the boundaries between adjacent patches settle into straight or gently curved edges, creating a mosaic of irregular polygons.
- Dragonfly wings: The wing membrane is divided into small compartments by veins that form as cells organize and expand from local centers. Where expanding regions meet, the vein walls lock into polygonal shapes. Constructing and maintaining this network around evenly spaced centers requires minimal material and energy.
- Foam bubbles: When bubbles pack together, surface tension pulls their films into flat walls that meet at three-way junctions. While soap films add the extra physical constraint of equal angles, the overall arrangement of cells around nucleation points is distinctly Voronoi-like.
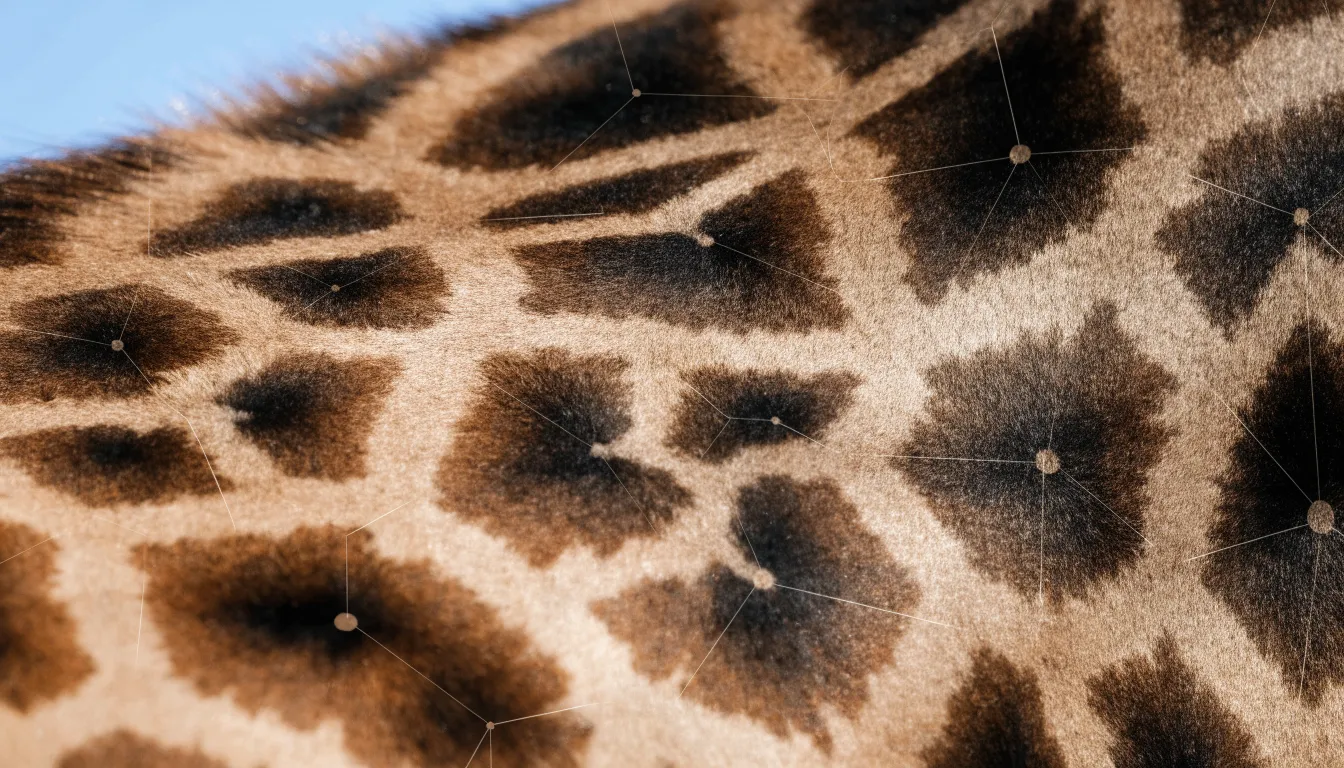
Across both microscopic and macroscopic scales, when multiple centers expand at once, partitioning space into convex polygons around the nearest center is the most efficient physical outcome.
City Planning
Urban planners use Voronoi partitioning to locate emergency services so that every neighborhood receives help as quickly as possible. By treating each fire station, hospital, or police precinct as a seed point, planners divide the city into response zones assigned to the closest available facility.
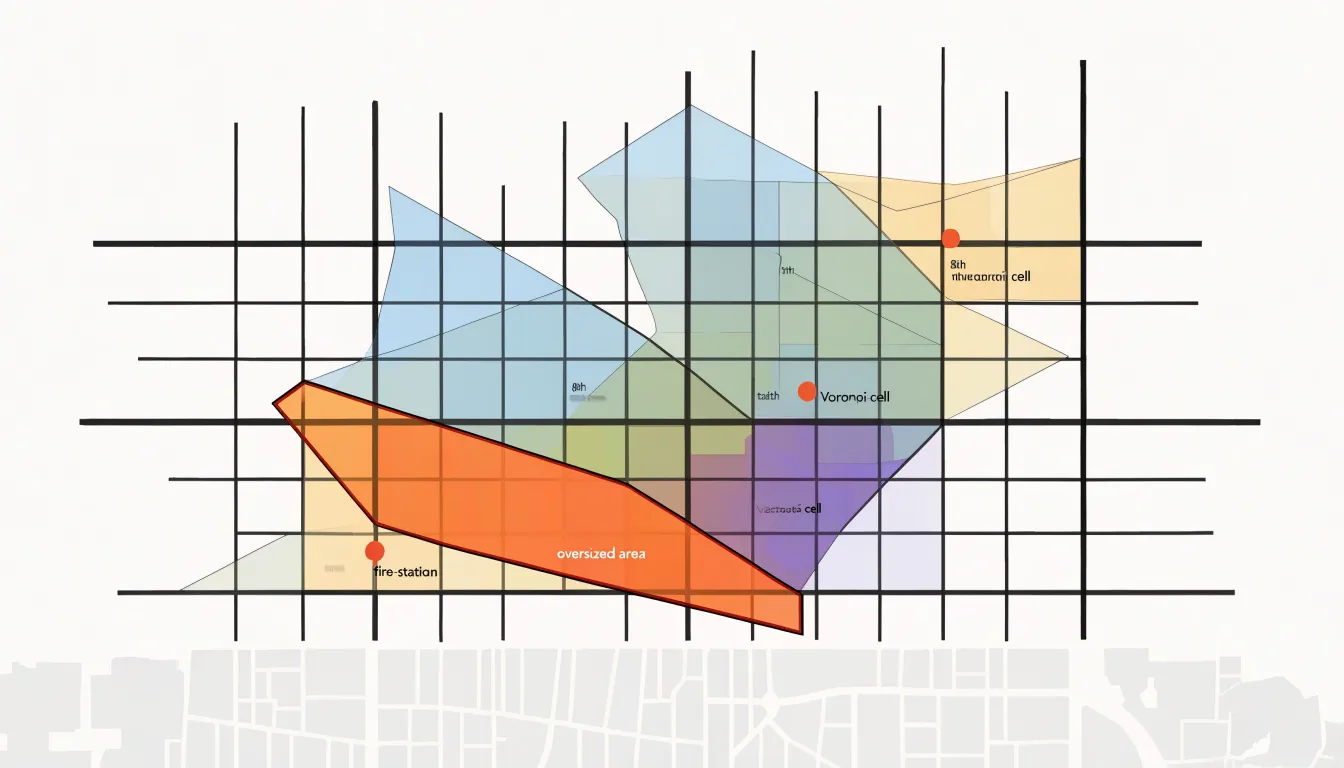
For fire stations, planners overlay Voronoi cells onto the street network to estimate travel times. If a cell is excessively large or elongated, outlying areas face long dispatch times, signaling that a new or relocated station may be warranted. Hospitals work similarly: each residential district falls within the catchment area of its nearest emergency department, and the size and population of each cell reveal potential capacity gaps. Police commanders use the same partitions to balance patrol coverage across districts and identify neighborhoods sitting at the edges of multiple jurisdictions.
The method becomes more precise when combined with demographic and traffic data:
- Weighted seeds: Weighting seed points by population density or historical call volume produces zones that reflect actual demand rather than simple geographic proximity.
- Network adjustments: Adding road networks and rush-hour patterns refines estimates, since straight-line distance is only a rough proxy for real travel time.
- Simulations: Planners can simulate adding or removing a facility and observe how the boundaries shift, making the consequences of each infrastructure decision visible before construction begins.
Business Locations
Retail chains rely on Voronoi diagrams to model customer proximity and decide where to open new stores. Treating existing or candidate store sites as seed points divides the surrounding region into cells that approximate each location’s trade area, showing which neighborhoods and customer clusters naturally fall under its influence.
By overlaying population density, household income, foot traffic, and driving time onto these cells, analysts estimate how many potential customers each store can serve. When planners add candidate locations as new seeds, the diagram redraws itself to reveal how neighboring trade areas would shift. This directly addresses the risk of market cannibalization: if a proposed store’s cell overlaps heavily with an existing location’s cell, the two branches would compete for the same shoppers. Planners can then adjust the candidate site, compare alternatives, or conclude that the market is already covered.
Beyond site selection, retail teams use these catchment areas to plan delivery zones, allocate local marketing budgets, and set staffing levels according to the expected customer base.
Video Games
Video game developers use Voronoi diagrams to procedurally generate believable digital worlds at scale, avoiding the time cost of hand-sculpting vast environments.
- Terrain generation: By scattering seed points across a virtual landscape and assigning attributes like elevation, moisture, or rock density to each resulting cell, studios generate rolling hills, mountain ranges, and coastlines. A variation called Voronoi noise randomizes cell boundaries and blends adjacent regions, giving developers fine control over surface roughness to imitate anything from craggy cliffs to gentle dunes.
- Biome boundaries: Placing seed points for forests, deserts, and tundras lets the Voronoi cells define where one environment transitions into another. Adjusting point density and distribution yields irregular, convincing borders rather than sterile grid patterns. In dynamic maps, territory ownership or influence can be recalculated in real time as the game state changes.
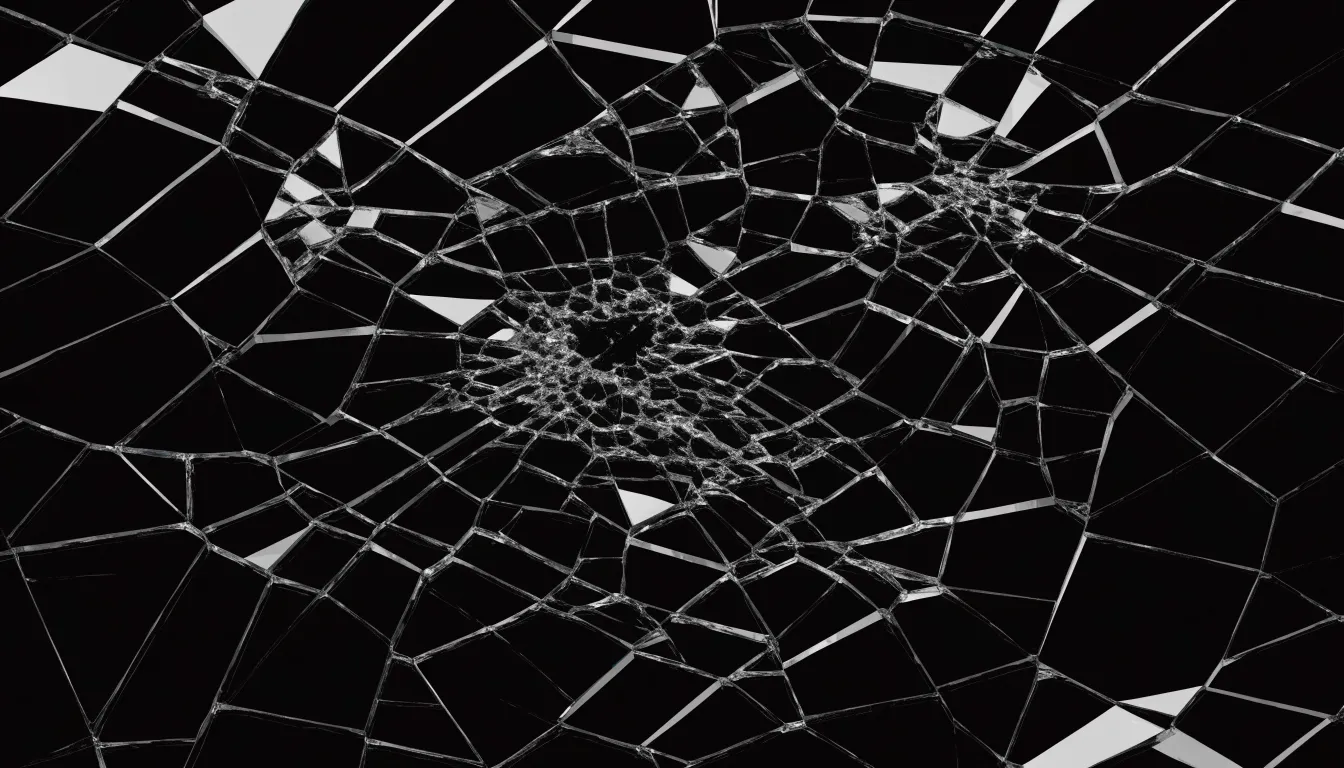
- Shatter effects: When an object breaks, developers compute a 2D or 3D Voronoi decomposition of its surface or volume, treating cell edges as fracture lines. Applied to destruction physics for glass, stone, and armor, this produces varied fragments that look like genuine debris while preserving the original object’s total mass.
Plant Biology
Living plants distribute resources across limited space through local rules of growth and competition that mirror Voronoi geometry.
In outward growth, the arrangement of leaves along a stem—known as phyllotaxis—rotates each new leaf by roughly 137.5 degrees (derived from the golden angle) from the previous one. This ensures leaves fan out around the stem rather than clustering directly above one another, allowing each leaf to capture sunlight while casting minimal shadow on its neighbors.
Internally, plant tissues pack cells together in dense, space-filling arrangements that resemble Voronoi partitions. In a leaf’s interior, epidermal cells, stomata, and photosynthetic mesophyll cells occupy distinct regions with no wasted gaps. Each cell sits close to its neighbors while maintaining proximity to the vascular network that supplies water and carries away sugars. This tight polygonal packing shortens the distance nutrients must travel between cells, accelerating material transfer throughout the tissue.
Wildlife Habitats
Ecologists use Voronoi diagrams as a low-cost tool to map animal territories, supplementing or reducing the need for expensive telemetry. By treating focal locations—such as cliff-nesting raptor sites, mammal burrows, or frequently visited movement hubs identified via GPS collars and camera traps—as generator points, researchers partition the landscape into geometric approximations of individual or group territories.
Linking these cells to environmental features reveals how resource availability shapes spatial behavior. Where food or water is clustered, territories tend to be smaller and tightly packed; in resource-poor regions, cells expand to cover larger areas. Overlaying vegetation density or prey distribution maps onto the tessellation helps ecologists test whether territory boundaries align with natural resource gradients or reflect purely social constraints.
Recalculating the diagram over time also tracks territorial dynamics. As animals shift their activity centers due to seasonal changes, disturbances, or social interactions, shifting cell boundaries highlight competition, displacement, or adaptation to fluctuating resources.
Weather Tracking
Because rain gauges are scattered unevenly across the landscape, meteorologists use a form of Voronoi diagram called Thiessen polygons to convert point measurements into representative regional rainfall averages. Treating each rain gauge as a seed point partitions the region into polygons defining each station’s area of influence.
To calculate a regional average, the rainfall recorded at each gauge is weighted by the area of its Thiessen polygon, ensuring that stations representing larger areas contribute proportionally more to the estimate. The weighted average is computed as the sum of each gauge’s rainfall multiplied by its polygon area, divided by the total area of all polygons.
Thiessen polygons are especially useful in regions with sparse or irregularly spaced networks, such as mountainous or remote terrain. While they also serve as a foundation for more advanced spatial interpolation methods, their simplicity makes them an operational staple for hydrologists and meteorologists assessing water resources, monitoring droughts, and issuing flood warnings.
Smart Navigation
When a mapping application searches for the nearest gas station or coffee shop, it combines satellite positioning with Voronoi-based spatial indexing.
First, the phone’s GPS receiver calculates latitude and longitude by timing satellite signals, achieving accuracy within a few meters in open conditions. Assisted GPS supplements this with cell tower and Wi-Fi data to speed up the initial fix and maintain accuracy in dense urban areas where buildings obstruct satellite signals. Once the user’s coordinates are set, the app queries its database of points of interest (POIs), which stores businesses and landmarks as coordinate pairs with attributes like category, opening hours, and ratings.
Measuring the straight-line distance from the user to millions of database entries would be computationally wasteful. Instead, the system uses expanding proximity boundaries. It first checks a small bounding box or radius around the user; if matching candidates are found, they are ranked by distance. If the region is empty, the search radius expands in stages.
Voronoi geometry underpins this search structure. Each POI acts as the seed of a cell containing all locations closer to it than to any other POI of the same type, and the cell edges mark where the nearest facility changes. Mapping services encode these partitions into spatial indexes—and routing systems use them along travel corridors—to return ranked lists of nearby options almost instantly.
Creative Arts
Designers, architects, and artists use Voronoi algorithms to generate organic complexity from simple mathematical rules:
- Graphic design and motion graphics: Creative coding libraries let artists scatter seed points across a canvas and render the cells as fills, outlines, or shaded regions. The output resembles cracked earth, cellular tissue, or stained glass, providing textures for posters, album covers, and digital illustrations that would be difficult to draw by hand. In motion graphics, animators tune seed positions dynamically so cells shift and subdivide in response to music or user input.
- Architecture: Voronoi-inspired facade panels break up large flat surfaces into irregular polygons that catch light differently throughout the day. Used in window mullions or shading screens, varying cell sizes controls transparency and solar gain while echoing biological structures like bone and leaf veins.
- Product design: Perforated lamp shades cast intricate Voronoi shadows, while chair frames, footwear, consumer electronics, and drone bodies use the geometry for an engineered, lightweight structure. Because Voronoi tessellations translate directly into printable meshes, these forms are frequently manufactured via 3D printing.
Hand Drawing
You can construct a Voronoi diagram by hand using a sheet of paper, a sharp pencil, a ruler, and a set square, protractor, or compass.
- Plot the seeds: Scatter six to ten seed points across the page, spaced so each has several neighbors. Mark and label each point clearly for reference.
- Find the first midpoint: Choose any two neighboring seeds, lay your ruler between them, and mark the exact midpoint of the invisible segment joining the pair.
- Draw the perpendicular bisector: Through that midpoint, use a set square or protractor to draw a straight line at a 90-degree angle to the segment between the seeds. This line is the shared boundary between the two cells.
- Repeat and trim: Draw perpendicular bisectors for every neighboring pair of seeds. As lines cross one another, those intersections mark where a boundary switches from separating one pair of seeds to separating another. Trim each bisector at the crossings so only the inner boundary segments remain.
- Finalize the cells: Once all neighboring pairs are connected and trimmed, erase the construction marks and darken the final polygon edges. Verify your accuracy by picking a test point inside each cell and measuring to confirm it is closer to that cell’s seed than to any other.
Software Solutions
For large datasets and complex modeling, specialized software automates Voronoi computation and rendering:
- Python (SciPy, NumPy, Matplotlib): The
Voronoiclass in SciPy’sspatialmodule accepts an array of coordinates and returns the ridge vertices, regions, and point relationships. It pairs with NumPy for array handling, Matplotlib for plotting, pandas for data tabulation, and Shapely for clipping and measuring cells, allowing researchers to run an entire workflow inside a single script. - QGIS: This desktop geographic information system includes a built-in Voronoi polygon tool. Cartographers and planners load point layers, set a buffer percentage to extend the diagram beyond the outermost points, and generate vector layers that can be styled, queried, and combined with roads, boundaries, and land-use data without writing code. The algorithm is also accessible via the processing toolbox for batch runs and Python scripting.
- Blender: For 3D modeling, Blender provides a procedural Voronoi texture within its shader nodes, while its geometry nodes and Cell Fracture add-on decompose 3D meshes into Voronoi fragments for procedural materials, architectural forms, and shattered-object simulations.
Delaunay Triangulation
The Delaunay triangulation is the mathematical dual of the Voronoi diagram, offering a complementary view of the same spatial structure. While the Voronoi diagram partitions space into regions around seeds, the Delaunay triangulation connects pairs of seed points whose Voronoi cells share an edge.
Drawing a straight line between the seeds of every pair of adjacent Voronoi cells produces a seamless mesh of triangles that fills the convex hull of the point set without gaps or overlaps. Because the two structures are dual, each Voronoi cell corresponds to a Delaunay vertex (its seed), and each Voronoi edge corresponds to a Delaunay edge rotated by 90 degrees.
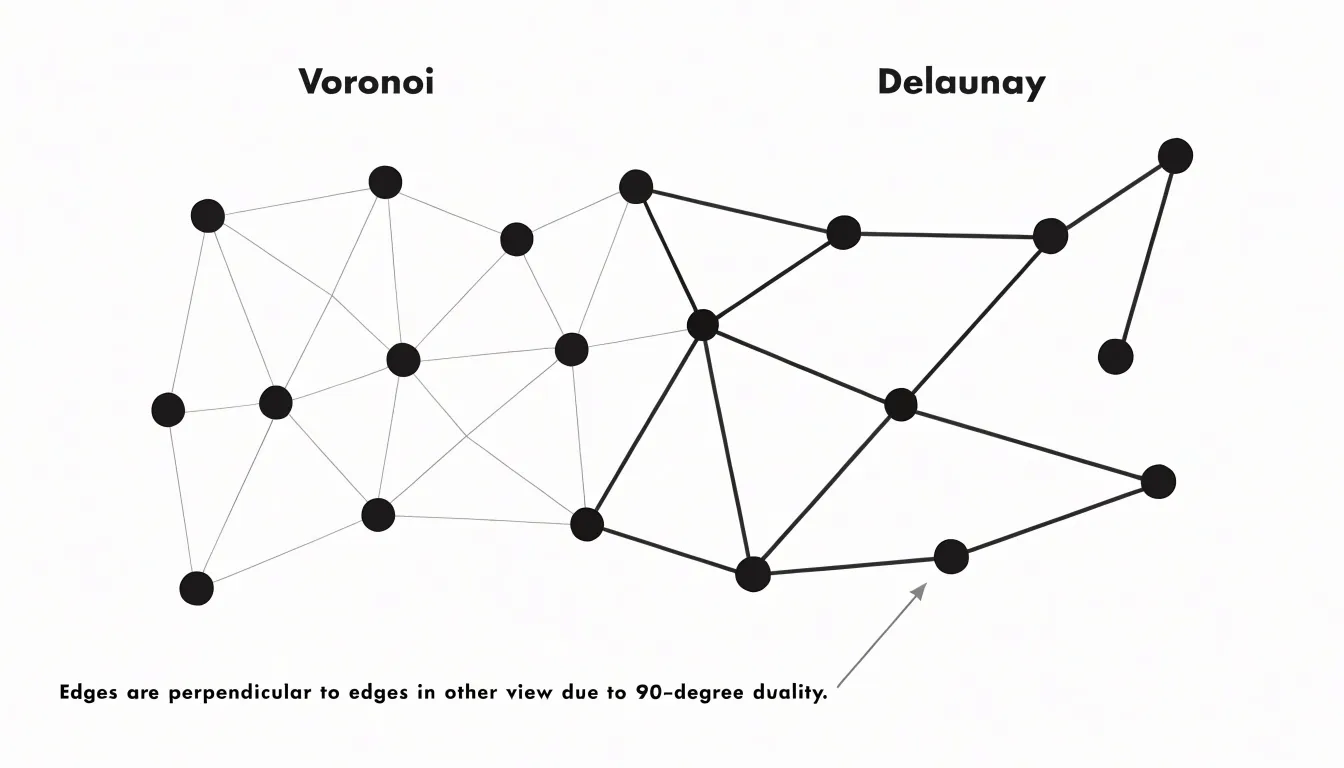
A key geometric property of the Delaunay triangulation is that it maximizes the minimum angle across all triangles in the mesh, avoiding long, skinny triangles whenever possible. This regularity makes it essential in terrain modeling, computer graphics, and finite element analysis, where well-shaped triangles are required for smooth rendering and accurate physical simulations. Together, the two structures capture both regional boundaries (Voronoi) and neighbor-to-neighbor connectivity (Delaunay).
Summary View
By assigning every location to its nearest seed point, the Voronoi diagram translates a simple distance rule into a versatile framework for dividing space. Across biology and physics, it explains the space-filling efficiency of honeycombs, dragonfly wings, plant tissues, and animal territories. In engineering and spatial analysis, it powers rainfall estimation, emergency dispatch planning, retail trade-area modeling, nearest-neighbor navigation, wireless cell tower placement, and robotic path planning. And in digital media and architecture, it provides an algorithmic foundation for procedural game worlds, structural facades, and generative art. Whether computed in scientific software or observed in natural growth, Voronoi partitioning remains one of the most direct bridges between abstract geometry and real-world spatial problems.
Frequently Asked Questions
What is a Voronoi diagram?
A Voronoi diagram partitions a plane into convex polygonal cells, with one cell for each seed point, so that every point in a cell is closer to that cell’s seed than to any other seed. The boundary between adjacent cells is the perpendicular bisector of the line segment connecting their seeds.
How do giraffe coats show Voronoi-like patterns?
Each patch of darker hair begins as a center of pigment-producing cells, and as these centers expand during development, the boundaries between adjacent patches settle into straight or gently curved edges. This creates a mosaic of irregular polygons.
How do city planners use Voronoi diagrams for emergency services?
Planners treat each fire station, hospital, or police precinct as a seed point and divide the city into response zones assigned to the closest available facility. For fire stations, they overlay Voronoi cells onto the street network to estimate travel times and identify outlying areas that may need a new or relocated station.
How can Voronoi diagrams help retailers avoid market cannibalization?
If a proposed store’s Voronoi cell overlaps heavily with an existing location’s cell, the two branches would compete for the same shoppers. Planners can then adjust the candidate site, compare alternatives, or conclude that the market is already covered.
How do ecologists use Voronoi diagrams to map wildlife territories?
Ecologists treat focal locations such as cliff-nesting raptor sites, mammal burrows, or frequently visited movement hubs as generator points to partition the landscape into geometric approximations of territories. Where food or water is clustered, territories tend to be smaller and tightly packed, while in resource-poor regions cells expand to cover larger areas.
What are Thiessen polygons and how are they used in rainfall estimation?
Thiessen polygons are a form of Voronoi diagram used in weather tracking, with each rain gauge treated as a seed point to define that station’s area of influence. To calculate a regional average, each gauge’s rainfall is weighted by the area of its Thiessen polygon.
Tony Astor
Tony writes about data visualization and the tools people use to build charts and dashboards. More about Data Illustrator