Visme vs Venngage for Charts and Infographics
 By Tony Astor ·

Visme vs Venngage for Charts and Infographics
Visme is better for complex, interactive charts, multi-axis graphs, live Google Sheets/API data links, and deep design control, while Venngage is better for beginners and high-volume teams needing fast, simple charts and polished industry-specific infographic templates. Both offer free trials, so testing each with your own dataset is the fastest way to choose.
Table of Contents
Chart Type
Both Visme and Venngage offer a solid foundation of standard chart types for everyday reporting, including basic bar charts, pie charts, and line graphs. Each tool provides an intuitive interface where you input data manually or paste it from a spreadsheet, and the chart updates in real time. For simple comparisons like monthly sales figures or survey results, both handle the essentials without requiring design expertise.
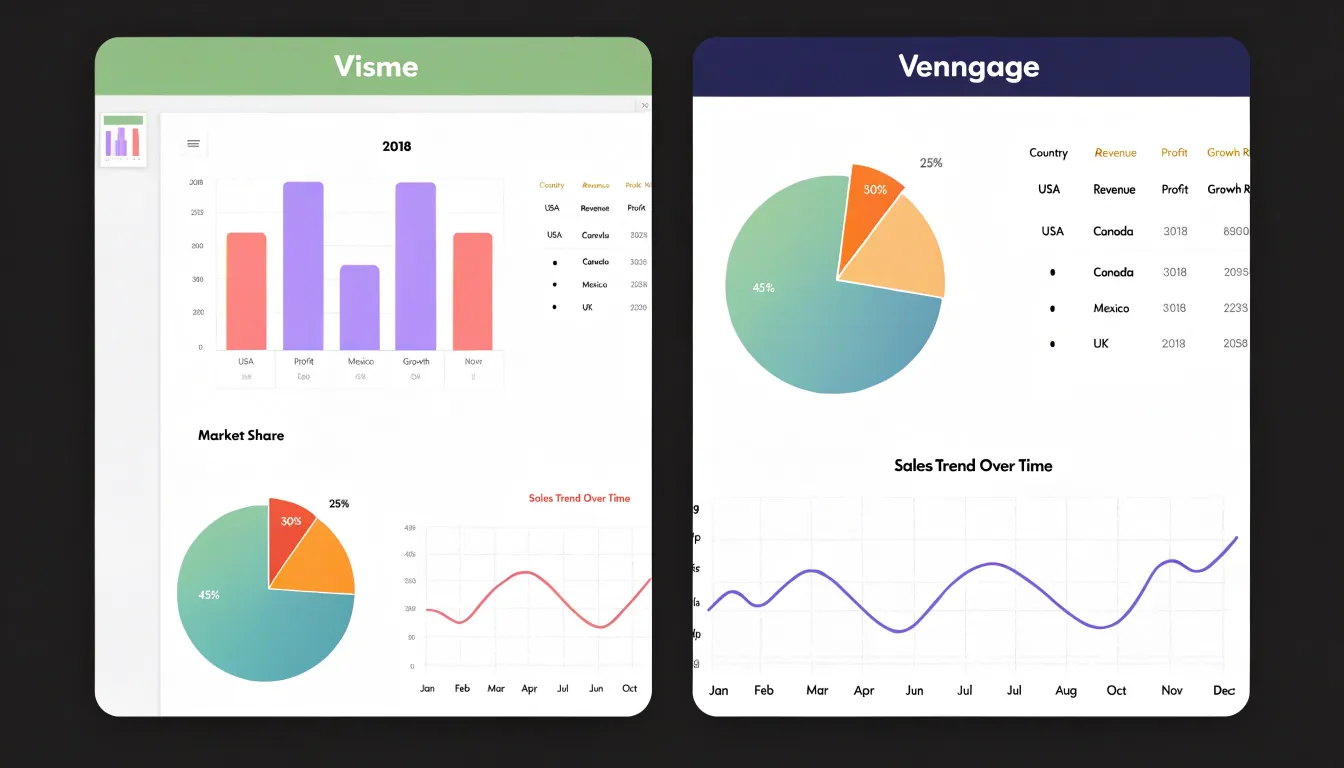
Standard customization covers the primary needs for internal reports, presentations, and infographics:
- Bar charts: Vertical and horizontal orientations, with customizable colors, labels, and gridlines.
- Pie charts: Adjustable slice colors, percentage labels, and exploded segments for emphasis.
- Line graphs: Multiple data series, smooth or straight lines, and adjustable axis scales.
Beyond the basics, both tools offer area charts, donut charts, and scatter plots, though customization depth varies. Visme provides a slightly broader library, including radar, bubble, and hierarchy charts for specialized data. Venngage focuses on simplicity, making it faster to create clean, professional-looking charts without tweaking many settings.
In both platforms, standard charts are responsive, support animation for presentations, and integrate seamlessly with icons and text blocks. The choice for basic charts comes down to Visme’s variety versus Venngage’s streamlined simplicity.
Chart Type
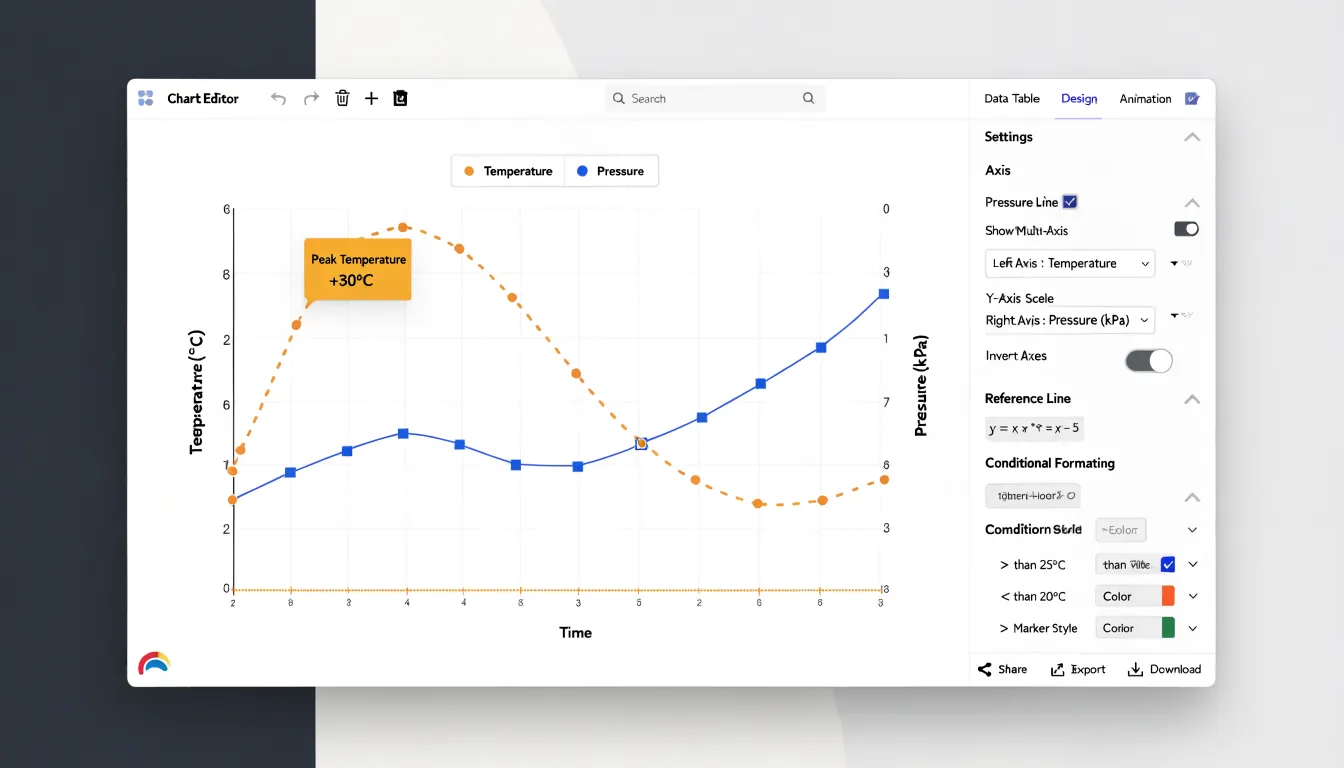
Chart selection becomes decisive when your dataset demands more than a standard bar or line graph. Visme’s editor exposes advanced controls for multi-axis graphs, allowing you to plot two or more data series against separate vertical scales within a single chart. This capability matters for technical datasets where units of measurement differ, such as temperature and pressure readings tracked side by side. Visme also supports custom data thresholds, letting you set reference lines or conditional formatting that highlight values crossing defined limits—useful for monitoring tolerances or performance benchmarks in engineering and research presentations.
Venngage’s chart widget emphasizes accessibility and speed. For intricate multi-axis graphs, it offers a more constrained set of options, steering users toward simpler visualizations that remain readable on mobile and in print. You can represent custom data thresholds through manual annotation and color coding without deep menu navigation. Venngage provides granular formatting for technical datasets—including precise axis intervals, decimal places, and custom tick marks—but with fewer layers of control than Visme.
Visme suits analysts who need to fine-tune every axis, label, and gridline for dense technical data, trading a steeper learning curve for depth. Venngage favors teams producing infographics at volume, where consistent styling and quick assembly outweigh exhaustive formatting controls.
Chart Type
When deadlines loom, producing a clear bar or line graph in under five minutes is critical. Visme provides a dedicated charts and graphs section with pre-styled templates. Its drag-and-drop interface adjusts colors, labels, and legends quickly without deep menu navigation. For urgent presentations, Visme’s pre-designed themes and broader design system keep slides cohesive, reducing manual formatting.
Venngage similarly supports rapid graph generation for infographic-friendly visuals, allowing direct data entry or CSV uploads. However, Venngage’s customization options can require more steps to achieve a polished look, particularly when matching brand colors or adjusting axis labels, and built-in templates may need extra time to align with specific presentation themes.
While both platforms can produce a basic graph within five minutes, Visme streamlines the workflow for cohesive slide decks, whereas Venngage excels at eye-catching standalone infographics despite a few extra formatting steps.
Chart Type
How a design platform handles live data connections determines how much time a team spends rebuilding charts. Both Visme and Venngage accept CSV and Excel uploads, mapping columns to data series through a table interface that mirrors the chart on the canvas.
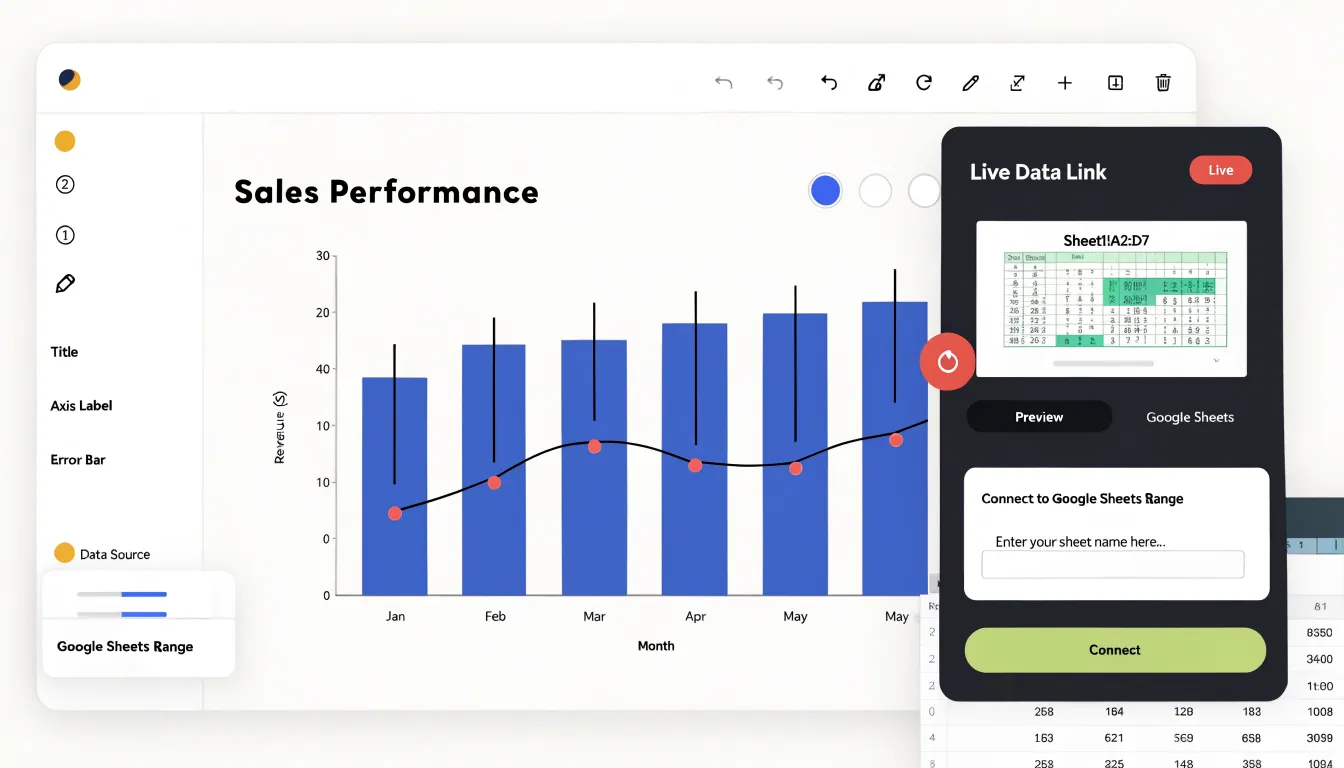
For dynamic updates, Visme integrates with Google Sheets, allowing users to link a chart to a specific sheet range and refresh data on demand without redrawing the visual. This suits recurring reports like weekly dashboards or sales summaries. Visme also supports live API endpoints, letting teams pull from services that expose JSON feeds to keep visualizations current.
Venngage offers a comparable manual refresh process via Google Sheets on higher-tier plans. Its API connectivity is more limited, which matters for teams that want charts to update automatically from a database or product feed. Both platforms handle uploaded data well for static infographics, but Visme’s deeper live linking is better suited for frequently updated charts.
Chart Type
For static, single-page infographics, layout tools determine how quickly you can move from a rough concept to a print-ready design. Visme offers a robust grid system that lets you define columns and gutters before placing elements, supporting traditional top-to-bottom or multi-column reading orders. Its alignment and distribution tools snap objects to guides, center them relative to the page or other elements, and maintain consistent spacing across repeated shapes. When you drop a chart onto the canvas and resize it within the grid, surrounding text blocks and icons respect the same alignment rules.
Venngage emphasizes smart guides and pre-built infographic blocks. Its alignment tools show real-time distance measurements and centering hints as you drag elements, speeding up assembly when building from section templates.
Both platforms support custom page dimensions and include large libraries of icons, illustrations, and shapes. Visme’s asset search and color-theming options help keep large sets of visuals consistent, while Venngage organizes its collections around specific infographic use cases like timelines, process flows, and comparison layouts.
Chart Type
Visme offers extensive features for adding interactivity to web publications. Users can create pop-up windows that display additional details when a viewer clicks a data point, apply sequenced animations to highlight key trends, and add clickable elements that navigate to related content or external URLs.
Venngage focuses on straightforward interactivity. Users can add hyperlinks to chart elements, embed charts on websites, and use basic hover effects like tooltips that display data values. Visme is the stronger choice for dynamic, multimedia-rich storytelling requiring pop-ups and complex animations, while Venngage suffices for projects needing simple tooltips and links.
Chart Type
Both platforms organize their template libraries around a broad set of chart categories, but their focus and aesthetics diverge. It helps to count templates within the specific chart category you need rather than looking only at total library size, and to preview several examples since quality varies by template age.
- Visme: Ties most templates to business, marketing, and creative use cases like quarterly reports, marketing summaries, or survey results. Its aesthetics lean toward bold color palettes, modern typography, and interactive elements suited for presentations and social content.
- Venngage: Surfaces more industry-specific options, particularly for healthcare, education, finance, human resources, nonprofit work, and public sector communications. Its templates use cleaner, flatter layouts with restrained color schemes that work well for reports, white papers, and print materials.
Because both platforms let you customize data, labels, colors, and fonts, the right library is the one whose structure and layout save you the most setup time.
Chart Type
The editing canvas determines how freely you can manipulate chart elements once placed. In Visme, you can reposition elements anywhere on the canvas using dynamic snapping guides that align objects to page edges, other elements, and an invisible grid. A dedicated layer panel lets you reorder, lock, and hide individual objects, making it easy to tuck a legend behind a data series or bring an annotation forward. Visme also allows direct manipulation of chart internals on the canvas, so you can nudge labels, resize plot areas, and adjust spacing by hand.
Venngage provides similar drag-and-drop placement and alignment guides, with layer controls accessible via a context menu and sidebar. However, Venngage keeps charts within structured widget boundaries; internal elements like axis labels or individual data points are edited through a settings panel rather than directly on the canvas. Visme suits teams wanting pixel-level control over chart composition, while Venngage offers a guided experience with fewer opportunities to break alignment.
Chart Type
Brand kits store an organization’s visual identity—logos in multiple formats, custom color palettes with exact hex codes, and typography specifications (font families, weights, and sizes). When automated brand kit support is active, every graph, axis label, legend, and data callout draws from the approved palette automatically. Logos are placed and often locked in position to prevent distortion or accidental recoloring, while typography settings flow through chart titles, annotations, and footnotes.
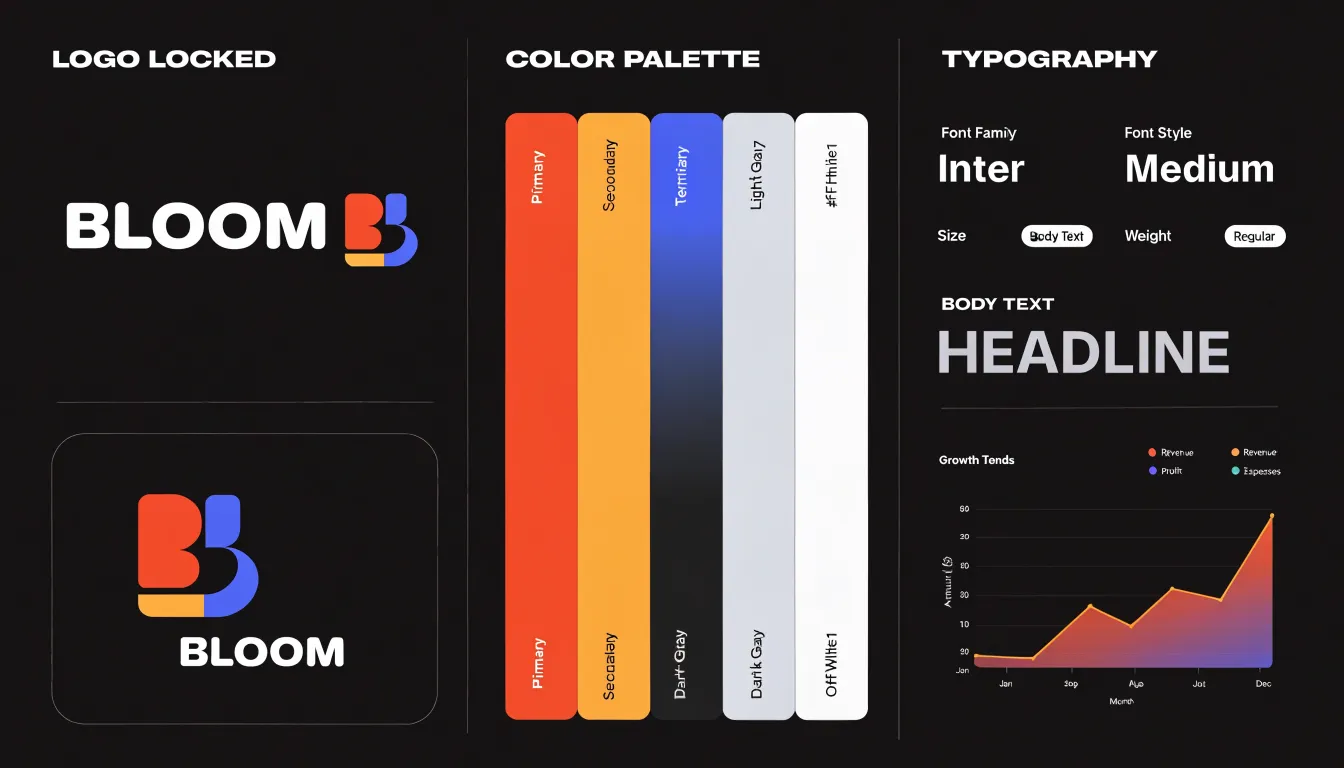
This automation keeps frequent outputs consistent across marketers, analysts, and consultants without manual color matching. It also supports accessibility, as teams can define high-contrast palettes once and reuse them across every chart. For organizations managing multiple identities, brand kits can be segmented by brand or sub-brand. When a primary color changes, updating the kit once propagates the new value to future charts, keeping templates aligned with current guidelines.
Chart Type
Both platforms support remote collaboration, asset sharing via brand kits and folders, and asynchronous review, but they structure multi-user workflows differently.
Visme allows simultaneous co-editing with live cursors and instant syncing. Comment threads attach directly to specific chart or infographic elements, letting reviewers question a data label or color choice on the canvas. Permission management covers viewer, editor, and admin roles, with project-level controls over who can publish or export.
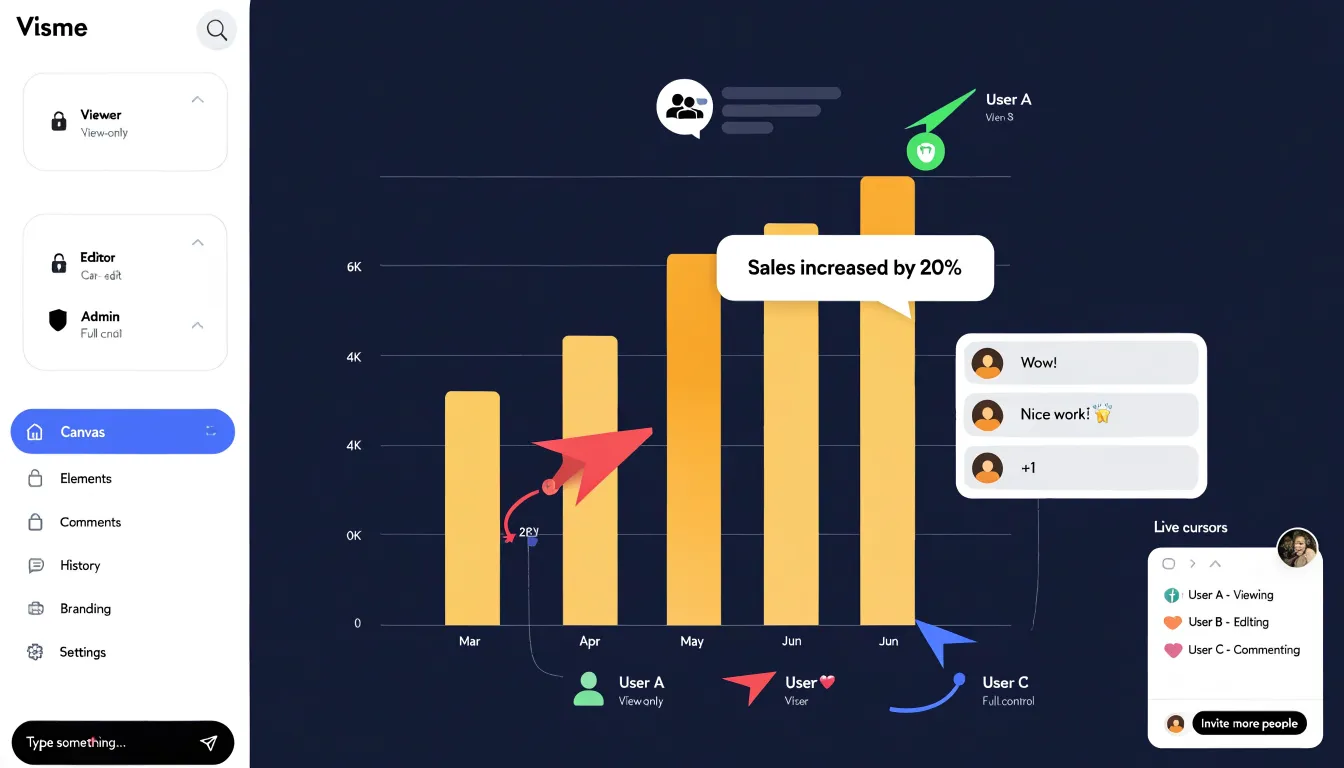
Venngage builds collaboration around structured team workspaces on its Business plans. Simultaneous editing works reliably for small groups, though live presence indicators are lighter than Visme’s. Comment threads tie to pages and elements and can be resolved once addressed. Venngage’s permissions cover team members, reviewers, and external collaborators, using folder-level access to restrict sensitive client work to specific groups. Visme’s granular element-level commenting and permissions suit complex collaborative charts, while Venngage’s workspace hierarchy appeals to organizations managing varied stakeholder access.
Chart Type
Export formats determine how well your charts translate to print or the web. Both platforms export PDF, PNG, SVG, and HTML5, though output fidelity differs.
- Print (PDF and PNG): Visme exports PDFs at up to 300 DPI with bleed and crop marks for professional printing, alongside high-resolution PNGs for posters or flyers. Venngage offers print-optimized PDFs and 2x or 3x resolution PNGs, though they may require minor tweaks for print perfection.
- Web (SVG and HTML5): SVG keeps scalable vector graphics sharp on responsive sites, and Visme’s SVG output better preserves complex chart elements like gradients and custom shapes. Both tools support HTML5 export to embed interactive charts and animations, though Venngage’s HTML5 export has limitations with certain chart types compared to Visme’s more consistent fidelity.
Chart Type
For beginners without design experience, a tool’s learning curve starts with how it presents chart selection:
- Visual galleries: Showing small previews of finished charts lets newcomers recognize the right option by sight without memorizing terms like scatter plot, stacked bar, or radar chart.
- Purpose-driven navigation: Grouping charts by goal—such as comparison, trend, or proportion—avoids nested menus and helps users start from the story they want to tell.
- Tooltips and descriptions: Plain-language explanations clarify when one chart suits a dataset better than another.
- Templates and defaults: Prebuilt charts allow beginners to reverse-engineer layouts, while sensible default colors, labels, and axis formatting make first drafts presentable without manual adjustment.
Chart Type
Pricing structures on both platforms dictate what you can realistically produce at each tier:
- Free plans: Visme caps project counts and restricts premium templates and chart elements. Venngage limits downloads and watermarks exported files, making it unsuitable for client deliverables or formal presentations.
- Paid plans: Visme starts at $15 per month (billed annually) for its Pro plan, bundling its chart builder, data widgets, and templates into tiers that scale with collaboration and brand controls. Venngage offers more generous free access to templates and starts its premium plan at $19 per month, scaling around export volume, template access, and team seats.
- Enterprise plans: Both use custom quotes based on seat counts, security requirements, and dedicated support. Organizations should weigh these costs against hours saved per project, brand consistency, and reduced reliance on design specialists.
Chart Type
When a project stalls, four support elements determine how quickly you can resolve technical roadblocks:
- Live chat responsiveness: Test the channel during your working hours to see if real humans are available with reasonable wait times, rather than a slow or bot-only queue, and check whether transcripts or follow-up emails are provided.
- Ticketing system: Look for a support portal that accepts detailed descriptions and screenshots, provides clear response-time commitments, and maintains a visible ticket history for escalating recurring problems.
- Documentation depth: Verify that the searchable knowledge base covers chart creation, data imports, export settings, and edge cases like large datasets or unusual configurations, and check that it is updated regularly.
- Video tutorials: Look for a library of short, step-by-step walkthroughs organized by feature to show exactly where to click for visual tasks like adjusting axis labels.
Chart Type
Choosing between Visme and Venngage comes down to project complexity, budget, and skill level.
Choose Visme if you are a marketer, educator, or analyst who needs intricate, interactive charts, advanced options like multi-axis or hierarchy charts, and deep control over animations and exports—and you have the time to learn a more complex interface. Choose Venngage if you are a beginner, small business, or high-volume team prioritizing ease of use, speed, and polished industry-specific templates for standard charts and infographics. Because both platforms offer free trials, testing each with your own dataset is the fastest way to confirm which workflow fits.
Frequently Asked Questions
What chart types do Visme and Venngage support?
Both Visme and Venngage support standard bar charts, pie charts, line graphs, area charts, donut charts, and scatter plots. Visme provides a slightly broader library, including radar, bubble, and hierarchy charts, while Venngage focuses on simplicity for clean, professional-looking charts.
Does Visme or Venngage support live data connections?
Both platforms accept CSV and Excel uploads, but Visme integrates with Google Sheets so users can link a chart to a sheet range and refresh data on demand, and Visme also supports live API endpoints. Venngage offers a comparable manual refresh process via Google Sheets on higher-tier plans, and its API connectivity is more limited.
Which tool is better for multi-axis and technical charts?
Visme exposes advanced controls for multi-axis graphs and custom data thresholds, letting users set reference lines or conditional formatting. Venngage offers a more constrained set of options for intricate multi-axis graphs and supports custom thresholds through manual annotation and color coding.
Can I export charts for print and web from Visme and Venngage?
Both platforms export PDF, PNG, SVG, and HTML5. Visme exports PDFs at up to 300 DPI with bleed and crop marks, while Venngage offers print-optimized PDFs and 2x or 3x resolution PNGs; both support HTML5 export, though Venngage’s HTML5 export has limitations with certain chart types compared to Visme.
How much do Visme and Venngage cost?
Visme starts at $15 per month billed annually for its Pro plan, while Venngage starts its premium plan at $19 per month. Visme’s free plan caps project counts and restricts premium templates and chart elements, Venngage’s free plan limits downloads and watermarks exported files, and enterprise plans use custom quotes.
Is Visme or Venngage better for beginners?
Venngage is recommended for beginners, small businesses, and high-volume teams prioritizing ease of use, speed, and polished industry-specific templates for standard charts and infographics. Visme is better suited to users who need intricate, interactive charts and have time to learn a more complex interface.
Tony Astor
Tony writes about data visualization and the tools people use to build charts and dashboards. More about Data Illustrator