Venn Diagram vs Euler Diagram: Key Differences
 By Tony Astor ·

Venn Diagram vs Euler Diagram
A Venn diagram shows every possible intersection among sets, including empty regions, while an Euler diagram shows only intersections that actually exist in the data. Venn diagrams suit formal logic and set theory; Euler diagrams suit real-world data, classification, and presentations where empty overlaps would add clutter without meaning.
Table of Contents
Venn Diagram
A Venn diagram is defined by its commitment to completeness: it must display every possible intersection among the sets involved, whether or not those regions contain actual members. In a two-set diagram, four regions are always present: the area belonging only to the first set, the area belonging only to the second set, the area where both overlap, and the area outside both. With three sets, the count rises to eight, and with four it reaches sixteen. Each additional set doubles the number of theoretically possible combinations that must be depicted.
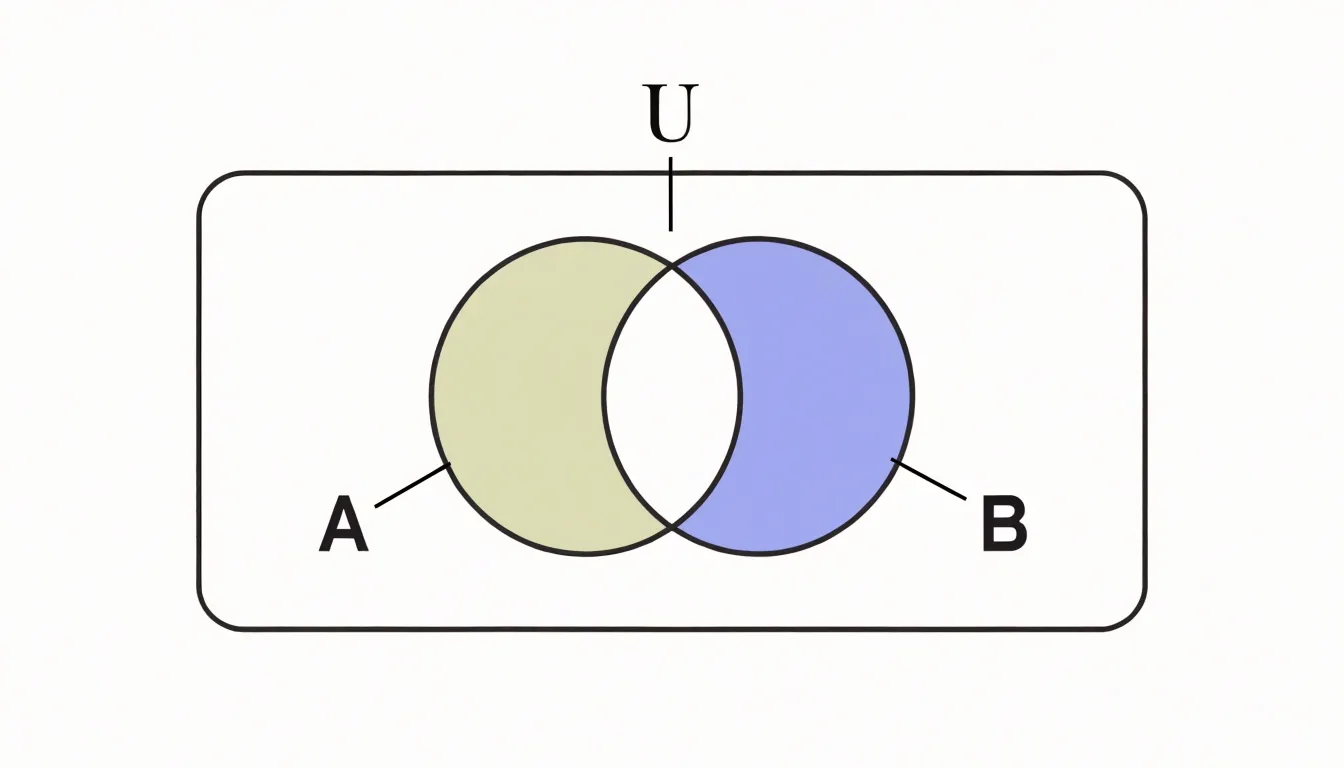
This rule holds even when a region is empty. If no element satisfies the combined conditions of a particular intersection, the corresponding area is left blank rather than removed. The blank space communicates that the combination was considered and found to contain nothing. Omitting empty regions would make the chart no longer a Venn diagram in the strict sense.
This requirement stems from the form’s history. John Venn introduced these diagrams in the 1880s to represent propositions in logic, where showing every conceivable combination provided a systematic basis for reasoning about syllogisms and conditional statements. Under this definition, the diagram serves as a complete map of logical space, where each region stands for a distinct truth condition.
As the number of sets grows, the figures become crowded and difficult to draw with simple circles; four sets require ellipses or other shapes, and five or more demand elaborate constructions. Nonetheless, a Venn diagram earns its name by guaranteeing that every geometrically possible intersection appears on the page.
Euler Diagram
An Euler diagram applies a principle of selective inclusion. Rather than drawing every possible intersection, it shows only the overlaps that actually exist in the data. When two or more groups share no members, their circles are drawn apart. The result is a visual representation shaped directly by real-world constraints.
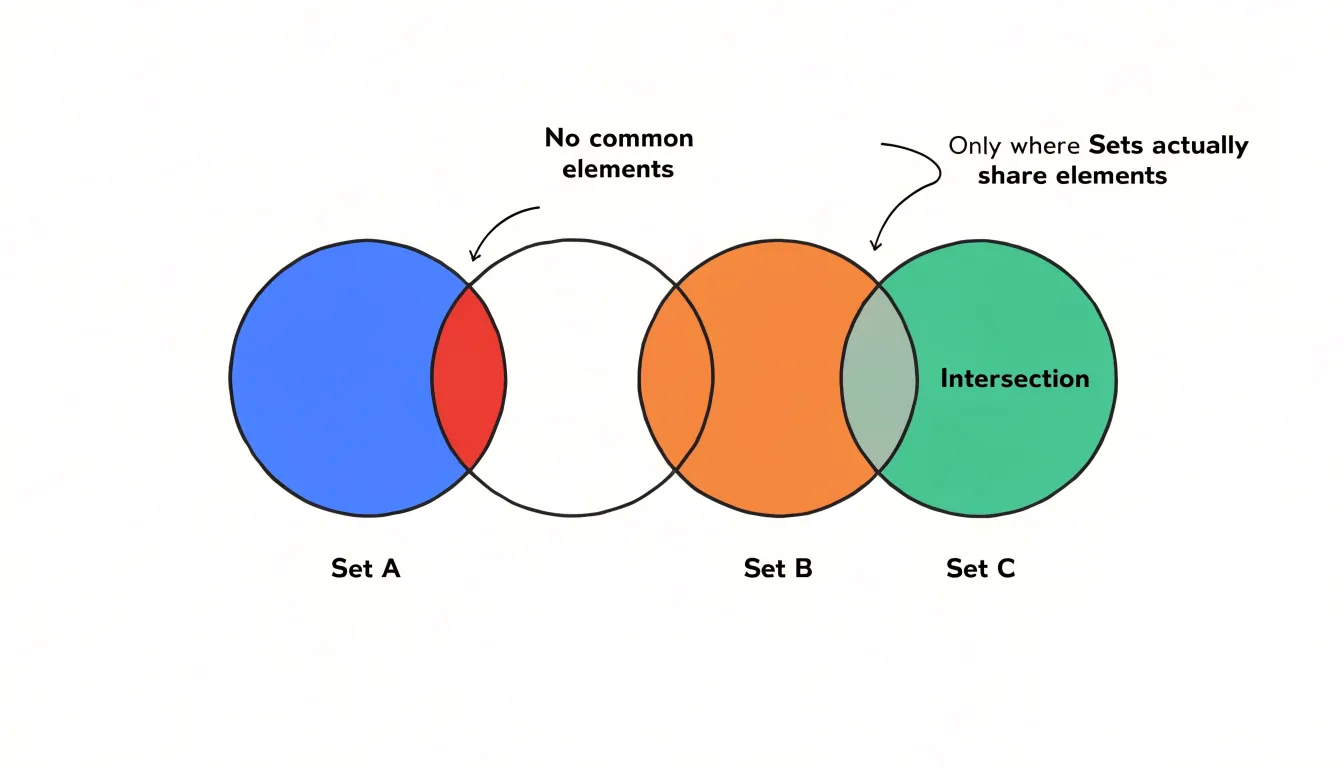
Because each region corresponds to a genuine category or combination, the viewer does not have to mentally filter out purely theoretical regions. Empty intersections are simply absent, allowing the diagram to communicate with fewer marks and less ambiguity.
Practical applications benefit from this economy:
- Biology: Showing gene sets that genuinely overlap across two pathways while leaving unrelated pathways visually separate.
- Market research: Positioning customer segments that never coincide apart so analysts see at a glance which combinations are worth investigating.
- Logic and set theory teaching: Helping students focus on the actual membership structure of a problem rather than an abstract grid of possibilities.
The trade-off is that the author must know the data well enough to decide which intersections to omit, since the layout encodes those decisions.
Overlapping Relationships
Both Venn and Euler diagrams illustrate set theory principles by representing distinct categories as enclosed regions and shared characteristics as intersections. A point inside a circle signals membership in that set, and a point in an overlapping zone signals membership in every set containing it. Because they share this underlying logic, the conceptual vocabulary of union, intersection, and shared traits carries across both formats, whether a marketer is comparing customer segments, a biologist is classifying organisms, or a teacher is mapping student skills.
Empty Sets
In Euler diagrams, regions representing empty sets are not drawn. For example, in a diagram of household pets consisting only of cats and dogs, the circles for cats and dogs do not intersect because no pet is both. There is no shaded region or label indicating “cats that are dogs.” Similarly, in biological classification, circles for mammals and birds are placed separately to convey mutual exclusivity. By using spatial omission instead of drawing and shading empty intersections, Euler diagrams highlight disjoint sets and focus on the actual composition of a domain.
Universal Set
In Venn diagrams, the bounding rectangle represents the universal set (typically written as $U$), which is the totality of all elements under consideration. Every circle inside the rectangle stands for a subset of $U$ (labeled $A$, $B$, $C$, and so on), establishing the domain of discourse and preventing ambiguity about what lies outside the diagram’s scope.
The region outside every circle but inside the rectangle corresponds to elements belonging to none of the defined sets. Because the rectangle marks the outer limit of the analysis, it supports set operations such as the complement—everything in the universal set that falls outside a given set. Making the universal set explicit keeps the diagram internally consistent and ties it directly to formal set notation.
Visual Complexity
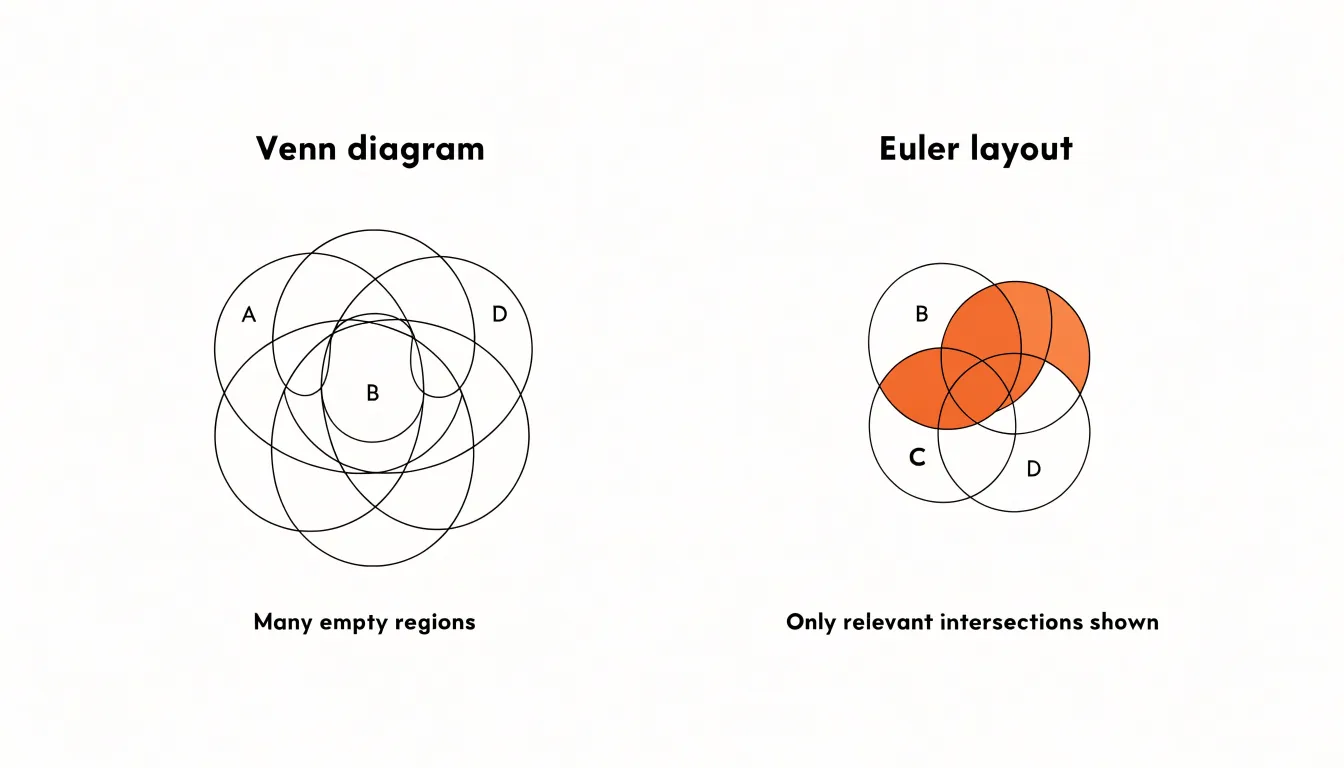
A Venn diagram representing four or more sets quickly becomes dense with intersecting curves, requiring the viewer to trace multiple boundaries to locate a specific intersection. In contrast, Euler diagrams reduce visual complexity by tailoring their geometry to the data’s actual structure, using disjoint circles or nested ellipses to leave more white space. For example, three sets with one subset relationship can be drawn in an Euler diagram as two non-overlapping circles with one circle contained inside another, avoiding the maze of empty overlapping regions required by a Venn diagram. Simpler layouts are generally more effective in presentations and educational contexts where quick comprehension is essential.
Subset Illustration
Euler diagrams illustrate subset relationships by placing smaller shapes entirely within larger ones. When set $A$ is a proper subset of set $B$, every element of $A$ is also an element of $B$, and the diagram reflects this by drawing $A$‘s circle completely inside $B$‘s circle.
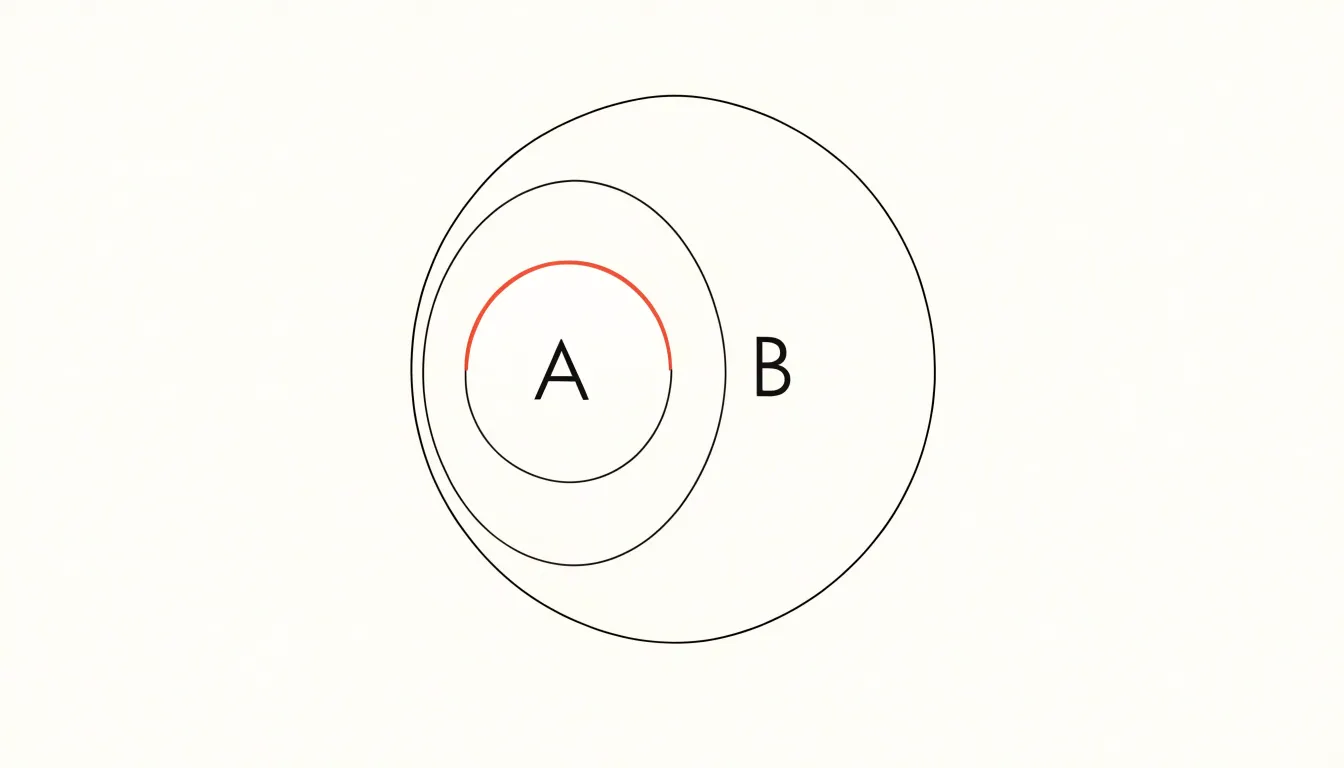
A Venn diagram of the same relationship must still include a region for elements in $A$ but not in $B$, leaving it empty. By nesting $A$ inside $B$, an Euler diagram eliminates this redundant zone. This concise representation reduces cognitive load and is especially useful in logic, set theory, and taxonomy, where hierarchical classifications are common.
Everyday Examples
Everyday categories demonstrate how Venn and Euler diagrams differ in practice:
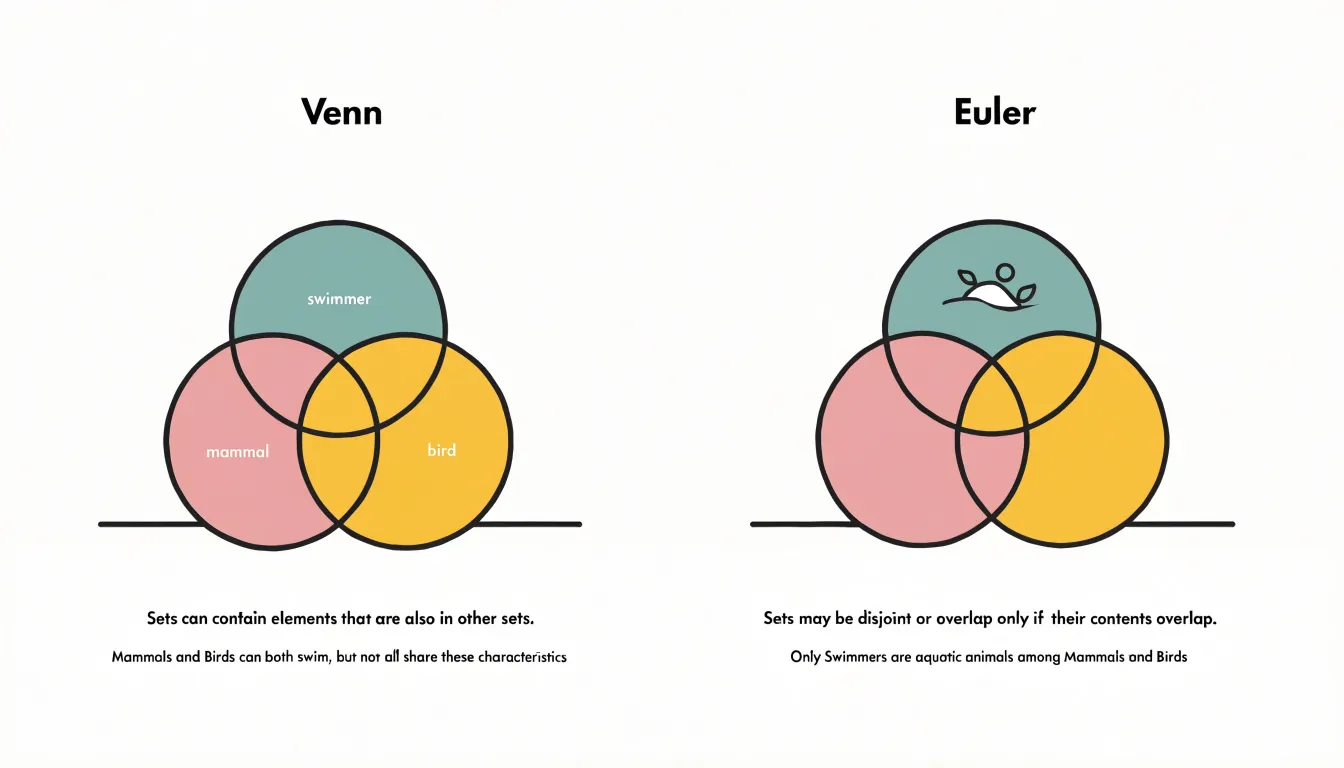
- Animals (mammals, birds, and animals that can swim): A Venn diagram uses three overlapping circles. The overlap between mammals and swimmers holds dolphins, and the overlap between birds and swimmers holds penguins. The central region where all three intersect is drawn but left empty, since no animal is both a mammal and a bird. An Euler diagram keeps the mammal and bird circles separate while letting the swimmer circle overlap each of them individually, omitting the impossible triple intersection.
- Vehicles (cars, electric vehicles, and two-wheelers): A Venn diagram draws three overlapping circles, including an empty triple overlap for electric two-wheeled cars. An Euler diagram shows only existing overlaps—electric cars and electric two-wheelers—with no triple-intersection region.
- Food (fruits, citrus fruits, and yellow foods): A Venn diagram uses three fully intersecting circles with regions for yellow citrus fruits (lemons) and yellow non-citrus fruits (bananas), alongside empty zones for non-fruit citrus. An Euler diagram places the citrus circle entirely inside the fruit circle, with the yellow circle overlapping both to capture lemons and bananas without generating empty regions.
Data Analysis
When presenting datasets, analysts must weigh data density, category counts, and audience goals:
- Data density: Assessing density early—by counting how many meaningful intersections the dataset actually contains—prevents a report from becoming an exercise in decoding empty regions.
- Category counts: With two or three sets, both diagram types remain legible. With five or more categories, circle overlap geometry becomes difficult to render faithfully, and analysts should consider alternatives such as a matrix or an UpSet plot.
- Stakeholder communication: Technical audiences may appreciate the exhaustive structure of a Venn diagram, which signals completeness and shows that every combination was considered. Executive or cross-functional readers often respond better to an Euler diagram, which foregrounds relationships that carry business meaning.
Common Misconceptions
In classrooms, textbooks, news graphics, and casual conversation, the term “Venn diagram” is applied indiscriminately to any illustration of overlapping circles. Media and advertising frequently use overlapping circles to show only existing relationships—which is actually an Euler diagram—while calling the graphic a Venn diagram because the name is recognizable and culturally established through logic puzzles. Because both diagram types share the same visual vocabulary of circles, ellipses, and regions, audiences rarely notice the difference, turning one specific diagram’s name into a generic catch-all for the entire family of set diagrams.
Design Simplicity
Effective set diagrams rely on restrained choices across color, labeling, and shape selection:
- Color coding: Use a limited palette of three to five distinct hues, each assigned a stable meaning across a document. Colors should sit far enough apart in hue and lightness to remain distinguishable in grayscale printing and on low-quality screens. Never use color as the sole carrier of meaning; combine it with pattern or position so the graphic remains legible for colorblind readers.
- Label placement: Place short labels inside shapes with clear alignment and no crossing lines to reduce eye travel. Where space is tight, use a few orderly leader lines and callouts.
- Shape selection: Circles, ellipses, and rectangles are read faster than complex polygons, and using a single shape family builds visual rhythm. Overlapping regions must be large enough to hold labels without crowding, and generous white space between elements prevents adjacent regions from merging visually.
Teaching and Education
Educators can pair both diagram styles to build a flexible understanding of set relationships:
- Set theory and logic: Start with Venn diagrams to illustrate universal sets and complements using the rectangular frame, or have students shade regions to represent unions, intersections, and differences. Venn diagrams also allow students to test syllogisms by checking all possible overlaps.
- Computer science: Use Venn diagrams to teach Boolean operations, database joins, and bitwise logic, where showing all combinations reinforces truth tables.
- Classification and ontologies: Use Euler diagrams to show disjoint sets or subset hierarchies without implying non-existent overlaps.
A combined approach works well: begin with Euler diagrams to model real-world scenarios, then transition to Venn diagrams to explore hypothetical combinations and formal logic. Hands-on activities—such as drawing diagrams with colored loops, using software tools to manipulate sets, or having students translate between the two formats and justify their choice—deepen comprehension.
Business Strategy
Product managers and marketers use Venn and Euler diagrams to categorize market segments and product features:
- Feature parity analysis: Teams map competing products by placing shared features in intersections and unique features in non-overlapping regions, clarifying differentiation and guiding roadmap priorities.
- Target demographics: Circles represent customer groups defined by age, income, or behavior. Overlaps reveal multi-attribute segments, while Euler diagrams prevent false assumptions when certain segments share no members.
- Competitive positioning: Circles for each brand show overlaps in perceived value or functionality. Non-overlapping areas highlight underserved segments and differentiation opportunities, while overlaps indicate crowded market spaces.
Quick Reference
A quick reference comparison organizes the differences between Venn and Euler diagrams across three dimensions:
- Structural differences: Venn diagrams show all possible logical intersections (including empty ones); Euler diagrams show only existing relationships.
- Ideal use cases: Venn diagrams suit theoretical combinations, set theory instruction, and formal logic; Euler diagrams suit real-world data, statistics, and database visualization.
- Key limitations: Venn diagrams become cluttered beyond three sets and display meaningless regions; Euler diagrams require careful reading so the absence of a region is not overlooked.
Final Decision Matrix
To choose between a Venn and an Euler diagram, work through four steps in order—the first step that strongly favors one format usually settles the decision:
- Clarify intent: Choose a Venn diagram to show every possible logical relationship (including empty overlaps), or an Euler diagram to show only relationships that actually exist in the data.
- Assess data complexity: Count the sets and meaningful intersections. Two or three sets with populated overlaps fit either format. Beyond four sets, or when many intersections are empty, use an Euler diagram to avoid crowding.
- Consider the audience: Use Euler diagrams for general stakeholders who need every visible region to represent real data. Use Venn diagrams for audiences trained in formal logic or set theory, especially when proving an intersection is empty.
- Weigh presentation constraints: Factor in space for labels, color coding, and annotations; small displays favor the simpler Euler layout. Documenting this reasoning also helps defend the choice to reviewers.
Frequently Asked Questions
What is the difference between a Venn diagram and an Euler diagram?
A Venn diagram must show every possible intersection among the sets, including empty regions, while an Euler diagram shows only overlaps that actually exist in the data.
Do Venn diagrams have to show empty intersections?
Yes. In a Venn diagram, if no element satisfies a particular intersection, that area is left blank rather than removed; omitting empty regions would make it no longer a Venn diagram in the strict sense.
What does the rectangle around a Venn diagram represent?
The bounding rectangle represents the universal set, typically written as $U$, which is the totality of all elements under consideration.
How does an Euler diagram show that two sets do not overlap?
It draws their circles apart and does not draw a region for the empty intersection, as with cats and dogs when no pet is both.
Why can Venn diagrams become cluttered with more sets?
A Venn diagram must depict every theoretically possible combination, so with four or more sets it becomes dense with intersecting curves and is harder to draw with simple circles.
How is a subset relationship drawn in an Euler diagram?
When set $A$ is a proper subset of set $B$, every element of $A$ is also in $B$, so $A$’s circle is drawn completely inside $B$’s circle. A Venn diagram of the same relationship must still include an empty region for elements in $A$ but not in $B$.
Tony Astor
Tony writes about data visualization and the tools people use to build charts and dashboards. More about Data Illustrator