Venn Diagram: How to Show Overlapping Sets
 By Tony Astor ·

Venn Diagram
A Venn diagram uses overlapping circles to show relationships between sets: each circle represents a category, overlapping regions show shared elements, and non-overlapping areas show what belongs only to one group. It clarifies comparison and intersection—what is common, what is unique, and where boundaries lie—and works best with a small number of sets.
Table of Contents
Venn Diagram
A Venn diagram uses overlapping circles to represent relationships between different sets of data. Each circle stands for a category or group, overlapping areas show shared elements, and non-overlapping portions reveal what belongs exclusively to one group. Its core purpose is to clarify comparison and intersection—showing what is common to several groups, what is unique to each, and where boundaries lie.
Certain situations make the Venn diagram especially valuable:
- Logic: It serves as a practical way to test the validity of arguments involving categorical statements. By shading regions to represent empty sets and marking areas to show existence, a reasoner can examine whether a conclusion follows from given premises.
- Statistics: The diagram illustrates concepts such as union, intersection, and complement of events, giving students and analysts an intuitive picture of probability relationships before formal calculations begin.
- Exploratory data analysis: Analysts compare membership across overlapping categories, such as survey respondents who fall into several demographic groups at once.
- Business analysis: Teams map market segments, compare product features against competitor offerings, or identify the overlap between customer needs and internal capabilities. During strategy sessions, the shape encourages discussion about shared ground and distinct strengths to guide decisions on positioning, partnerships, and resource allocation.
The tool works best when the number of sets stays small, since clarity diminishes as more circles are added.
Circle Anatomy
A Venn diagram is built from a small vocabulary of visual parts:
- Set region: A single circle representing one collection of items. Everything inside belongs to the set; everything outside does not. The size of a circle carries no fixed meaning, and its area does not usually correspond to the number of members—it works purely as a visual container for membership.
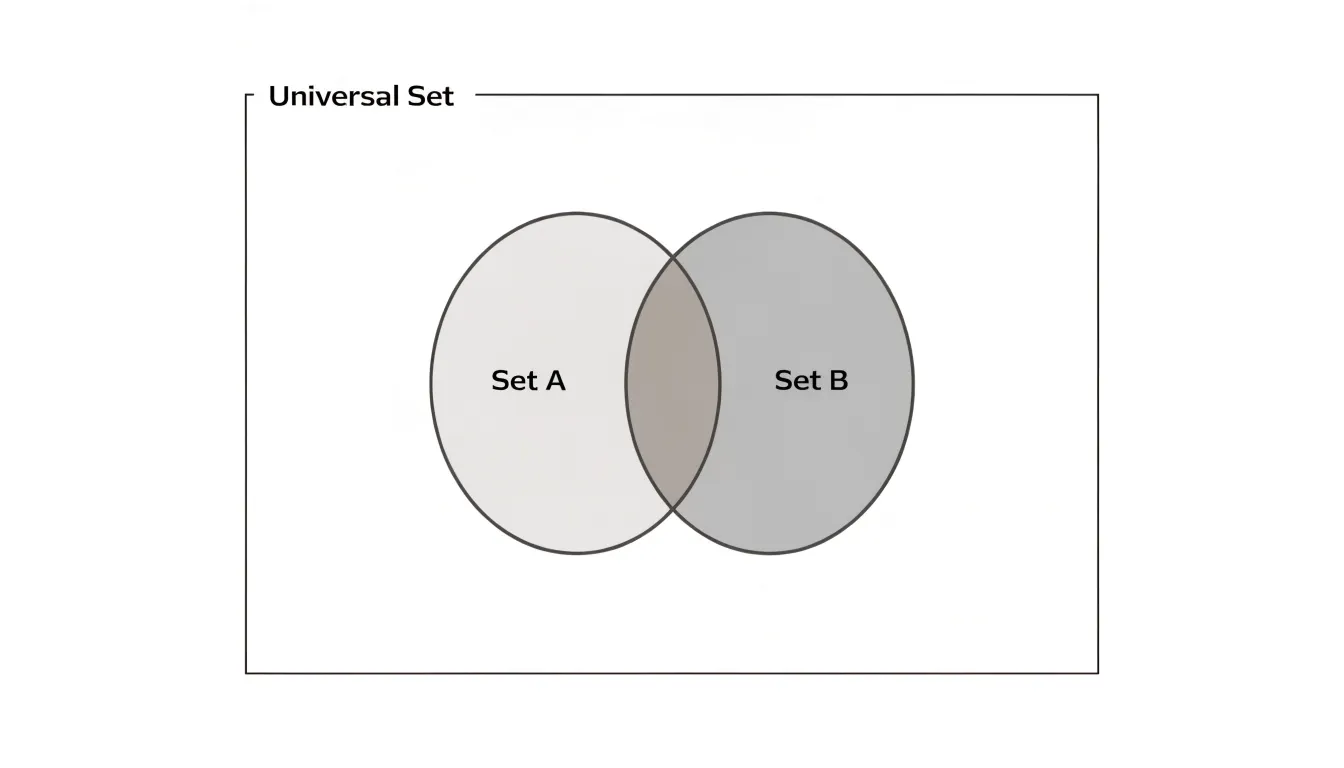
- Intersection (lens): The pointed-oval shape created where two circles overlap. An item placed here belongs simultaneously to both sets and shares the properties of each. A diagram with three circles produces three pairwise lenses plus a small central region shared by all three sets. These zones display combinations that plain lists would hide.
- Universal set (universe): A surrounding rectangle representing the total context under discussion—every item being considered, whether or not it belongs to any circle. Items placed inside the rectangle but outside all circles belong to none of the named sets. The rectangle separates what the diagram covers from everything else in the world.
- Labels and marks: Each circle carries a label naming its set, and the rectangle may carry a label for the universe. Shading or marks inside regions indicate emptiness or presence, turning the basic shapes into a precise map of membership and overlap.
Two-Circle Diagrams
The two-circle diagram is the most accessible format for side-by-side comparison. It creates three distinct regions: traits belonging only to the first group, traits belonging only to the second, and traits held in common where the circles intersect. Each circle can stand for a species, time period, political system, or competing product.
While the overlap often carries the most analytical weight by revealing underlying connections, the non-overlapping crescents highlight what makes each entity distinct, giving equal visual weight to difference and similarity. Placing the circles side by side reinforces the comparative intent, guiding the eye naturally from one to the other and then to the middle.
This arrangement works best when the two subjects are genuinely comparable in scope, since a lopsided diagram can imply a relationship that does not exist. Categories being compared ought to remain consistent across both circles so the reader can trust the parallel structure. Because it is difficult to misread, the two-circle diagram is a dependable tool for introductory explanations and classroom exercises.
Three-Circle Diagrams
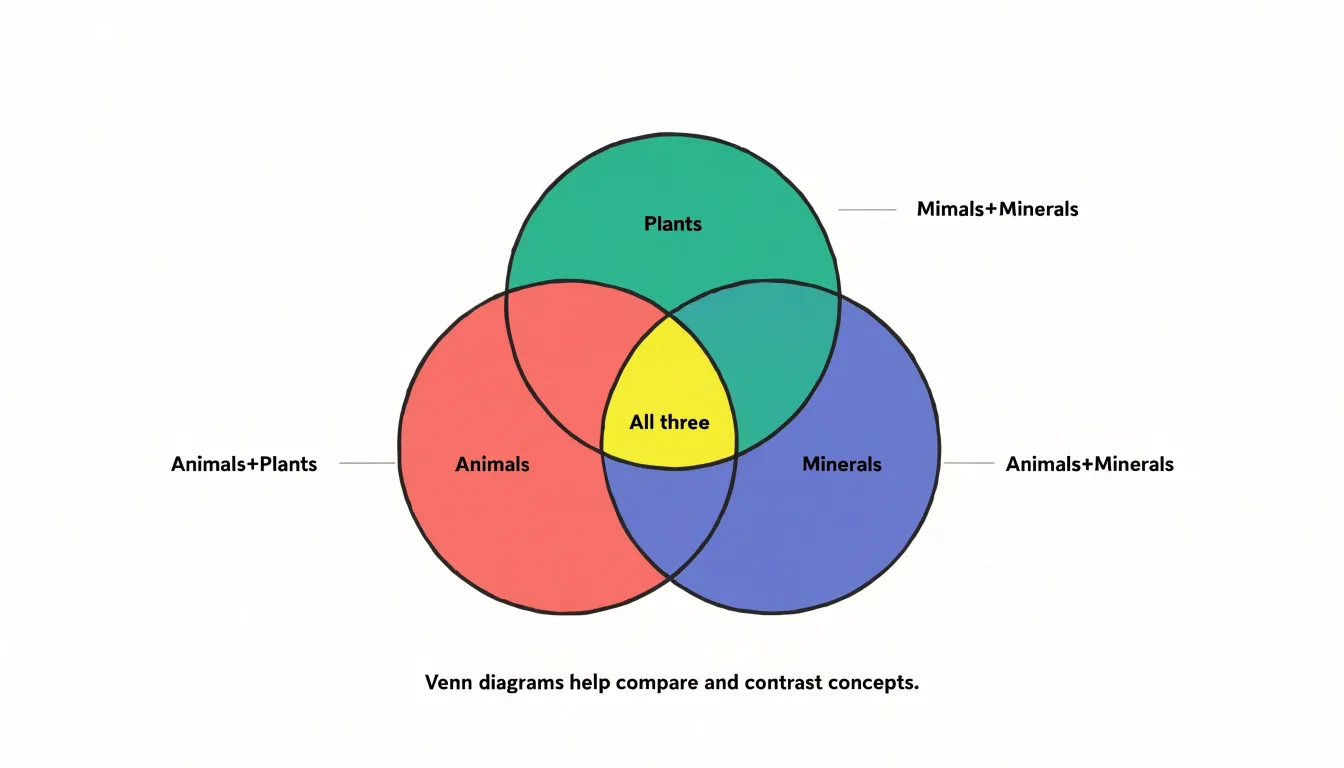
Three-circle Venn diagrams map relationships among three categories, creating seven distinct sub-regions:
- Three single-category areas: Items engaging with only one category.
- Three pairwise intersections: Items combining two categories but not the third (for example, people who “Read Fiction” and “Watch Films,” but do not “Listen to Podcasts”).
- One central triple intersection: Items belonging to all three categories.
Begin by defining the three categories so that each is mutually exclusive in its core meaning yet capable of overlapping with the others. When placing items, work from the outside in: first fill the single-category areas, then the pairwise overlaps, and finally the central region. This sequence prevents double-counting and ensures each item sits in the most specific region that applies. Always verify that the sum of items across all seven regions equals the total number of items to ensure internal consistency.
To maintain visual balance, make the circles equal in size and arrange them symmetrically so that no overlap region becomes disproportionately large or small, which can distort interpretation. Use consistent notation, such as numbers or symbols, to represent items, and provide a key if necessary.
Labeling and Shading
Deliberate visual choices help readers parse overlapping regions:
- Color-coding: Assign a distinct hue to each primary circle so viewers can track membership across the diagram, and reserve a neutral tone such as pale gray for intersections to keep shared zones visually calm. When three or more sets are involved, restrict the palette to a handful of well-separated colors to prevent muddy blends where hues overlap. Maintain the same color for the same category across a series of diagrams in a document.
- Selective shading: Rather than filling every region with equal saturation, shade only the intersection of interest, leaving surrounding areas lightly tinted or outlined. This directs attention to a single takeaway that reads clearly from a distance in presentations.
- Label placement: Place set names just outside each circle, aligned with the curve so the label clearly belongs to its region. Position intersection text at the visual center of the overlapping area, or use a short leader line when space is tight. Where regions are too small to hold text, use a numbered legend to keep the diagram uncluttered.
- Contrast testing: Test the finished figure at reduced size and in grayscale to confirm that contrast survives printing and projection, and that labels remain legible without relying on color alone.
Union vs. Intersection
Set theory uses two basic operations for working with collections, supporting different kinds of thinking:
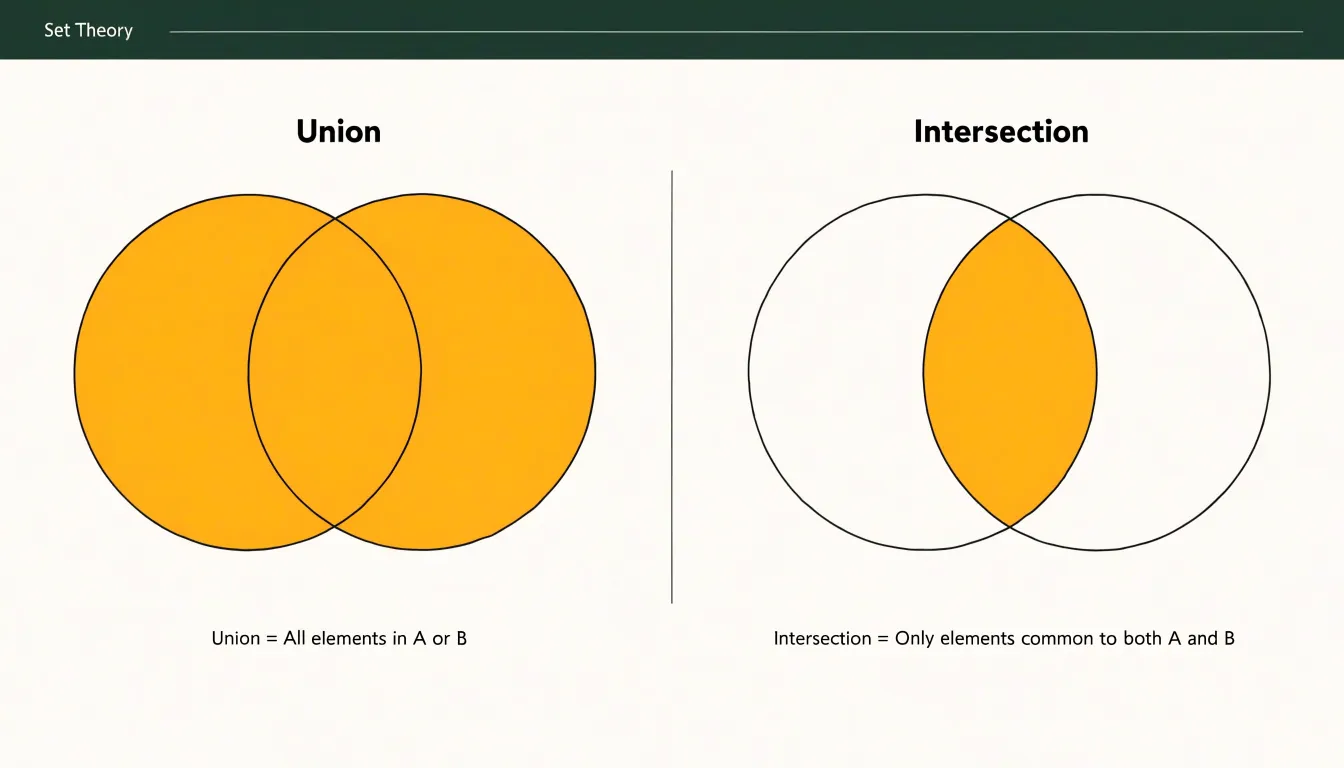
- Union: Gathers everything that belongs to either set, or to both. If one set holds book club members and another holds writing workshop attendees, the union is the full roster of everyone on either list, counted once. Visually, it is the entire shaded area of both circles. The union answers the question of coverage: what is the total range of elements in play? It grows as you add sets, never discards anything, and helps when the goal is to assemble, combine, or pool resources.
- Intersection: Keeps only the elements appearing in every set being compared—the people who attend both the book club and the workshop, located in the lens-shaped overlap. The intersection answers a question of commonality: what do these collections share? It can only shrink or stay the same as more sets are added, because each new condition filters the pool further. It helps when the goal is to narrow, find agreement, or identify a core that satisfies multiple requirements at once.
Understanding which operation fits a given question prevents a common confusion: assuming that combining categories means finding their shared ground, or that common ground represents the whole of what each group contains.
Disjoint Sets
Disjoint sets are two or more groups whose members have nothing in common. In a Venn diagram, this mutual exclusivity is expressed through complete, closed circles that sit entirely apart from one another with visible space between them—whether side by side, stacked vertically, or arranged in a cluster.
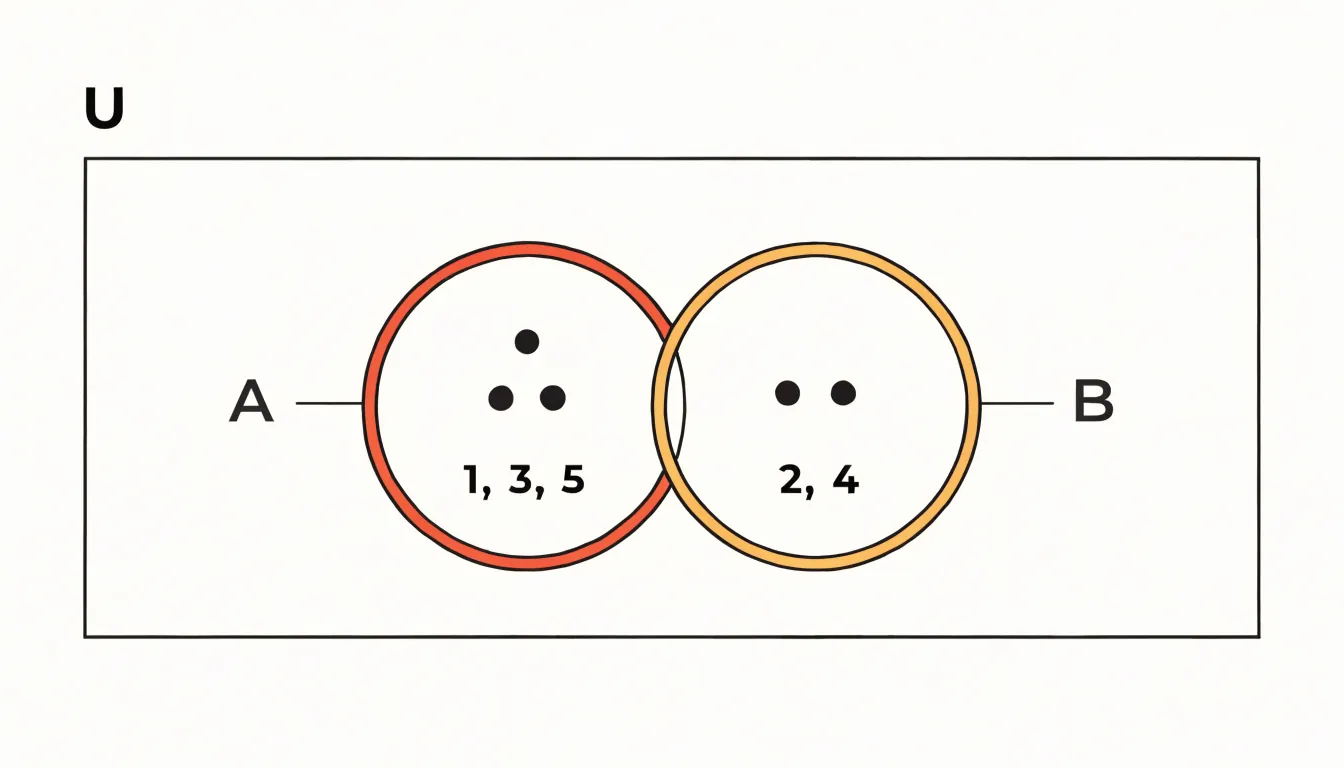
The absence of overlap carries meaning equal to the presence of overlap in other diagrams. Labeling each circle and listing representative members inside demonstrates what belongs where, while a surrounding rectangle for the universal set makes it explicit that both circles inhabit the same broader context even though their contents never mix.
Disjoint diagrams serve well in classification systems, survey responses with single-choice answers, or biological categories that cannot overlap, where choosing one option excludes the others. Maintaining generous spacing and consistent circle sizes keeps the emphasis on complete separation.
Subsets
In a Venn diagram, a subset is drawn as a circle positioned completely within the boundary of a larger circle, showing that every member of the inner group is also a member of the outer group.
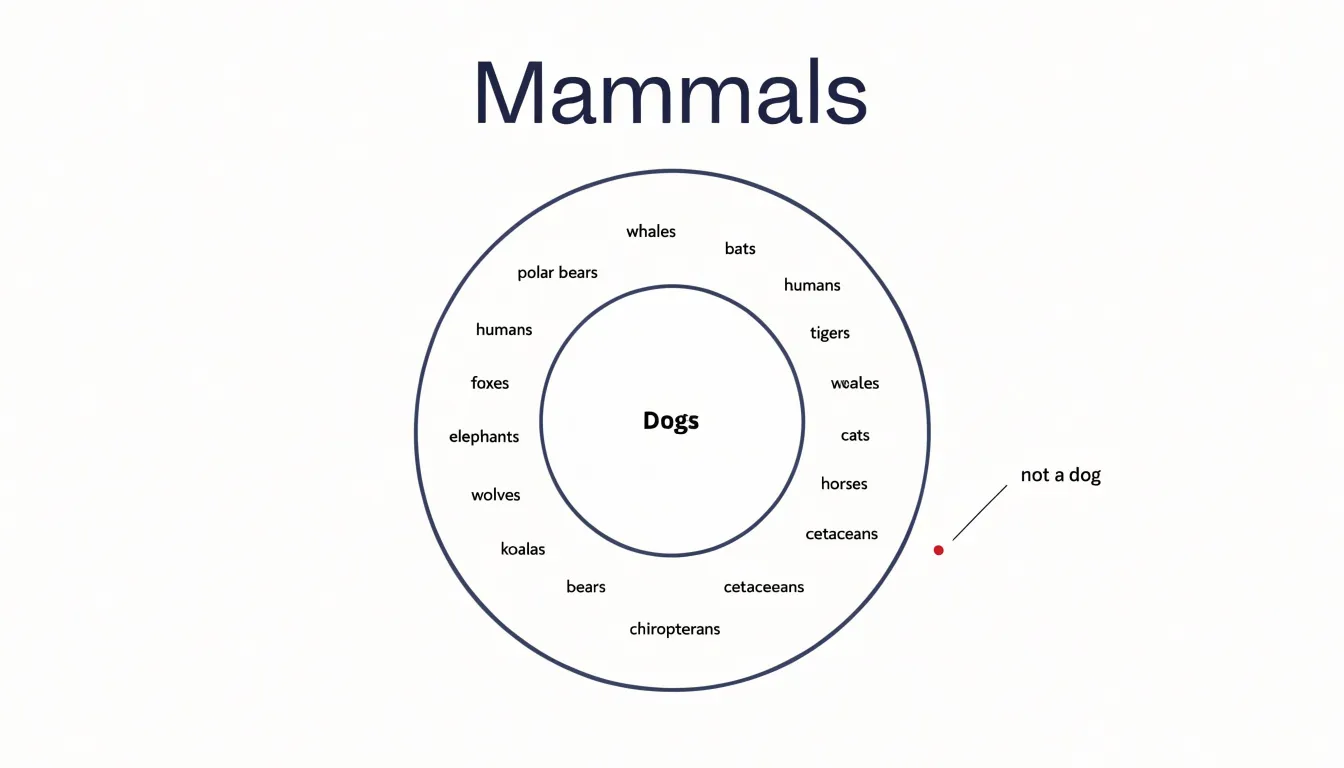
Consider a diagram of animals where a wide outer circle represents all mammals and a smaller inner circle represents dogs. Because every dog is a mammal, the dog circle sits wholly within the mammal circle. The space within the mammal circle but outside the dog circle stands for mammals that are not dogs, such as whales, bats, or elephants. If a point representing a specific animal is placed in that outer ring, a viewer knows instantly that the animal is a mammal but not a dog.
This approach extends to multiple levels of hierarchy. A circle for poodles could sit inside the dog circle, which sits inside the mammal circle, producing three concentric layers of containment. Such layered diagrams are common in biology, product taxonomies, and organizational charts. Designers should keep inner circles clearly labeled and leave visible gaps between boundaries to avoid crowding.
Avoiding Common Mistakes
Small visual errors in proportion and placement can quietly distort a Venn diagram’s message:
- Inaccurate circle sizing: In a true proportional diagram, each circle’s area reflects the size of the set it represents. When one category contains a hundred items and another contains ten, equal-sized circles mislead viewers into assuming comparable magnitudes. Measure the areas rather than eyeballing them, and apply the scale consistently. If exact proportionality is impossible or unnecessary, state clearly that the diagram is schematic so readers do not read meaning into relative sizes.
- Crowded text placement: Labels crammed into narrow intersections become unreadable when reduced for a slide or printed page. Give each region breathing room, shorten labels to single words or short phrases, and maintain consistent font size and alignment across all regions.
- Mislabeled boundaries: Ensure boundary lines do not pass through text. Verify that overlapping areas are labeled only when the overlap represents a meaningful shared set, and remove stray labels that imply unsupported relationships. A final proofread by someone unfamiliar with the diagram will catch remaining ambiguities.
Reading Complex Diagrams
When a Venn diagram grows beyond three circles, the overlapping regions multiply quickly. Rather than letting your eyes wander across the shapes, adopt a systematic inside-out reading order:
- Begin at the center where all sets intersect. This innermost region represents elements shared by every category, giving you a fixed reference point.
- Move outward one layer at a time: examine the regions where all but one set overlap, then where all but two overlap, continuing progressively until you reach the outermost single-set regions. Each step outward removes one constraint, clarifying the meaning of every region in relation to the one before it.
Everyday Problem Solving
Venn diagrams externalize comparison and reduce cognitive load in everyday decision-making:
- Personal choices: When choosing between two job offers, sketching two circles and labeling the shared middle with qualities both roles provide (such as salary range or commute) clarifies what genuinely differs in the outer regions. The same approach works for selecting a neighborhood, school, or vacation destination by mapping cost, convenience, and lifestyle preferences.
- Product comparisons: A shopper comparing three laptops can place features like battery life, screen quality, and price into three interlocking circles. This structure quickly reveals whether a premium model’s extra features fall in outer zones you actually care about or in regions that overlap with cheaper alternatives. Reviewers and buying guides often use this layout to turn a dense spec sheet into a picture of relative advantage.
- Feature prioritization: In small teams and solo projects, overlapping circles can represent user needs, technical feasibility, and business value. Ideas sitting in all three regions become clear priorities, while ideas in only one circle signal a passion project, a technical curiosity, or a commercial bet needing more support—helping teams negotiate scope without lengthy spreadsheets.
Brainstorming
During group ideation sessions, overlapping rings give participants a shared spatial canvas for organizing concepts as they emerge, rather than listing ideas in a linear column. As people place concepts into regions, everyone can see where ideas cluster, which themes carry the most energy, and where gaps remain thin.
An idea placed inside an overlapping zone belongs to two categories at once, sparking conversation about what that intersection represents. A marketing concept nested within an engineering category, for instance, points toward a cross-functional opportunity. Facilitators can prompt participants to look at shared regions and ask what new idea could live there, pushing the group toward combinations that no single department would have proposed alone.
On a shared screen or whiteboard, participants can move items in real time, merge circles, or add new rings as fresh themes surface, leaving the team with a visual record of how their ideas connect to guide the next stage of planning.
Digital Tools
Several categories of software streamline Venn diagram creation:
- Presentation suites (PowerPoint, Keynote, Google Slides): These include shape tools that draw perfect circles by default. Insert two or three circles, set their fill to semi-transparent so overlaps remain visible, and use alignment guides and distribution controls for even spacing. Duplicate a single circle rather than drawing each separately to guarantee identical dimensions and symmetry.
- Vector illustration applications (Adobe Illustrator, Affinity Designer, Inkscape): These allow exact positioning through numeric input and snapping to grid lines or anchor points. Vector formats scale to any size without pixelation for posters and print materials. A common technique is to place circles on separate layers, lower fill opacity, and use pathfinder or boolean operations to isolate intersection zones if distinct colors are needed for each region.
- Dedicated diagramming services (Lucidchart, draw.io, Canva): These provide templates and drag-and-drop circle sets for teams needing consistent results without learning a full illustration program.
Whatever the tool, leave generous white space around the figure. Export to SVG or PDF to preserve crisp edges, or PNG for web publishing.
Overview
Choosing between a Venn diagram and related formats hinges on three questions: how many sets are involved, whether empty intersections are meaningful or distracting, and whether the audience needs to grasp logical possibility or observed reality.
- Venn diagrams work best for a small set of categories when you need to show all possible logical relationships—including overlaps that may be empty—to explain set logic or illustrate the full universe of combinations.
- Euler diagrams suit moderate set counts with an empirical emphasis, where only relationships that genuinely exist in the data deserve visual weight. By omitting empty or irrelevant overlaps entirely, they reduce clutter and prevent absent intersections from distracting the reader.
- Matrix diagrams (including heatmaps and grid-based tables) are preferable for larger set counts or many-to-many pairwise comparisons across variables. Because a matrix handles complexity through grid structure rather than spatial arrangement, it scales gracefully when sets multiply and overlaps become too numerous to draw legibly.
Frequently Asked Questions
What is a Venn diagram used for?
A Venn diagram uses overlapping circles to represent relationships between different sets of data. Its core purpose is to clarify comparison and intersection by showing what is common to several groups, what is unique to each, and where boundaries lie.
How many circles should a Venn diagram have?
A Venn diagram works best when the number of sets stays small, since clarity diminishes as more circles are added. When a diagram grows beyond three circles, the overlapping regions multiply quickly.
What are the seven regions in a three-circle Venn diagram?
A three-circle Venn diagram creates seven distinct sub-regions: three single-category areas, three pairwise intersections, and one central triple intersection. The pairwise intersections contain items combining two categories but not the third, while the central region contains items belonging to all three categories.
What is the difference between union and intersection in a Venn diagram?
Union gathers everything that belongs to either set, or to both, and visually it is the entire shaded area of both circles. Intersection keeps only the elements appearing in every set being compared, located in the lens-shaped overlap.
How are disjoint sets shown in a Venn diagram?
Disjoint sets are shown as complete, closed circles that sit entirely apart from one another with visible space between them. A surrounding rectangle for the universal set can make it explicit that both circles inhabit the same broader context even though their contents never mix.
How can I avoid common mistakes in a Venn diagram?
Avoid inaccurate circle sizing, because equal-sized circles can mislead viewers when categories contain very different numbers of items; if exact proportionality is impossible or unnecessary, state clearly that the diagram is schematic. Also give crowded text placement room, shorten labels, ensure boundary lines do not pass through text, and proofread for mislabeled boundaries.
Tony Astor
Tony writes about data visualization and the tools people use to build charts and dashboards. More about Data Illustrator