Typography for Charts: Fonts, Sizes and Hierarchy
 By Tony Astor ·

Typography for Charts
Effective chart typography uses a clean sans-serif font for most charts, sized so axis labels stay legible at their smallest display size, with a clear hierarchy built from scale, weight, and position. Limit charts to two font families, keep tick labels horizontal where possible, right-align numbers, enable tabular figures, and ensure text contrast meets WCAG’s 4.5:1 ratio.
Table of Contents
Font Family
Font family selection shapes how a chart reads before a single data point is interpreted. Sans-serif typefaces, with their uniform stroke weight and absence of decorative strokes, produce clean, uncluttered visuals that suit technical charts. Their simple letterforms stay legible at the small sizes typical of axis labels, tick marks, and legends, where fine serifs can blur or disappear entirely. On screens, and in charts reproduced at low resolution or passed through compression, sans-serif fonts hold their shape and remain crisp. For dashboards, reports, and any chart viewed digitally or scaled down, a neutral sans-serif such as Helvetica, Arial, or a geometric equivalent keeps the focus on the data and supports a professional, contemporary appearance.
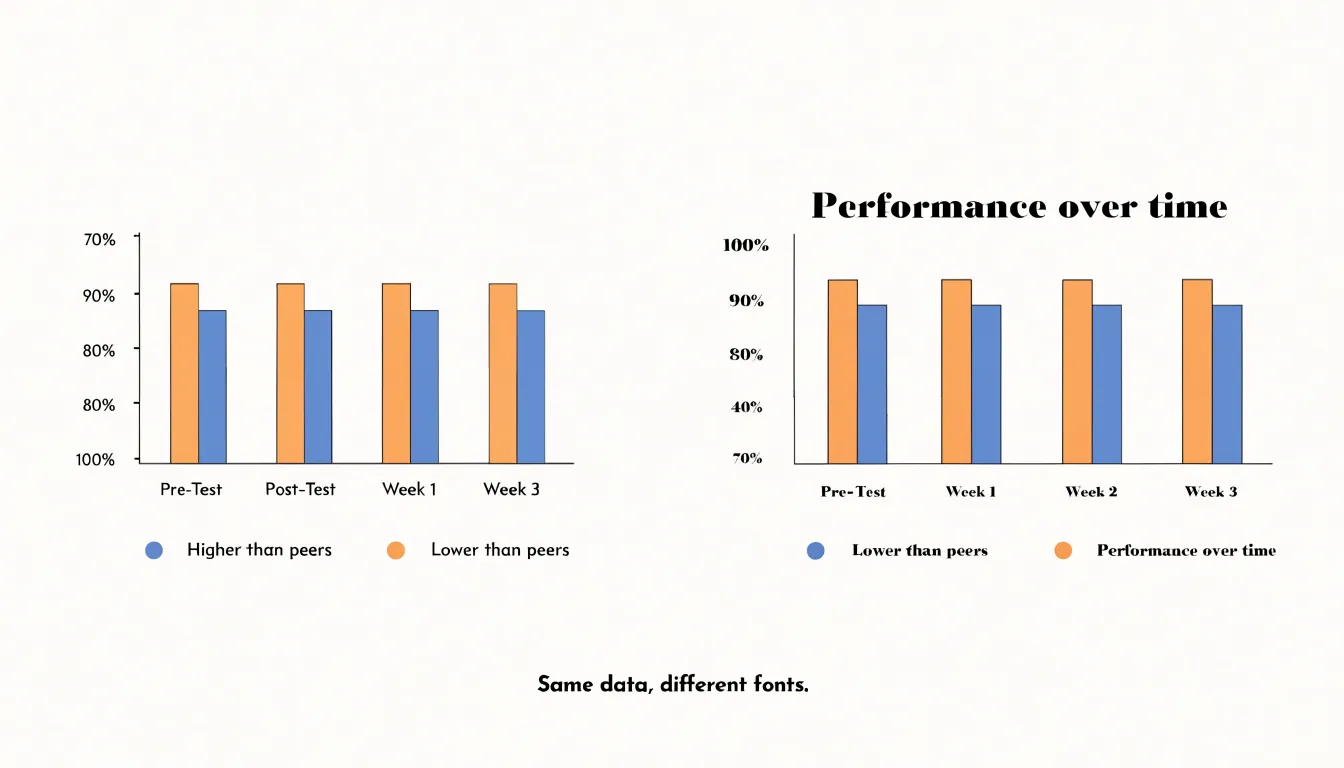
Serif typefaces carry a more traditional, editorial tone, and in the right context they reinforce credibility and formality. In printed annual reports, academic publications, or long-form documents where the surrounding body text uses a serif font, matching the chart labels to that same family creates a cohesive visual identity. Serif fonts also aid reading when chart text appears at larger sizes, such as headline figures or annotations set within a narrative layout. The serifs guide the eye along a line of text, which can help with longer labels or descriptive callouts.
The practical decision rests on context: match the chart’s type to the publication it lives in, keep the family consistent across titles, labels, and annotations, and favor whichever option maintains clarity at the smallest size the chart will display. Two families at most, used deliberately, keep the visual system coherent and the data readable.
Legibility
A typeface that reads comfortably in print may fall apart at small sizes or on low-resolution displays, where individual pixels have to represent the fine details of every letterform. The most reliable way to keep labels, axes, and data callouts readable is to choose fonts with a high x-height, meaning the lowercase letters occupy a generous proportion of the overall character height. This larger lowercase body gives each character more pixel area to work with, so letters remain distinguishable even when rendered at ten or twelve pixels tall.
Alongside x-height, open counters matter just as much. Counters are the enclosed or partially enclosed spaces inside letters like e, a, o, and p. When those spaces are tight, they tend to fill in at low resolutions, and letters such as e and c or o and a begin to blur together. Fonts with wide, open counters preserve those interior gaps, so each character keeps its own silhouette. This is particularly important for numerals, since chart values depend on quick, accurate reading of digits, and for small caps or condensed styles used in axis ticks.
High x-height and open counters together produce letterforms that stay sharp when anti-aliasing is imperfect, when screens are viewed at odd angles, or when charts are embedded in dashboards and mobile interfaces. Testing candidate typefaces at their actual display size, on the actual target screens, remains the surest way to confirm that a font holds up. Choosing a legible typeface early saves viewers from squinting, misreading values, and abandoning the chart altogether.
Visual Hierarchy
Visual hierarchy is the deliberate arrangement of typographic elements to create a clear order of importance, guiding the reader’s eye from the most critical information to the supporting details. By manipulating scale, weight, and position, you can establish distinct visual tiers that communicate priority without additional explanation.
Scale is the most direct tool for creating hierarchy. Larger text naturally draws attention first, so reserve the largest font sizes for the chart’s title or the single most important data point—such as a headline figure or a key trend. Secondary information, like axis labels or category names, should be noticeably smaller, while tertiary details, such as source notes or footnotes, can be smaller still. This graduated scale allows readers to absorb the main message at a glance and then progressively engage with finer details.
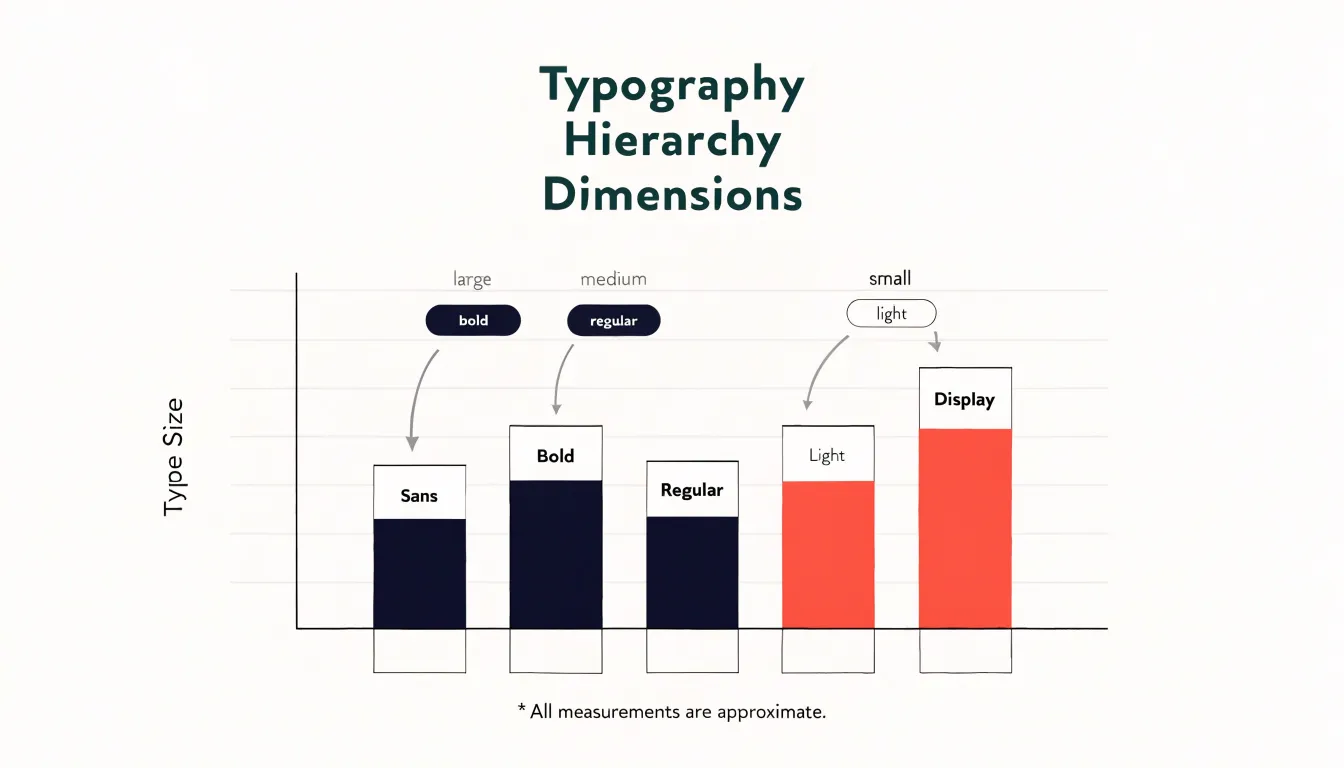
Weight adds another dimension. Bold or semibold text carries more visual weight and signals importance, making it ideal for highlighting critical numbers or labels. Regular weights work well for supporting text, while light weights can recede into the background for less critical elements. Combining scale and weight—for example, a large bold headline paired with smaller regular labels—creates a strong contrast that reinforces the hierarchy.
Position also plays a crucial role. Elements placed at the top or center of the chart are typically seen first, so position key insights there. Group related information together and use alignment to create clear pathways for the eye. White space around important elements can further elevate their prominence by isolating them from surrounding content.
Titles and Subtitles
Titles and subtitles serve as the entry point for any chart, offering readers an immediate grasp of the visual’s purpose. A well-crafted title acts as a descriptive anchor, succinctly stating what the chart displays. It should be specific enough to convey the subject matter without requiring the reader to scrutinize the axes or legend. For instance, instead of a generic “Sales by Region,” a title like “Monthly Sales Revenue by Region, 2023” provides clarity about the metric, dimension, and timeframe. This specificity helps readers quickly orient themselves and decide whether the chart is relevant to their interests.
Subtitles complement the title by providing explanatory context that guides interpretation. They can highlight key trends, call out notable data points, or explain the methodology behind the visualization. A subtitle such as “Northeast leads with 25% growth, while Midwest lags” directs attention to the most significant findings and shapes the narrative. This layer of explanation is especially valuable when the chart is part of a larger report or presentation, as it ensures the visual stands alone and communicates its message even without accompanying text.
Together, titles and subtitles lead the reader from the general to the specific: the title establishes the topic, while the subtitle adds depth and interpretation. Effective titles and subtitles also enhance accessibility by providing textual alternatives for readers who rely on screen readers or skim content quickly.
Axis Labels
Tick marks and scale labels sit at the edge of the plotting area to anchor every data mark to a value. When they are sized and oriented well, the reader’s eye flows from a bar or line to the axis and back again without interruption. When they are cramped or rotated awkwardly, the same reader stalls, tilts their head, and loses the thread of the chart.
Sizing starts with the relationship between label text and the chart’s overall scale. Tick labels must be legible at the actual viewing size, which often means slightly smaller than body text but never so small that digits blur together. Horizontal labels along the y axis usually need no rotation, and giving them a consistent right alignment close to the axis keeps the eye moving in a straight line. On the x axis, short labels such as years or single words can stay horizontal. Longer category names tempt designers to rotate text, yet steep angles slow reading considerably. A better first response is to shorten labels, thin the number of ticks, or give the axis more room before resorting to vertical text.
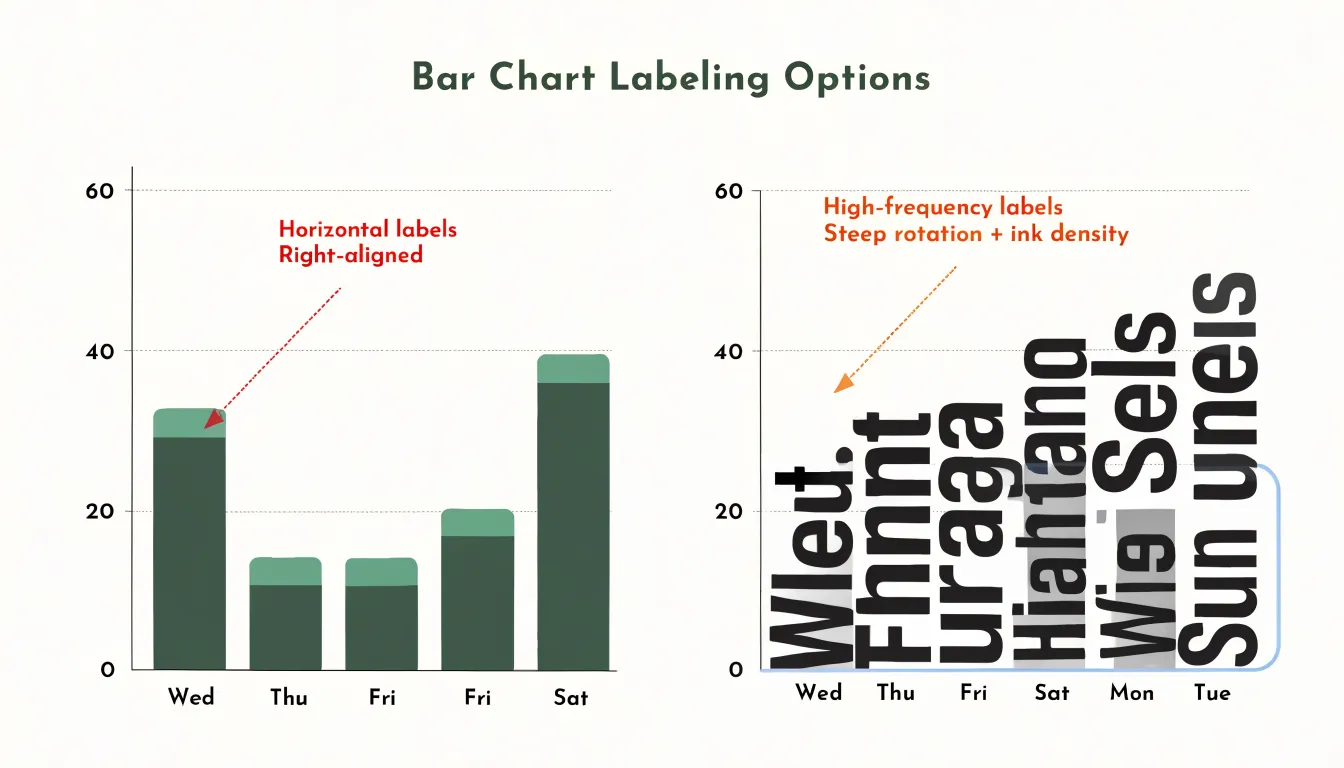
Orientation also affects crowding. Diagonal or vertical labels create dense pockets of ink near the axis that compete with the data itself. When rotation is unavoidable, a moderate angle such as 45 degrees reads more naturally than a full 90 degrees. Consistent spacing between ticks prevents labels from colliding, and omitting redundant tick marks reduces noise without losing precision. The aim throughout is a clean baseline that orients the reader instantly, so attention returns to the data rather than lingering on the mechanics of the axis.
Data Labels
Data labels carry the specific numbers behind your chart, and their placement determines whether readers absorb those values effortlessly or give up in frustration. Start with position relative to the data mark itself:
- Vertical bars: Place labels just above the top edge with a small, consistent gap.
- Horizontal bars: Set them at the end of each bar aligned to the outer edge.
- Line charts: Position labels above the point at its peak or endpoint, offset slightly so the text never overlaps the line stroke.
- Scatter plots: Place labels to the right of the marker, with a consistent offset that keeps text from colliding with neighboring points.
When space is tight in bar charts, consider placing labels inside the bar end in a contrasting color, though this requires careful attention to legibility against the fill.
Selective labeling keeps the chart readable. Label only the data points that carry the story: the highest and lowest values, the most recent period, targets, or outliers that break the pattern. When a series has many points, labeling every one creates a wall of numbers that competes with the visual shape of the data. A good rule is to let the axis carry the general scale while labels call out the exceptions and highlights. For dense charts, consider labeling only the first and last points of each series, then let the reader trace the intermediate values against the gridlines.
Alignment and formatting reinforce clarity. Right-align numbers above bars so decimal points line up, use tabular figures so digits occupy equal width, and drop trailing zeros to shorten labels. Keep label size a step or two smaller than the chart title, and choose a color with enough contrast against the background. A consistent offset, a limited set of labels, and tidy number formatting together keep the graphic clean while the important values remain easy to find.
Legends and Footnotes
Legends and footnotes offer essential context without competing for the viewer’s attention, and their placement and styling determine whether they support the visual hierarchy or disrupt it. A legend should sit close enough to the data it explains to be easily referenced, yet far enough to avoid cluttering the plot area. Common positions include the top-left or top-right corners, just outside the plotting region, or directly below the chart title. When multiple series are present, aligning legend entries horizontally along the top edge keeps them accessible without intruding on the data space. For charts with a single data series, a legend may be redundant; the title and axis labels often suffice.
Footnotes, including source notes and methodology explanations, belong at the bottom of the chart, typically in a smaller type size and a lighter weight. This placement follows the natural reading order and keeps supplementary details from interrupting the primary message. Use a typeface that matches the chart’s overall style at a reduced scale—perhaps 8 to 10 points for footnotes compared to 12 to 14 for axis labels. Color should be a muted gray or a low-contrast tint of the main text color, ensuring the notes recede while remaining legible. Avoid placing footnotes in the middle of the chart or alongside data points, as this creates visual noise. Instead, reserve the margins for supporting text. When space is tight, consider using numbered markers in the chart area that correspond to footnotes below, but use this technique sparingly.
Proportional Sizing
Proportional sizing ensures chart annotations remain legible whether the chart appears on a desktop monitor, a mobile screen, or a printed report. The foundation is a responsive font ratio: define a base size for the chart’s text and scale it according to the output medium and viewing distance. For screen-based charts, a common approach is to set the base annotation size in rem units and adjust it with media queries. A typical ratio might start at 1rem for desktop, increase to 1.125rem for tablet, and hold at 1rem for mobile—though on smaller screens, the ratio may need to rise to 1.25rem to compensate for reduced viewing distance and pixel density. Calculate these ratios relative to the chart’s container width rather than the viewport, so annotations scale with the graphic itself.
For print, the medium demands different constraints. Printed charts are viewed at arm’s length (roughly 30–40 cm) and at a fixed resolution (typically 300 DPI), so minimum point sizes become critical. As a rule, chart annotations should never fall below 7pt for footnotes or source lines, 8pt for axis labels, and 9pt for data labels and titles. These minimums ensure readability when the chart is reproduced at a reduced size or viewed by someone with less-than-perfect vision. To bridge screen and print, calculate a conversion factor: 1pt equals 1.333px at 96 DPI, so a 9pt print label corresponds to 12px on screen. Defining a proportional scale that respects these minimums across media guarantees that annotations remain fully legible from a smartphone to a printed annual report.
Font Weight
Font weight operates independently of size and color to create emphasis. Within a chart, the numbers themselves deserve the most attention, so setting key metrics in a bold or semibold cut helps them register instantly, even before the viewer reads the axis labels or legend. This works best when the contrast is deliberate: one or two highlighted figures per chart, rather than a whole row of heavy type competing for attention.
Grid lines and secondary annotations belong to the supporting layer of information. Rendering them in a regular or light weight keeps them present but quiet, so a light-weight grid sits behind the data and provides reference points without drawing the eye away from the plotted values. Similarly, using a lighter weight for axis labels and captions than for primary data labels reinforces the hierarchy established through placement and size.
Weight changes should feel like a natural step down from the most important element to the least. If the headline figure is bold, the supporting numbers might be regular, and the grid and tick labels light. Watch the ratio between weights as well. Too large a jump, such as heavy against thin, can make clean charts look busy and dense charts look chaotic. A moderate contrast, such as semibold against regular, usually communicates emphasis while keeping the chart calm. When charts sit alongside body text in a report, matching the weights of the surrounding typography also helps the chart feel integrated rather than pasted in from another visual system.
Color Contrast
Treating color contrast as an accessibility requirement rather than an aesthetic preference keeps every reader on equal footing. The Web Content Accessibility Guidelines (WCAG) define measurable contrast ratios between text and its background: WCAG AA asks for a ratio of at least 4.5:1 for normal-sized body text, while large text can pass at 3:1. Axis labels, data labels, legends, and annotations all count as text and deserve the same scrutiny as body copy.
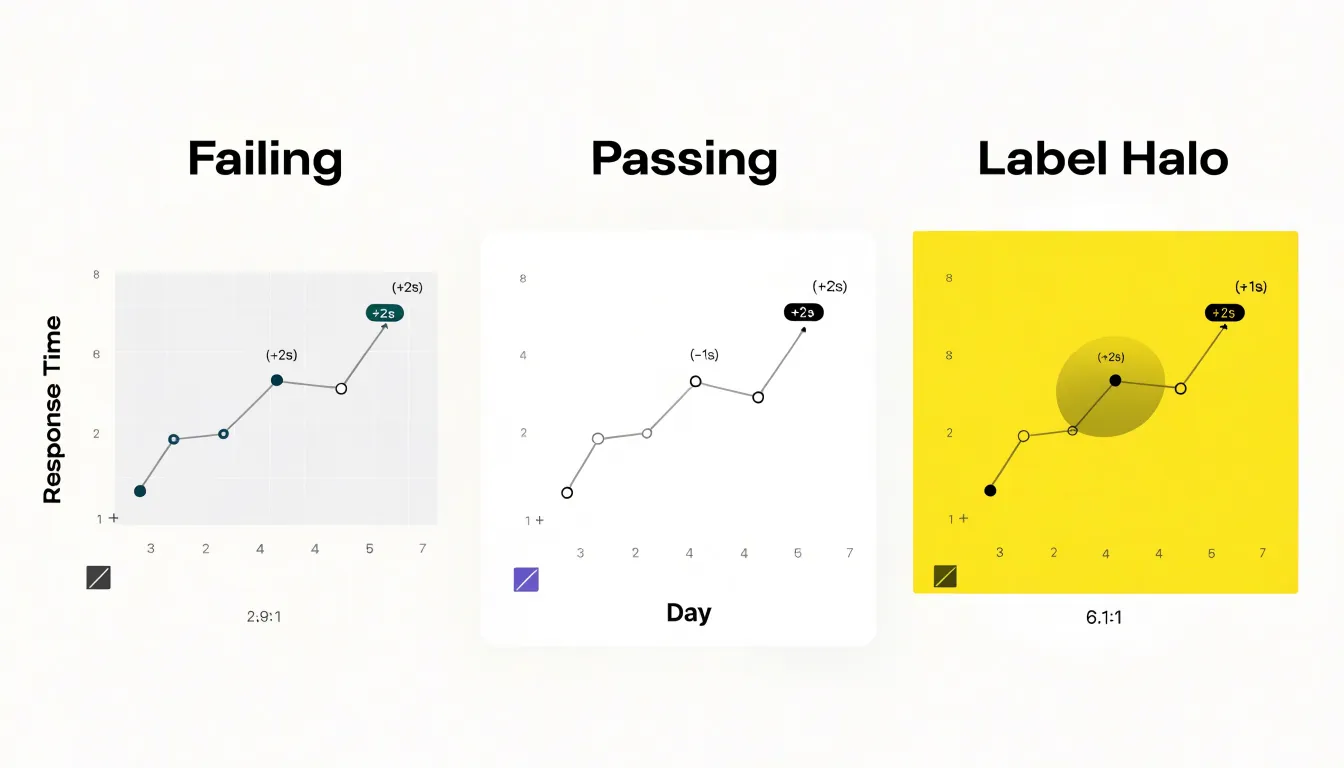
In practice, this means checking each text color against the specific fill behind it, because a label that sits on a pale grid band may fail even when the same color works over white. Charts complicate this further since text often overlaps multiple backgrounds, such as plotted shapes, shaded regions, or colored tiles. Where a label must sit on an unpredictable surface, a solid plate, halo, or subtle outline can restore reliable contrast. Automated tools and browser inspectors make ratio testing quick, and sampling colors during design review catches problems before publication.
Readers with low vision, cataracts, or color vision deficiencies rely on strong luminance differences rather than hue alone, so contrast serves them directly. Pairing text with backgrounds that separate clearly in lightness also keeps labels readable when a chart is printed in grayscale or viewed on a dim screen. Building contrast checks into the chart style guide turns accessibility into a repeatable habit.
Avoiding Clutter
Every font you introduce into a chart carries its own weight, texture, and rhythm, and each addition competes for the viewer’s attention. A strict maximum of two font families gives you enough flexibility to build hierarchy while keeping the overall composition unified. In practice this usually means one family for titles, labels, and annotations, with an optional second family reserved for a distinct role such as a display heading or a monospaced data table. The constraint forces decisions about which elements truly need to stand apart and which can be distinguished through size, weight, or color instead.
Clutter accumulates quietly. A chart might begin with a single sans-serif, then add a serif for the headline, a condensed face for axis labels, and a script accent for a callout. Individually each choice may seem reasonable, yet together they produce visual noise that makes the underlying data harder to read. Limiting the palette of typefaces removes that friction and lets the numbers carry the message.
Two families also simplify the practical work of building and maintaining charts. Fewer fonts mean fewer licensing questions, fewer loading issues across platforms, and more consistent rendering when charts are exported or embedded. A designer returning to the file months later can apply the same pairing without guesswork, and across a report or dashboard, the shared typographic system creates continuity. The two-family maximum is a ceiling; using a single well-chosen family throughout is often the strongest choice. Reserve the second family for cases where the contrast genuinely serves the content.
Kerning and Letter Spacing
Kerning and letter spacing matter most where type is smallest or most prominent. Kerning refers to the space between individual letter pairs, while tracking, or letter spacing, applies a uniform adjustment across an entire string of text. Both tools let you tune how a label reads at its actual display size and weight.
All-caps titles deserve particular attention. Uppercase letterforms tend to occupy similar rectangular shapes, which means combinations like “AV,” “LT,” or “TY” can either crowd together or drift apart depending on the typeface’s default spacing. Slightly increased tracking across an all-caps chart title often opens up the wording and gives it a confident, airy presence, while selective kerning fixes stubborn pairs that look too tight. Without these tweaks, a headline can read as a dense block of letterforms rather than a clear statement.
Small axis text presents the opposite challenge. At tiny sizes, letters can blur together, so a touch of extra tracking helps numbers and category labels stay legible, especially in light weights or on low-resolution displays. Tick labels along one axis should share the same spacing so the reader’s eye glides along the scale without stumbling. Overdone spacing can make short labels look disconnected, so the adjustment should feel generous but restrained. Inspect the title and axis labels at their final rendering size and nudge the tracking until the text reads cleanly.
Alignment and Position
When data labels follow a consistent alignment rule, the eye can move through the chart without stopping to decode each element. Long category labels read most comfortably when left-aligned against the axis or the edge of the plot area. A shared left edge gives readers a stable starting point for every label, so the eye can skim down the list and compare word shapes and lengths at a glance. Centering long labels, by contrast, produces a ragged left edge that forces the eye to hunt for the beginning of each entry, and the resulting zigzag slows scanning considerably.
Numerical values follow a different logic. Right-aligning numbers lines up the ones digit, the decimal point, and the magnitude of each figure along a single vertical edge. This makes differences in value immediately visible: a column of right-aligned figures lets a reader see at once which numbers are larger, where digits carry over into new places, and how values cluster. Left-aligned numbers break this correspondence, because the digits that determine magnitude end up scattered across the column.
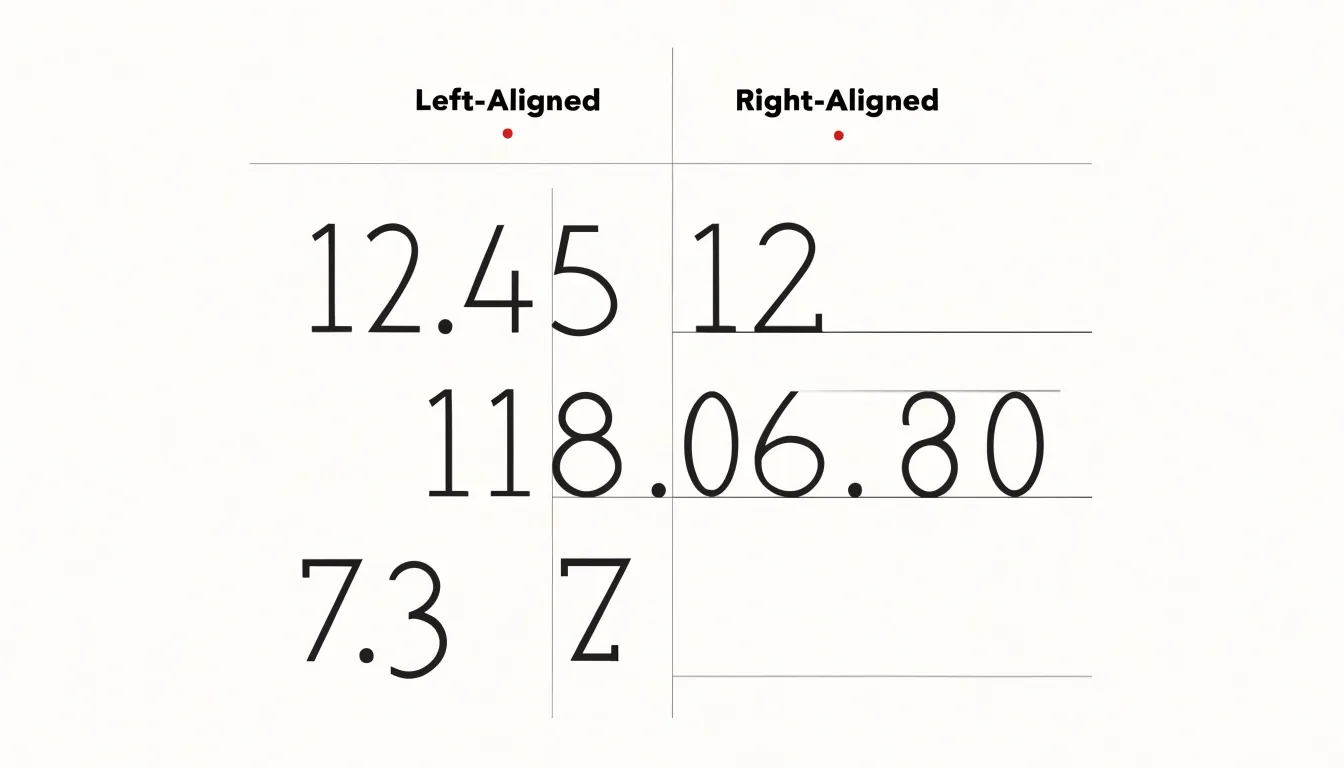
Consistency matters as much as the direction chosen. Every label in a group should share the same alignment, the same gap from the axis or bar, and the same relationship to its data mark. Labels placed at a uniform distance from their marks, whether inside or outside a bar, read as a single system rather than a collection of individual annotations. Keeping labels close to the data they describe, and away from unrelated elements, further reduces the work of matching text to mark.
Numbers and Numerals
When a chart presents columns of multi-digit numbers, the eye needs to scan vertically to compare magnitudes. Tabular figures, also called monospaced figures, give every digit the same advance width, so a column of values settles into clean vertical stacks. Proportionally spaced figures let a narrow 1 occupy less room than a wide 8, which produces ragged right edges and makes the decimal points drift from row to row. In tables and data labels where readers compare 12.45 against 118.06, that drift slows recognition and invites misreading.
Most professional type families ship with a tabular figure option, often activated through OpenType features such as tnum, and many charting libraries expose a setting for monospaced numerals in axis labels and data tables. With tabular figures enabled, decimal points form a continuous vertical line, digit columns sit directly above one another, and the reader can compare hundreds against thousands at a glance. This matters most in dense tables, annotated bar charts, and financial or scientific displays where precision is the point.
Ensure the font’s tabular figures also have consistent height and baseline so rows stay even. Pair tabular figures with a left or right alignment chosen to match the decimal structure of the data, and test with the longest and shortest values in the set to confirm the column holds. Where the display is small or the numbers are short, proportional figures may still be acceptable, yet any repeated comparison across rows benefits from the even rhythm tabular numerals provide.
Common Mistakes
- Rotated text: When long category labels are set vertically or at steep angles, readers must tilt their heads or mentally rotate letterforms. Instead, shorten labels to their essential words, wrap text across two lines, swap the chart to a horizontal bar layout so labels read left to right, or increase the chart’s height. When rotation is unavoidable, keep the angle consistent across the entire chart so readers learn the pattern once.
- Overly decorative fonts: Script typefaces, condensed display faces, and novelty fonts drawn for headlines lack clarity at small sizes. Characters such as 1, 7, and I can blur together, and curved forms lose definition when rendered a few points tall. Reserve display or brand fonts for chart titles and switch all tick labels, data labels, and legends to a clean sans-serif with open counters and generous spacing, such as a neutral grotesque designed for interface work.
- Inconsistent sizing: Mixing three or four label sizes, or rendering numbers in a different size from their accompanying words, forces readers to decide which text matters most on every reading. Establish a small type scale—typically one size for titles, one for subtitles and axis labels, and one for annotations and footnotes—and apply it uniformly across every chart in a report. Confirm that size changes always signal an actual change in hierarchy rather than arbitrary variation.
Frequently Asked Questions
What font family should I use for charts and dashboards?
For dashboards, reports, and charts viewed digitally or scaled down, use a neutral sans-serif such as Helvetica, Arial, or a geometric equivalent; serif fonts can suit printed annual reports, academic publications, or long-form documents when matching surrounding body text. Match the chart’s type to the publication, keep the family consistent across titles, labels, and annotations, and use two families at most.
What makes chart labels legible at small sizes?
Choose fonts with a high x-height and wide, open counters so letters and numerals remain distinguishable at small sizes and low resolutions. Test candidate typefaces at their actual display size on the actual target screens to confirm legibility.
What should a chart title and subtitle include?
A title should specifically state what the chart displays, without requiring readers to scrutinize the axes or legend, while a subtitle provides explanatory context, key trends, notable data points, or methodology. Together they lead from the general to the specific and can provide textual alternatives for screen readers.
How should I position axis labels and data labels?
For axis labels, keep tick labels legible at the actual viewing size, right-align y-axis labels close to the axis, and try shortening labels, thinning ticks, or giving the axis more room before rotating text. For data labels, place vertical-bar labels just above the top edge, horizontal-bar labels at the end aligned to the outer edge, and line-chart labels above the peak or endpoint offset so they do not overlap the line stroke.
Where should legends and footnotes go on a chart?
Place a legend close enough to the data to be easily referenced but outside the plotting area, such as top-left or top-right corners or directly below the chart title; for a single data series, a legend may be redundant. Put footnotes, source notes, and methodology explanations at the bottom of the chart in a smaller type size and lighter weight, not in the middle of the chart or alongside data points.
What minimum font sizes and contrast ratios should chart text meet?
For print, chart annotations should never fall below 7pt for footnotes or source lines, 8pt for axis labels, and 9pt for data labels and titles; 1pt equals 1.333px at 96 DPI. For color contrast, WCAG AA asks for at least 4.5:1 for normal-sized body text and 3:1 for large text, and axis labels, data labels, legends, and annotations all count as text.
Tony Astor
Tony writes about data visualization and the tools people use to build charts and dashboards. More about Data Illustrator