Treemap vs Sunburst Chart: Showing Hierarchies
 By Tony Astor ·
Treemap vs Sunburst Chart
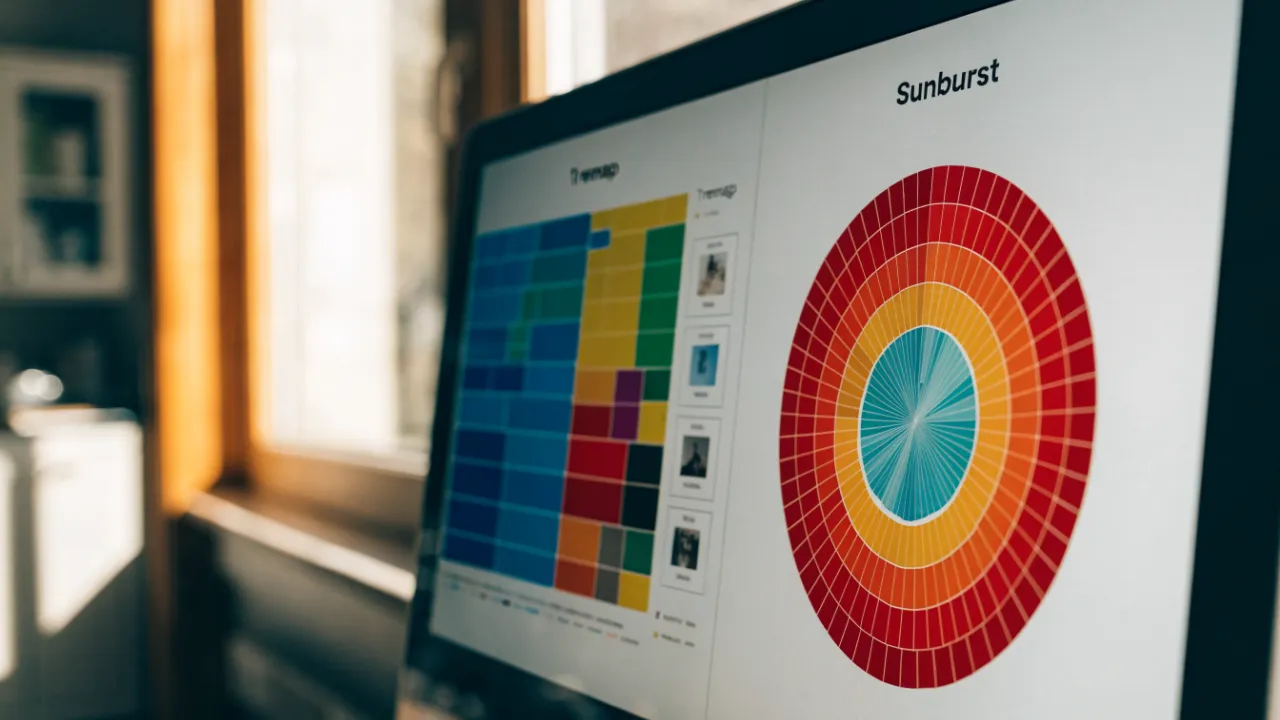
A treemap shows hierarchical data as nested rectangles whose area is proportional to each node’s value, making it best for precise size comparison across many items. A sunburst chart uses concentric rings, with angular width encoding value and radial depth encoding hierarchy level, making it better for tracing parent-child paths and emphasizing structural depth.
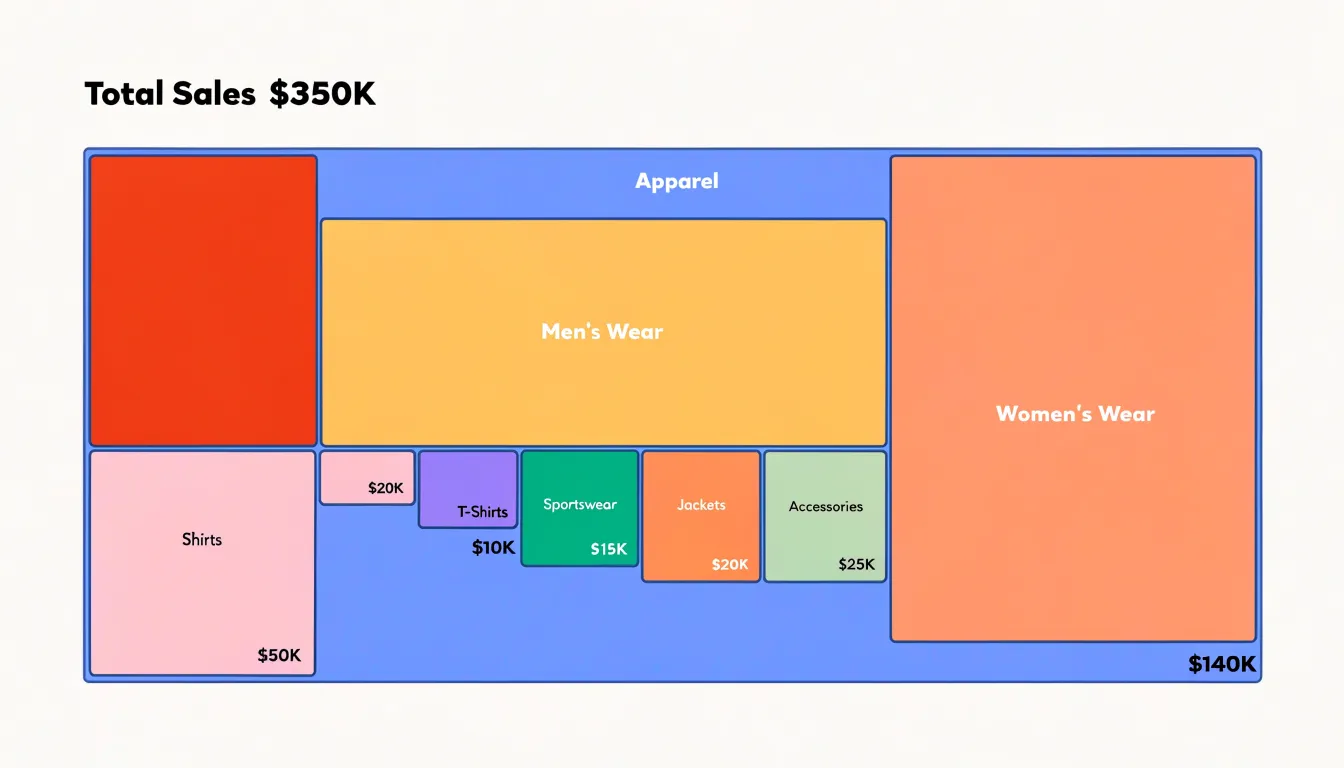
Table of Contents
Treemap
A treemap represents hierarchical data as a set of nested rectangles, where each rectangle corresponds to a node in the underlying hierarchy and its surface area is proportional to a quantitative value assigned to that node. The overall canvas is divided among the top-level categories, and each of those regions is subdivided again among its children, producing a layout in which the largest values occupy the most visual space at every level of the tree. Because size maps directly to quantity, readers can gauge relative magnitude at a glance, identifying which branches dominate the dataset and which are comparatively minor without consulting labels or numeric tables.
This partitioning logic makes treemaps especially effective for comparing proportions across different branches of the hierarchy. A viewer can scan the top-level rectangles to see how the total is distributed among major groups, then move inward to examine how each group’s share is divided among its own subcategories. This supports side-by-side comparison at multiple levels simultaneously: two sibling categories can be compared within their parent, and that parent’s aggregate footprint can be compared against other parents on the same canvas. The result is a compact overview that preserves the part-to-whole relationship at every depth.
Rectangular packing also makes efficient use of space, allowing hundreds or thousands of leaf nodes to appear on a single screen while remaining individually selectable. Color is typically reserved for a second variable or for categorical identity, while area carries the quantitative burden, so the visual grammar stays consistent as users drill into deeper levels.
Sunburst
The sunburst chart arranges hierarchical data as a series of concentric rings, with the radial structure directly encoding the depth of each category. At the center, the innermost ring holds the top-level parents: the broadest categories in the dataset, such as a product division or a geographic region. Each parent segment then radiates outward into the next ring, where its immediate subcategories appear, and those subcategories in turn generate outer rings for further breakdowns. Reading the chart from the middle outward therefore mirrors the way a hierarchy branches from general to specific.
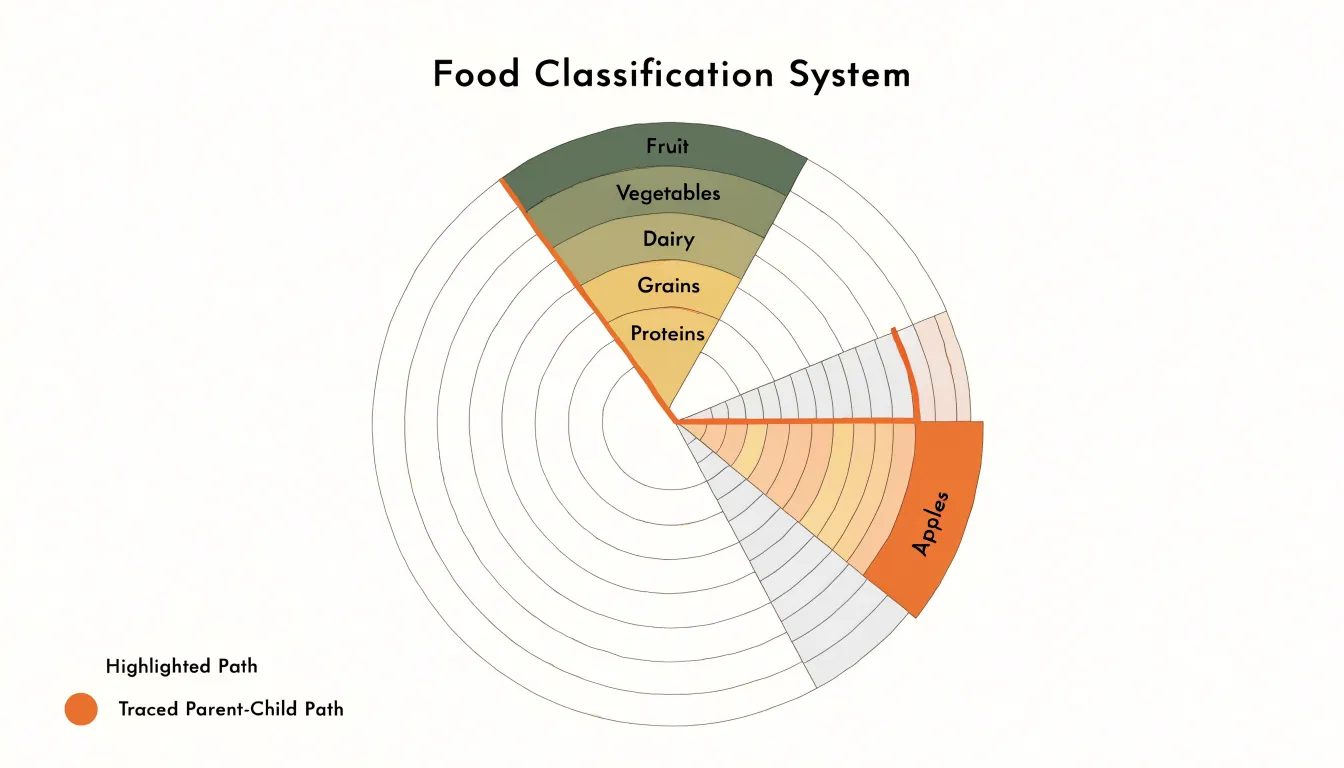
This concentric layout allows readers to trace any individual path through the data as a continuous radial slice. A segment in the innermost ring can be followed outward through its children, grandchildren, and deeper descendants, so the full chain of containment for a given item appears along a single line from the center to the rim. That radial continuity makes parent-child relationships immediately visible, and it lets viewers perceive how many levels of detail a branch contains simply by noting how many rings its slice spans.
Segment sizes remain governed by the same proportional rule as in a treemap: the angular width allocated to each item reflects its share of the whole, so a parent’s total is divided among its children as the slice moves outward. The circular format also gives the chart a compact, radially symmetric footprint, which can suit presentations where the hierarchy itself is the primary story. With sufficient ring spacing, labels can be placed along each arc, and color can reinforce categorical identity across the various levels of depth.
Space Efficiency
Treemaps and sunburst charts handle the geometry of a display area in fundamentally different ways. A treemap divides a rectangular canvas into nested rectangles sized in proportion to a value such as file size, revenue, or population. Because rectangles can tile a plane completely, the chart fills its container edge to edge, including the corners and margins. Every pixel of the canvas carries information, and the only leftover space is the small gap used to separate parent and child nodes visually. When the display area is fixed, such as a dashboard panel or a report page, this tiling property lets a treemap pack a large number of items into the available room without wasting any of it.
A sunburst chart’s outer boundary, by contrast, is a circle. A circle inscribed in a rectangular canvas necessarily leaves empty regions in all four corners, and often along the sides as well. The larger the outer radius needs to be to accommodate deep hierarchies, the more noticeable these unused corner areas become. Because the circular shape cannot tessellate with the canvas, a meaningful share of the screen remains blank.
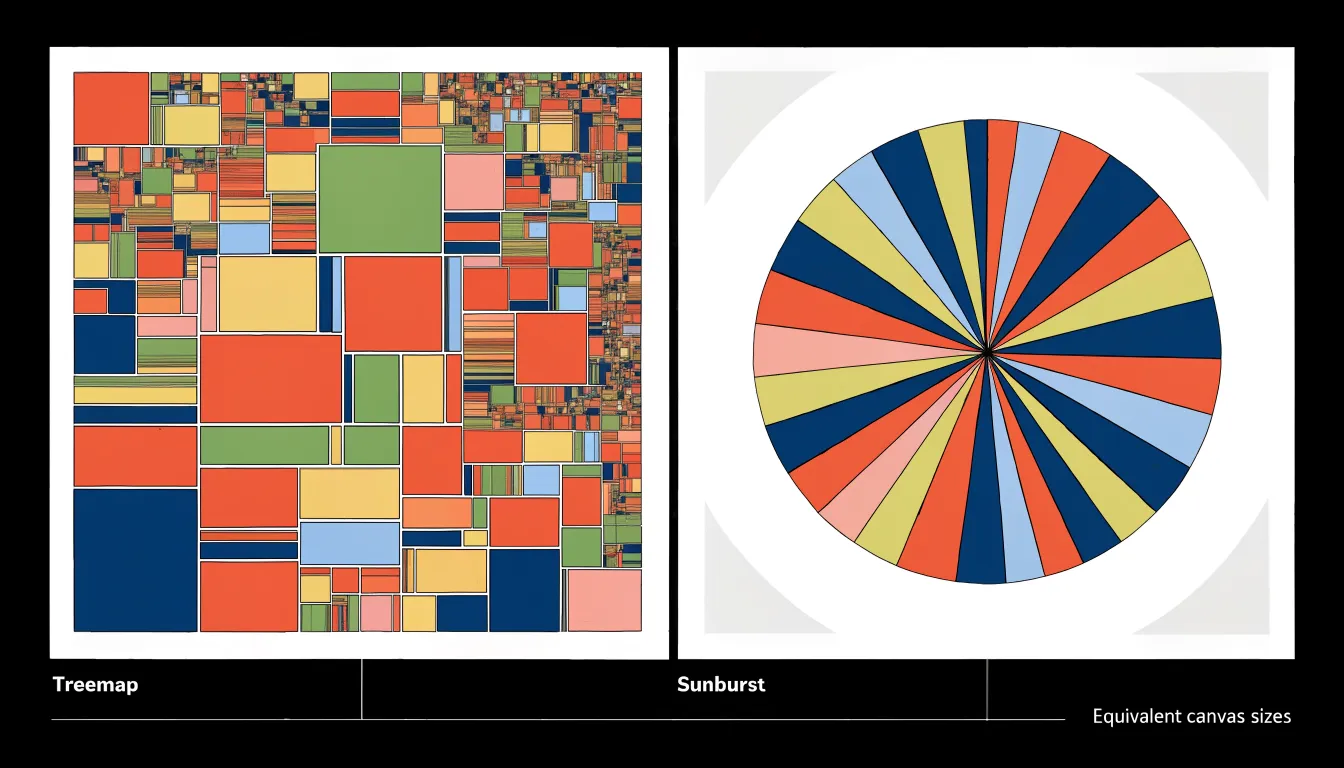
In practice, space efficiency matters most when many categories compete for a compact view, as in disk usage analyzers or portfolio overviews. The treemap’s rectangular fill allows dense, information-rich displays at modest sizes, while the sunburst’s circular footprint sets a practical limit on how much content can be shown within the same area.
Reading Nested Levels
Reading nested levels in treemaps and sunburst charts requires distinct visual strategies. In a treemap, users follow the borders of nested boxes inward, moving from the outer boundary of a parent rectangle to the inner boundaries of its children. This border-based reading relies on the eye’s sensitivity to edges and alignment; the thickness and color of borders can further reinforce the nesting. As users move deeper, the rectangles shrink, and the challenge shifts to maintaining context—remembering which parent a small box belongs to.
To read nested levels in a sunburst chart, users scan outward from the center, following radial wedges across concentric rings. The further out a ring sits, the deeper the level. This outward scanning demands attention to angular position and arc length, as sibling categories are distinguished by their angular span. Users must also track how a slice in one ring aligns with slices in adjacent rings to understand parent-child relationships.
Both layouts require users to mentally reconstruct the hierarchy, but treemaps emphasize containment and border-following, while sunbursts emphasize radial continuity and outward scanning. The choice between them often depends on which reading strategy aligns better with the data and the user’s task.
Strengths Comparison
Rectangular treemap layouts excel when the primary goal is precise comparison of sizes across many items. Because rectangles align to a common grid, viewers can quickly judge relative magnitudes with minimal perceptual error. This makes treemaps ideal for part-to-whole analysis where ranking or spotting outliers matters, such as budget allocation across departments or file sizes on a disk. The rectangular form also supports direct labeling within each cell. When the hierarchy is broad and shallow, treemaps keep all nodes visible at once, enabling fast scanning of the largest contributors.
Radial layouts shine when the story is about sequence and hierarchical depth. The circular arrangement naturally suggests a progression around the center, making sunburst charts effective for showing cyclical data like months in a year or stages in a process. The radial structure emphasizes the nesting of categories and the flow from parent to child, which is useful for exploring organizational structures or taxonomic trees. While radial layouts are less precise for comparing areas—especially across different rings—they excel at revealing patterns of distribution and the overall shape of the hierarchy. The circular form also accommodates a large number of leaf nodes around the perimeter without the cramped labeling issues of a rectangular grid. In essence, choose rectangles for analytical precision and radial rings for narrative flow and depth emphasis.
Large Datasets
Large datasets introduce a distinct set of readability challenges for hierarchical visualizations, particularly when trees grow both deep and broad. One foundational strategy is establishing aggregation thresholds: rather than rendering every node, the chart consolidates small or low-value children into a single “other” category once they fall below a defined size or count. This keeps the display legible while preserving the overall shape of the hierarchy, and thresholds can be tuned per level so that important branches remain fully visible even as peripheral categories get folded together.
Dynamic zooming provides a complementary approach, letting viewers move from an overview of the whole tree into focused subregions without losing context. Interactive drill-down allows a user to select a parent node and expand its children in place, progressively revealing detail on demand. Smooth transitions during zoom help maintain orientation, showing how the new view relates to the previous one and reducing the disorientation that abrupt view changes can cause in dense charts.
Breadcrumbs anchor this navigation by displaying the path from the root to the currently focused node. As users zoom deeper into a hierarchy, the breadcrumb trail records each step, offering a clear sense of location and a quick way to step back to any ancestor level. Combined with clear labeling, tooltips, and consistent color mapping, these mechanisms work together to manage visual clutter: aggregation thresholds control how much is drawn at once, dynamic zooming controls when detail appears, and breadcrumbs control where the viewer understands themselves to be.
Proportional Relationships
The choice between rectangular area and angular span matters because human perception handles area and angle with differing degrees of precision. When viewers look at rectangular areas, they can compare sizes by scanning edges, corners, and shared alignments. Rectangles side by side invite direct comparison along a common baseline, and research on graphical perception has shown that judgments of rectangular area tend to be reasonably reliable, particularly when the rectangles share a regular layout and viewers can anchor their estimates to clear reference edges.
Angular judgments operate differently. Comparing arc lengths around a circle requires the eye to estimate how far a segment sweeps around a curved path, a task that becomes harder as the number of segments grows and as the arcs move away from a common starting point. Studies of perception suggest that people estimate angles less accurately than they estimate lengths or aligned areas, and errors increase when many slices compete for attention.
In practice, this means a treemap often supports faster and more accurate reading of relative magnitudes, especially for values that are close in size. A sunburst chart’s reliance on angular extent places a higher burden on the viewer’s perceptual system. Designers weighing the two should consider how precisely their audience needs to compare values, how many items appear at each level, and whether the structure of the data favors an area-based or angle-based reading.
Color Coding
Because every rectangle in a treemap and every arc in a sunburst already encodes hierarchy through size and position, color can be layered on top as a second channel to communicate something the structure alone cannot express. The most direct use is categorical: assigning a distinct hue to each top-level branch so that viewers can track a category even when its subregions are scattered across different parts of the layout. In a sunburst this is especially natural, since the innermost ring defines the top-level branches and a consistent hue can follow those branches outward through every deeper ring.
A second application is performance. Once the eye has learned that hue represents category, saturation can carry intensity, letting darker or more vivid shades signal strong results and paler shades signal weak ones. This turns the chart into a heat map of sorts, where a viewer scans for clusters of color rather than reading individual labels. Sales figures, budget utilization, error rates, or conversion percentages can all be mapped onto a saturation ramp anchored to a neutral baseline.
A third use is temporal. Sequential periods can be shown with a graded palette, so that a treemap or sunburst built for one period can be compared against its neighbors through color drift rather than through redrawn geometry. A category whose tone shifts noticeably between snapshots signals movement worth investigating.
Whatever the mapping, the palette should stay legible against the chart background, use no more distinct hues than a viewer can reliably separate, and keep the same color logic consistent across every view.
Mobile Performance
Mobile performance testing for treemaps and sunburst charts begins with the constraints of the physical screen. On a phone, a chart that occupies the full width may still only span a few hundred pixels, which compresses labels quickly. Deep hierarchies in a treemap produce slices thin enough that text truncates or disappears entirely, and sunburst charts carry a similar risk around their outer rings, where arc segments become narrow wedges that cannot hold readable labels. Testing should confirm whether the chart offers zoom, drill-down, or progressive disclosure so users can reach detail without squinting at a static overview. Legibility also depends on contrast between adjacent segments; on a small display, subtle color differences that read well on a desktop monitor can collapse into a single visual mass.
Touch interaction adds its own requirements. Tap targets need to be large enough to hit reliably with a fingertip, commonly cited as around 44 by 44 pixels. Treemap tiles near the top of a hierarchy often exceed this, but nested rectangles in the lower levels frequently fall below it, making selection error-prone. Sunburst arcs shrink toward the outer edge and may be only a few pixels deep, so hover-based tooltips must translate into tap-driven states that persist long enough to read. Testing should check whether the chart responds to touch gestures such as pinch-to-zoom and whether accidental taps trigger unwanted drill-downs.
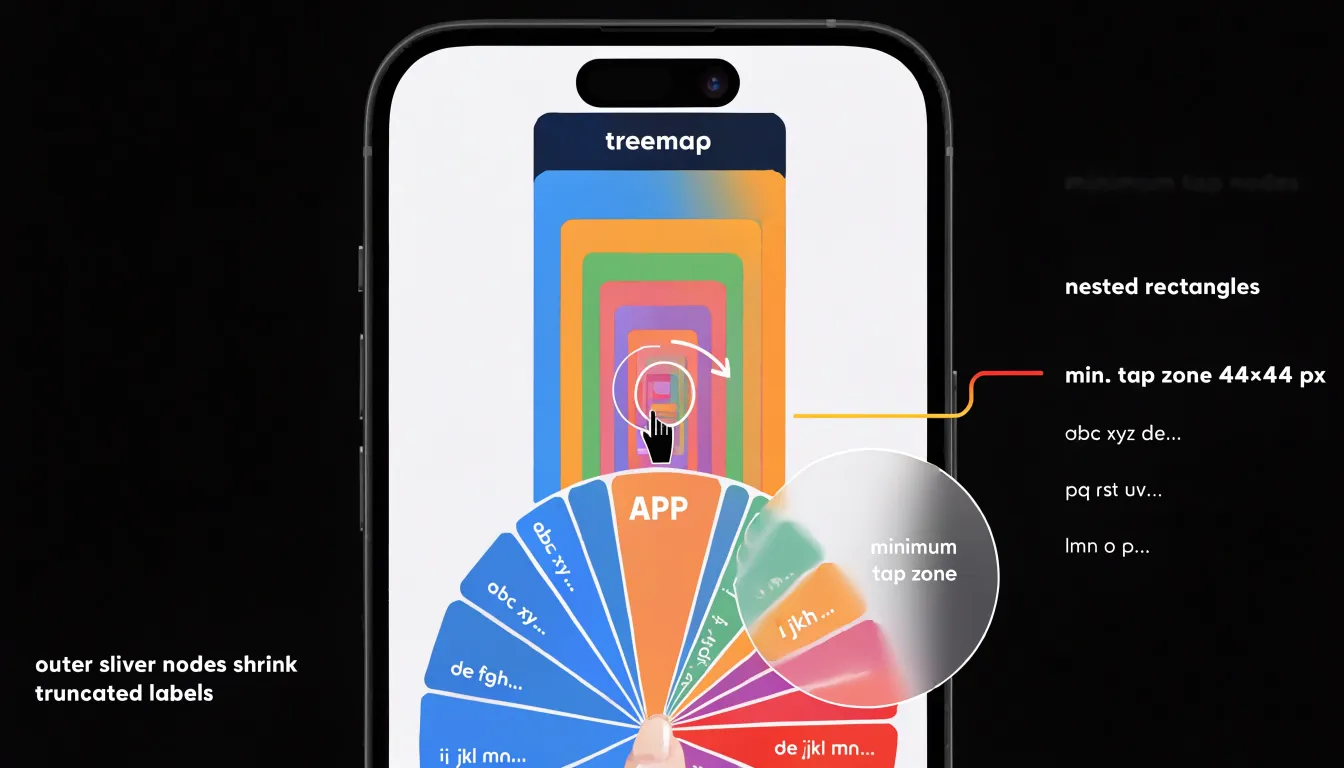
Responsiveness matters across portrait and landscape orientations and varying device widths. Charts should reflow or simplify at breakpoints rather than scale down uniformly. Checking load time and rendering smoothness on mid-range devices rounds out the evaluation, since heavy SVG structures with many nodes can stutter during panning. A practical test plan covers several representative screen sizes, verifies label readability at default zoom, measures tap accuracy on the smallest segments, and confirms that interaction feedback appears within a reasonable time.
Cognitive Load
Cognitive load refers to the mental effort a viewer expends while scanning, decoding, and comparing the elements of a visualization. A treemap’s grid-like structure aligns closely with reading habits and spatial intuition. Because rectangles share straight edges and right angles, the eye can follow a consistent top-left to bottom-right scanning path and compare sibling nodes along shared borders. Labels sit horizontally inside predictable shapes, which reduces the effort needed to locate and identify categories, and the overall hierarchy reads as a series of nested boxes that the mind can hold as a single coherent picture.
Reading a sunburst chart requires the viewer to track radial distance outward from the center while also following rotational position around each ring, combining two spatial dimensions at once. Segment areas grow with radius, so the same data value produces different shapes depending on depth, and the wedge shapes taper toward the center, compressing the finest detail into the smallest, hardest-to-inspect region of the chart. Labels often must be rotated, curved, or omitted for narrow slices, which raises the decoding effort further.
The practical consequence is that treemaps tend to demand less working memory during comparison tasks. A viewer can hold two rectangles side by side and judge their areas without mentally rotating or projecting them, while comparing two wedges across different rings requires estimating angular width and radius simultaneously. The sunburst layout carries a higher cognitive cost per segment, which pays off mainly when the radial structure itself is the story being told.
Practical Examples
In retail environments, product catalogs frequently run several levels deep, moving from broad departments through subcategories and product families down to individual SKUs. Treemap and sunburst visualizations give merchandising teams a way to see that entire hierarchy at once, with each segment sized to reflect a chosen metric such as inventory count, revenue, or margin. A consumer electronics retailer, for instance, might build a treemap where the largest blocks represent departments like computing or audio, and within each block the nested rectangles reveal which subcategories absorb the most shelf space. Buyers can immediately spot an oversized television accessory cluster or an underperforming smartphone case line without drilling through spreadsheets. Coloring the same rectangles by sell-through rate turns the display into a stock distribution map, highlighting categories that are overstocked relative to their sales pace. Merging size and color in this way lets planners compare catalog depth against actual demand across dozens of product lines in a single view, which supports decisions about rebalancing inventory before seasonal peaks.
Sunburst charts serve a similar purpose when the emphasis falls on structural relationships rather than raw area comparison. A grocery chain could use one to show how fresh produce breaks into fruit and vegetables, then into organic and conventional lines, and finally into individual items, with the angular width of each arc encoding sales volume. Category managers can follow a single ring outward to understand where sales concentrate and where a long tail of slow-moving items dilutes performance. Both chart types translate dense catalog data into a visual grammar that non-technical stakeholders can read quickly, whether the goal is trimming redundant SKUs, allocating promotional space, or reporting quarterly performance across product lines.
Interactive Features
Interactive features transform static hierarchical visualizations into exploratory tools that let users discover insights at their own pace. Hover interactions provide immediate context through tooltips, which display detailed values, percentages, and category labels without requiring any clicks. When a user moves the cursor across a treemap, each rectangle can respond by revealing its exact metrics, while a sunburst chart can highlight the corresponding arc and its ancestral path. Dynamic highlights extend this behavior by dimming unrelated branches, helping users trace relationships and maintain orientation within the hierarchy.
Click interactions introduce specific drill-down mechanics for each layout: in a treemap, clicking a parent rectangle can expand it to fill the canvas and reveal its children; in a sunburst, clicking an inner ring segment can rotate and zoom the chart so the selected branch becomes the new center. Animated scaling and rotation preserve spatial context during these transitions, allowing users to move between overview and detail repeatedly, compare sibling categories, and inspect outliers without losing their place. Designers should keep tooltips concise, ensure click targets are large enough for accurate selection, and tune animation durations so transitions feel responsive rather than sluggish, balancing visual polish with usability across devices.
Common Pitfalls
Hierarchy charts reward careful design and punish shortcuts. One of the most frequent mistakes is over-nesting: cramming five or six levels of hierarchy into a single view. Each additional level shrinks the available space for the leaves, so labels collide, small segments become invisible slivers, and readers lose the thread of the structure. A practical rule is to display only the levels that matter for the question at hand, using aggregation or drill-down interactions for deeper categories.
Poor color choices compound the problem. When adjacent segments share similar hues, boundaries blur and comparison becomes guesswork. Effective palettes use enough contrast between sibling categories while keeping the palette restrained, and they reserve strongly saturated or warm colors for highlights rather than painting every branch differently. Color should encode meaning, such as category membership or a measure like growth, instead of decorating the chart.
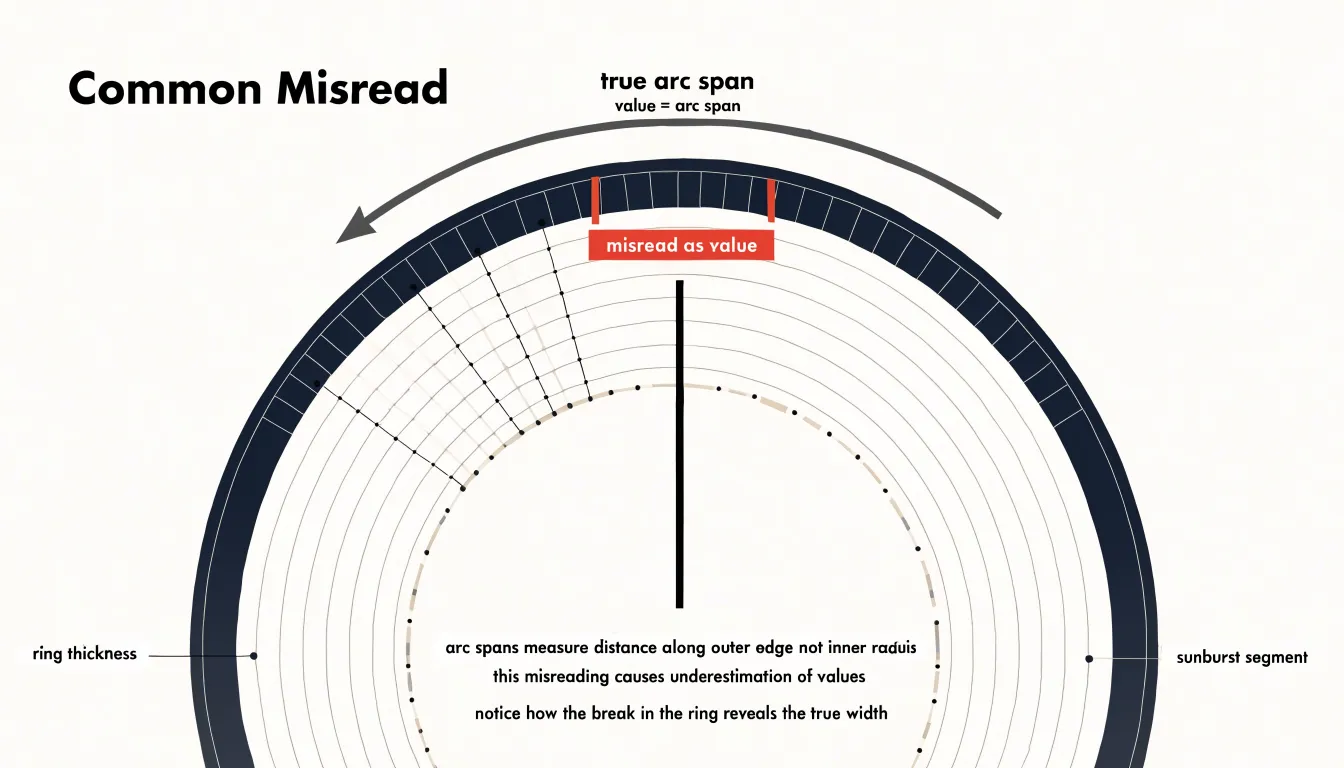
Misreading geometry is another common trap. In sunburst charts, arc length along the outer edge represents value, and people routinely compare the wrong dimension, judging by angle or by the apparent thickness of a ring rather than the span of the arc. In treemaps, area encodes value, yet viewers often estimate by width or height alone, which exaggerates elongated rectangles. These perceptual biases distort the insights the chart is meant to deliver. Designers can mitigate them by keeping aspect ratios reasonable, labeling key values directly, and choosing the chart type whose geometry matches the comparison readers will make. Testing the visualization with a colleague before publishing is a simple way to catch these errors while they are still easy to fix.
Accessibility
Accessibility determines whether a chart serves its entire potential audience, and hierarchical visualizations present specific challenges because their structure and proportions are conveyed largely through visual encoding. Keyboard navigation support forms the foundation of an accessible interactive chart. Users who cannot operate a mouse need to move focus between segments, drill into nested levels, and return to parent nodes using standard keys such as Tab, Enter, and the arrow keys. Each focused element should display a clear focus indicator and expose its label, value, and depth through programmatic properties so that assistive technology can announce the user’s position within the hierarchy.
High-contrast color palettes extend readability to users with low vision or color vision deficiencies. Rather than relying on hue alone to distinguish categories, designers can vary lightness and pair color with pattern, texture, or direct labels. Palette choices should meet recognized contrast ratios against backgrounds and adjacent segments, and testing under simulated color blindness conditions helps confirm that distinctions remain perceivable.
Screen reader descriptions give non-visual users an equivalent understanding of the data. A concise summary of the chart’s purpose, its total value, and its main branches provides essential context, while structured text alternatives can describe each segment’s name, size, and proportion. These descriptions work best when updated dynamically as users navigate the chart. Fallback data tables ensure that the complete dataset remains available when graphics cannot be rendered or interpreted. A well-formed table with sortable columns, proper headers, and captions preserves the hierarchy in a linear, navigable format that works with any assistive technology.
Final Choice
The final selection between a treemap and a sunburst chart rests on three practical considerations: the depth of your dataset, the goals of your users, and the constraints of your display environment. Begin with dataset depth. Shallow hierarchies with one or two levels of branching fit comfortably in a treemap, whereas the radial layout of a sunburst becomes more useful as the hierarchy grows deeper. If your data extends beyond four or five levels, consider whether users need to see the entire structure at once or only explore one branch at a time.
Next, clarify what users should accomplish. Decision-makers scanning for dominant segments and comparing sibling category sizes tend to favor treemaps, while analysts investigating structural relationships and tracing paths from root to subcategory often prefer the concentric view.
Finally, account for display constraints. Treemaps handle rectangular and wide viewports well, including dashboards and printed reports, with labels sitting cleanly inside their rectangles. Sunbursts require more vertical space and a larger overall canvas to keep inner rings and outer curved or angled labels legible, which can be a challenge on small screens or cramped panels. Weighing these three factors together produces a clear, defensible choice that matches the chart to both the data and the audience.
Frequently Asked Questions
What is the difference between a treemap and a sunburst chart?
A treemap represents hierarchical data as nested rectangles whose area is proportional to a quantitative value, while a sunburst chart arranges hierarchical data as concentric rings with top-level parents in the innermost ring and subcategories radiating outward. Treemaps fill a rectangular canvas, whereas sunburst charts have a circular footprint.
Which chart is better for comparing sizes or proportions?
A treemap often supports faster and more accurate reading of relative magnitudes, especially for values that are close in size, because rectangles can be compared using shared edges and alignments. A sunburst chart relies on angular extent, which places a higher burden on the viewer’s perceptual system.
How do you read nested levels in a treemap versus a sunburst chart?
In a treemap, users follow the borders of nested boxes inward from a parent rectangle to its children. In a sunburst chart, users scan outward from the center across concentric rings, following radial wedges to understand parent-child relationships.
How can treemaps and sunburst charts handle large datasets?
Use aggregation thresholds to consolidate small or low-value children into a single “other” category, and pair that with dynamic zooming or interactive drill-down to reveal detail on demand. Breadcrumbs help users track their location and step back to ancestor levels.
What are common mistakes to avoid when designing a treemap or sunburst chart?
Avoid over-nesting too many hierarchy levels in a single view, using poor color choices that blur adjacent segments, and letting viewers misread geometry such as judging sunbursts by angle or ring thickness instead of arc span. Keep aspect ratios reasonable, label key values directly, and test the visualization before publishing.
How do I choose between a treemap and a sunburst chart?
Consider dataset depth, what users need to accomplish, and display constraints: shallow hierarchies fit comfortably in a treemap, while sunbursts become more useful as the hierarchy grows deeper. Decision-makers scanning for dominant segments tend to favor treemaps, while analysts tracing structural relationships often prefer the concentric view.
Tony Astor
Tony writes about data visualization and the tools people use to build charts and dashboards. More about Data Illustrator