Treemap vs Pie Chart: Which Handles More Categories?
 By Tony Astor ·
Treemap vs Pie Chart
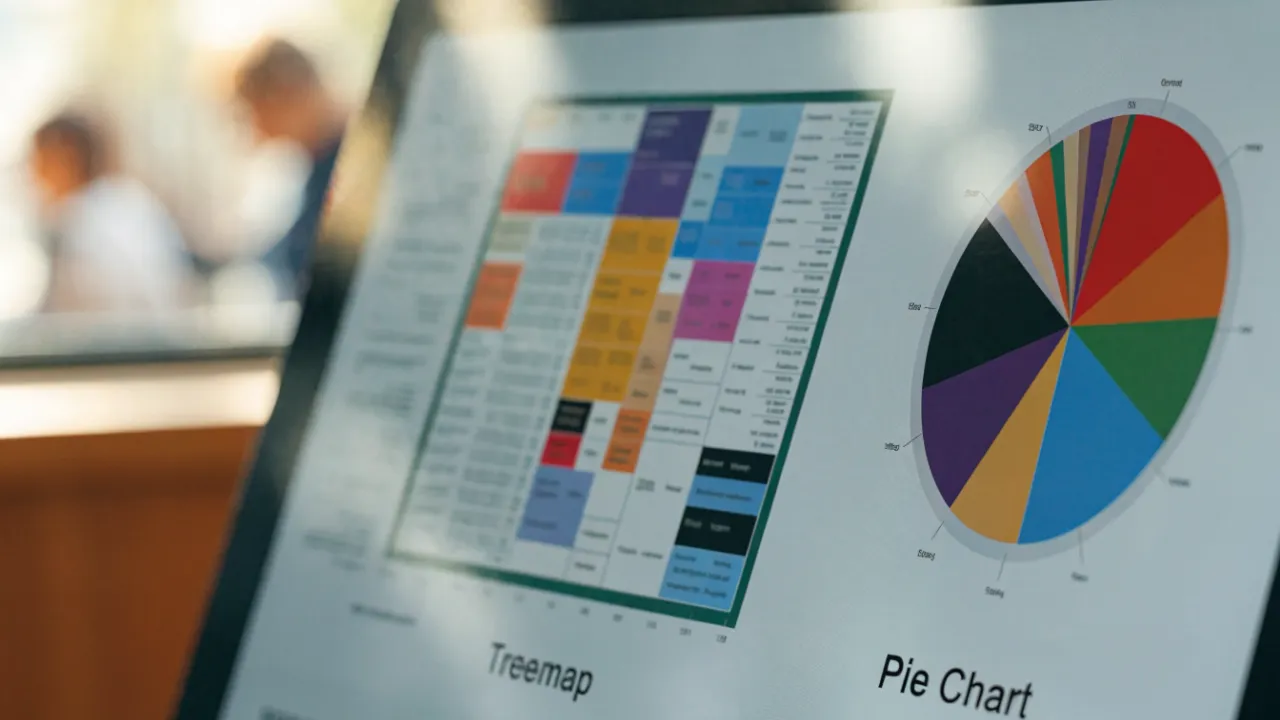
Use a pie chart for part-to-whole data with five or fewer flat categories, where it gives a fast, intuitive read. Use a treemap for many categories or hierarchical data, since nested rectangles stay legible at scale, fill space efficiently, and compare areas more accurately than pie angles.
Table of Contents
Pie Chart
The pie chart displays how individual parts relate to a whole. Each slice represents a category, and its area and angle correspond to the category’s share of the total. Because the entire circle represents 100 percent of the data, a viewer can immediately grasp that the categories are mutually exclusive and collectively complete. This makes the pie chart a natural fit for questions such as how a budget is divided among departments, what portion of a customer base falls into each of several segments, or how survey respondents split across a small set of answers.
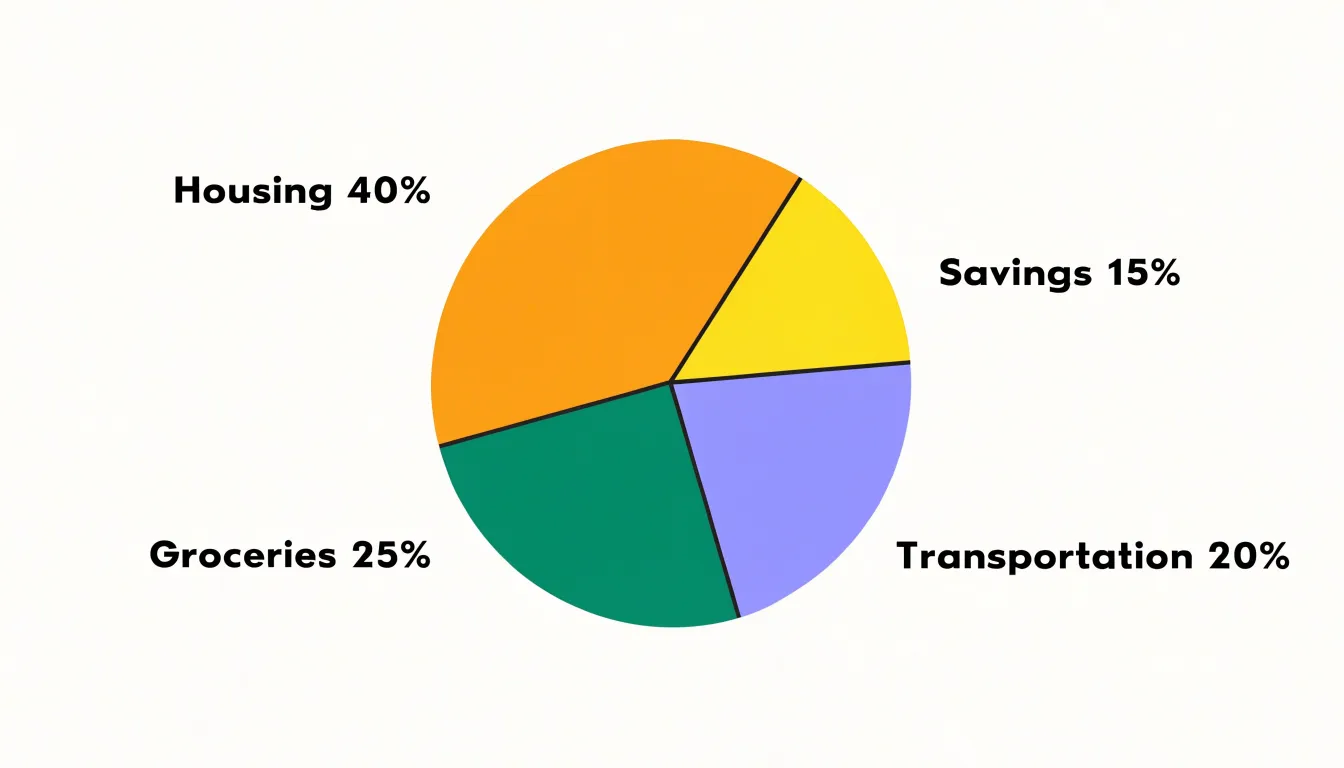
The format works best when the data contains between two and six distinct categories. Within this range, viewers can distinguish the slices with ease and hold the overall composition in mind. A two-category pie reduces to a simple split that is easy to read at a glance, while five or six categories remain manageable as long as the slices are clearly labeled. When the number of categories climbs beyond this range, slices become thin and difficult to compare.
Designers typically order the slices from largest to smallest and apply direct labels so the reader does not need to estimate angles. Keeping the number of categories small and ensuring the slices sum to a meaningful whole preserves the chart’s core strength: a fast, intuitive picture of how the parts fit together.
Treemap
A treemap represents hierarchical data through a system of nested rectangles, where each rectangle’s area is proportional to a quantitative value. The overall plot is divided into major categories, each allocated a portion of the total area according to its share of the whole. Within each major category, sub-categories are represented by smaller rectangles that further subdivide the parent’s area, and this nesting can continue through multiple levels of the hierarchy. This structure allows treemaps to display thousands of items simultaneously while preserving part-to-whole relationships at every level.
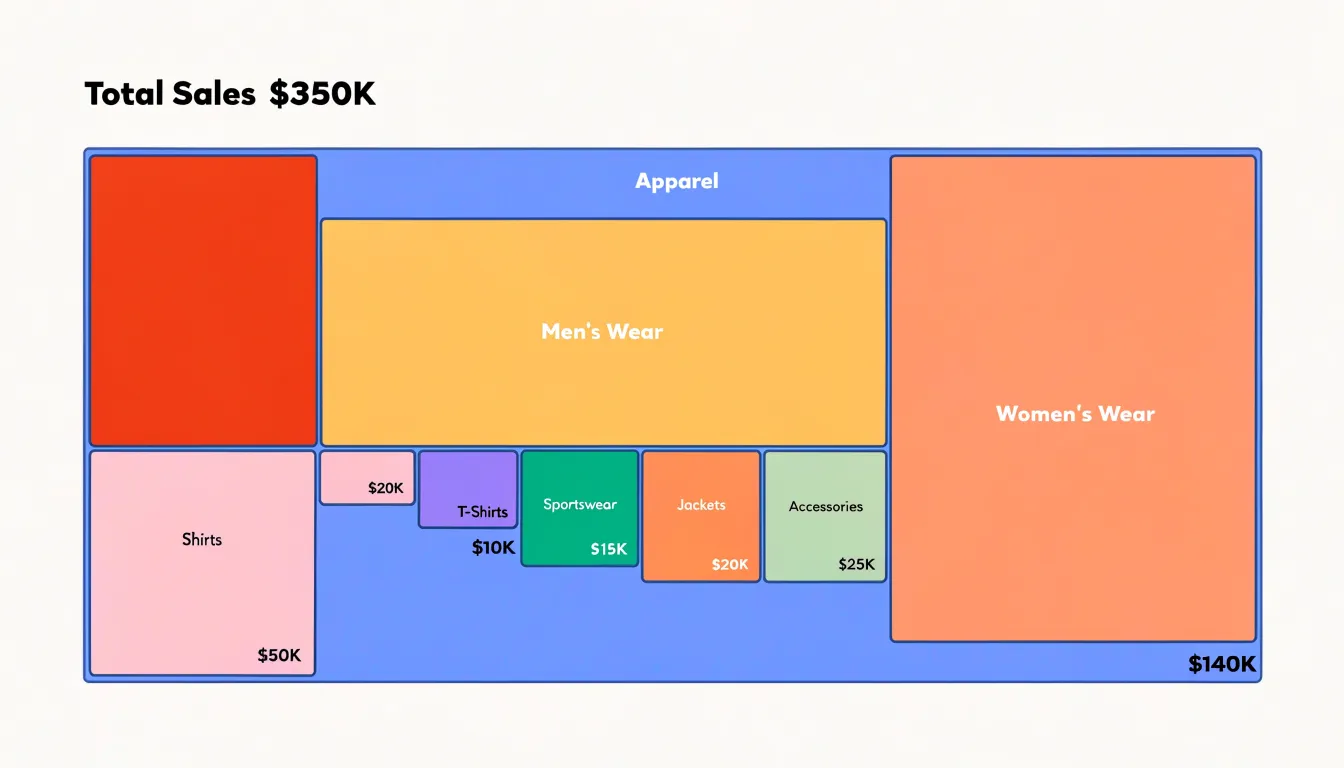
The visual density of a treemap makes it effective for comparing many categories at once, as the human eye can quickly estimate relative sizes and identify the largest and smallest contributors. Color can encode an additional variable, such as a second metric or a categorical grouping. For complex sub-category relationships, treemaps reveal patterns that might be obscured in other chart types: a large parent rectangle with many tiny children indicates a category with a long tail of small contributors, while a parent with a few large children suggests concentration. Treemaps also handle negative values and missing data through visual cues like distinct colors or patterns, though these require careful design.
The nested rectangular layout is space-efficient, using the entire plotting area without gaps, which is advantageous when screen real estate is limited or when the dataset is large. However, the reliance on area judgments means that precise comparisons between non-adjacent rectangles can be challenging, and the hierarchy can become difficult to trace in deep structures. Despite these considerations, treemaps excel at providing a compact, overview-first visualization of dense, multi-level data.
Category Limits
Pie charts depend on a small number of visually distinct segments. As the number of categories grows, the angular differences between adjacent slices shrink below the threshold that human perception can reliably distinguish. Research on graphical perception suggests that people can accurately compare slice angles only when the differences are roughly five degrees or more; once categories multiply, many slices fall below this limit, and their relative sizes become indistinguishable.
The visual system also struggles with the density of boundaries: each new slice introduces two radial edges and an arc, and beyond about five to seven slices the chart becomes a cluttered field of intersecting lines where the eye cannot easily trace one segment from center to rim.
Color encoding compounds the problem. A pie chart relies on distinct hues to separate categories, but the human visual system can reliably identify only a limited number of categorical colors—typically around six to eight—before colors begin to appear similar or identical. When a chart forces more slices than the palette can support, readers must repeatedly consult the legend, breaking the direct perceptual link that makes pie charts effective. These thresholds—angular discriminability, boundary density, and color distinctiveness—converge to make pie charts unsuitable for more than a handful of categories, while treemaps can accommodate dozens of categories without sacrificing legibility.
Visual Clutter
Visual clutter emerges the moment a pie chart grows beyond a handful of categories. A circle offers only 360 degrees of usable space, and every additional slice must claim a share of that fixed budget. Once a chart carries ten, fifteen, or twenty categories, slices narrow into hairlines, and the chart practically conceals the data it contains.
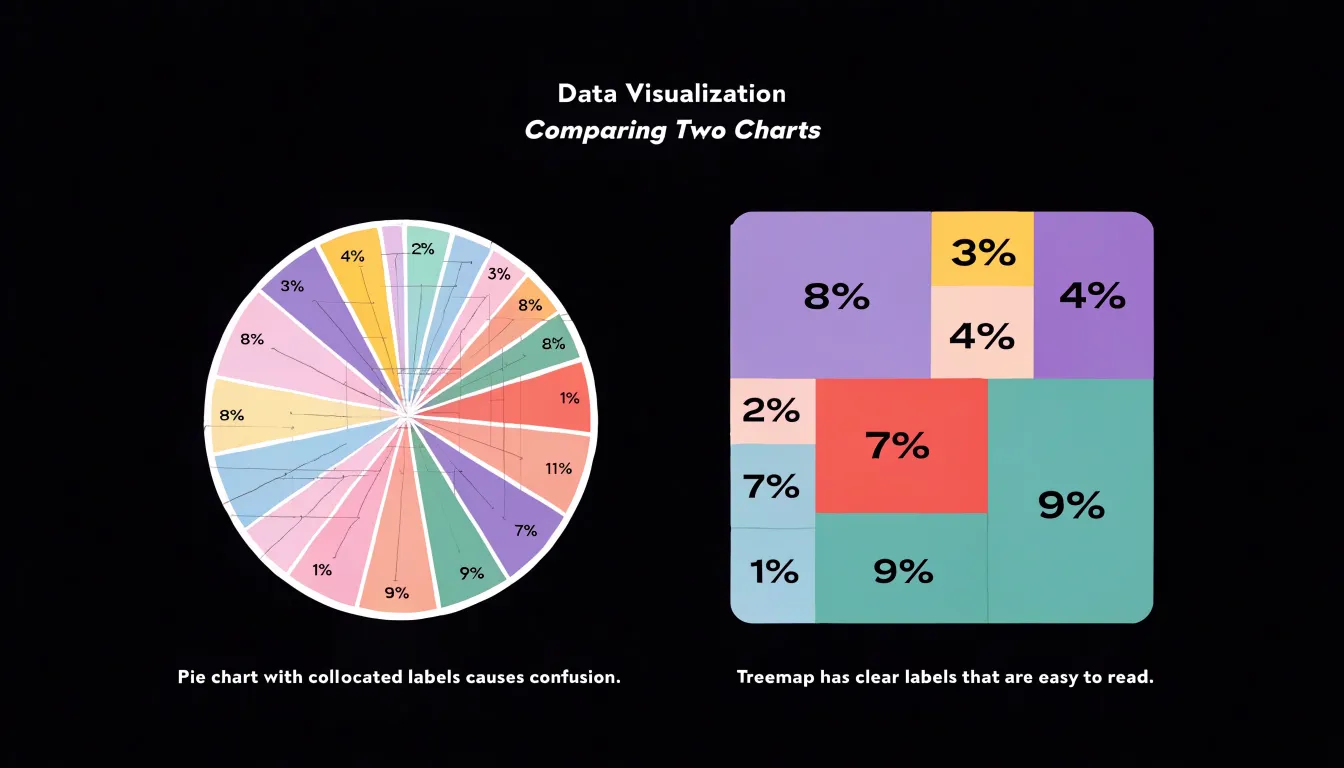
Labeling is where the crowding becomes acute. Each slice needs a name and often a value, and those labels must live somewhere near their slices. With many categories, labels collide, forcing designers into workarounds such as rotated text, leader lines that crisscross the chart, or labels pushed into a legend that requires constant back-and-forth eye movement. Small slices frequently receive labels placed outside the circle, where they stack, overlap, and obscure one another. The cognitive effort of matching label to slice often exceeds the effort of reading a table.
Beyond labeling, dozens of adjacent wedges in competing colors create a patchwork that reads as texture rather than information, and slight differences in hue become indistinguishable at small slice widths. Tiny slices also exaggerate the appearance of precision, suggesting distinctions the underlying data may not support. Overcrowding turns the pie chart from a quick summary device into a puzzle.
Small Slices
When a category represents a tiny share of the whole, its pie slice narrows into a thin wedge near the edge of the circle, sometimes only a few pixels wide. At that width, the slice often appears as little more than a line, and in many cases the fill color blends into the gap between neighboring segments until the category is effectively invisible. Readers scanning the chart may never register that the category exists.
Even when a thin slice remains technically visible, comparing two slices that each occupy one or two percent of the circle requires the eye to distinguish angles that differ by less than a degree, a task most readers cannot perform reliably. Viewers may overestimate or underestimate a small category, confuse it with a neighbor, or overlook it.
Grouping small categories into an “Other” segment offers one way out, though it trades detail for legibility and hides distinctions some audiences need. Because circular layouts allocate space in proportion to angle, the smallest values always receive the least room and the least readable geometry.
Space Efficiency
Circular charts inherently waste screen real estate because their round shape cannot fill a rectangular display area without leaving unused triangular corners. This corner waste could otherwise be used to display additional data or larger, more readable labels.
In contrast, treemaps pack rectangles to fill the entire allocated space without gaps, maximizing the use of every pixel. Treemaps adapt to the available container, whether it is a wide rectangle or a tall one, making them scalable across different screen sizes and aspect ratios. While circular charts are limited to a single level of hierarchy and leave corners underutilized, treemaps turn every part of the display into a dense, multi-level data representation.
Hierarchies
Treemaps are built around hierarchical structure, using nested rectangles to represent parent categories and the smaller rectangles contained within them as child categories. This nesting mirrors the way many real datasets are organized, such as product sales broken down by department, then by product line, then by individual item. The visual containment makes the parent-child relationship immediately legible, since a child rectangle visibly belongs to the larger region that surrounds it.
This structure supports seamless drill-down. A reader can start at the overview level, compare top-level categories by area, and then move into a specific region to examine its subcategories in detail. Because each level occupies the same bounded space, the transition from summary to detail feels continuous. Analysts can add or collapse levels of depth without abandoning the overall layout, which helps audiences keep their bearings. Interactive treemaps often allow users to click a rectangle to zoom in, revealing deeper levels while preserving context about where that branch sits in the wider structure.
Color Coding
In a treemap, color adds a second layer of meaning that operates independently of rectangle size and nesting, allowing a single chart to communicate two distinct metrics at once without visual clutter.
Hue serves as the primary vehicle for categorical distinction. Assigning a different hue to each top-level category, such as red for one product line and blue for another, lets viewers instantly separate groups even when their rectangles are scattered across the canvas. Saturation and lightness handle continuous variables with more nuance. A scale that shifts from pale to deep saturation can encode a metric like growth rate, with darker or more saturated shades marking faster-growing segments and lighter tones signaling stagnation or decline. Because saturation changes are perceptible at small rectangle sizes, this technique remains readable even when a category occupies only a sliver of the layout.
Diverging color scales further extend the approach. By centering a neutral hue at zero and pushing toward warm colors for positive values and cool colors for negative ones, a treemap can highlight which categories are expanding and which are contracting at a glance, surfacing outliers for closer scrutiny.
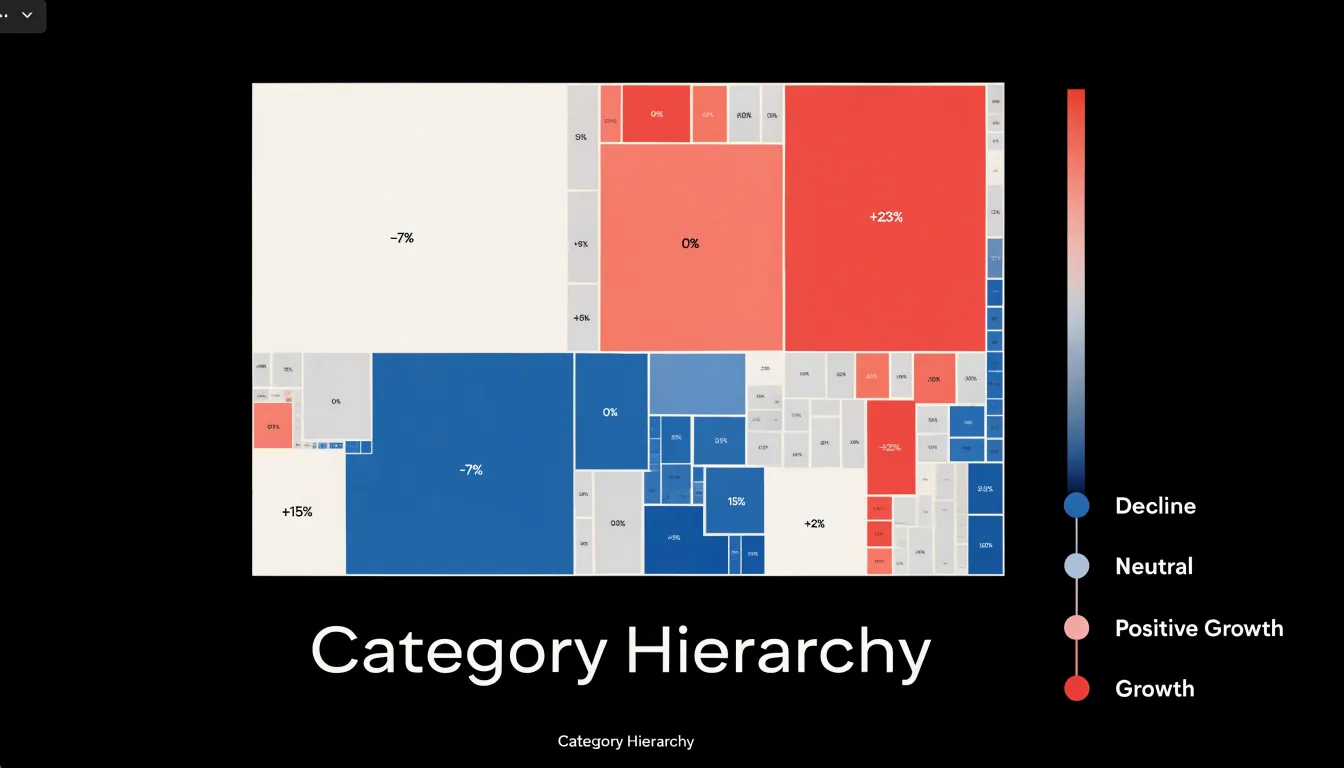
The main design consideration is balance. Color and size should tell complementary rather than redundant stories, and the palette should remain legible across the full range of rectangle dimensions.
Perception
The human visual system processes angles and areas through distinct perceptual pathways that differ markedly in precision. When a viewer encounters a pie chart, the primary judgment required is an estimation of arc length or central angle. Research in visual cognition has consistently shown that people are poor at comparing angles accurately, especially when the differences are small. A slice occupying 23 percent of a circle and one occupying 27 percent look nearly identical to most observers, even though they represent meaningfully different quantities. Without gridlines, labels, or numerical annotations, the viewer is left relying on a coarse and error-prone estimate.
Rectangular area comparisons engage different perceptual machinery. While area estimation is not flawless, people tend to perform better when shapes share a common baseline or alignment, because the comparison reduces to a linear judgment along one dimension. In treemaps, rectangles are packed into a shared frame, and their widths and heights can be scanned and compared directly. The brain can anchor on edges, align one rectangle against another, and judge relative extent with reasonable consistency, particularly when the rectangles are elongated or when the values differ substantially.
Neither format is perfect, and both benefit from labels and values. Still, angular estimation is a weak link in human vision, whereas aligned area and length comparisons exploit stronger, more consistent capabilities.
Dynamic Data
Dynamic data—such as real-time feeds, shifting category sizes, and newly introduced data dimensions—tests how gracefully a visualization absorbs change after it has been rendered. A treemap handles updates through its nested rectangle layout. When a category grows or shrinks, its rectangle resizes within the parent container, and the surrounding rectangles reflow to fill the available space. This reflow keeps the overall area constant and preserves proportional relationships, so viewers retain a stable sense of the whole even as individual pieces move. When a new dimension is added, the treemap can accommodate an additional level of nesting without abandoning the existing layout logic.
In a pie chart, each slice’s angle is fixed to a category’s share of the total, so any change in category size forces a recalculation of every slice, shifting its visual identity as its neighbors expand or contract. Adding a category requires inserting a new slice and redistributing angles across the circle, which can push previously distinct slices into thin slivers. Removing a category leaves a gap that must be closed by rebalancing the remaining arcs. In a live update scenario, these constant angular recalculations can produce a visually unsettled chart, with slices jumping between frames.
For dashboards fed by streaming data or categories that are added and retired frequently, the treemap’s area-based encoding tends to remain more legible under change, while the pie chart’s angular encoding demands more frequent re-rendering and careful animation to stay comprehensible.
Mobile and Dashboards
On a smartphone, a pie chart shrinks by scaling its radius, so each slice narrows and the labels crowd toward the center; past a handful of categories, the legend and percentage callouts demand more room than the chart itself. A treemap’s rectangles keep their proportions while the available canvas contracts, so a compact phone layout can still carry meaningful area comparisons provided the smallest tiles receive a minimum size threshold or a tap-to-expand affordance. In practice, responsive treemaps often win on phones because they degrade by hiding labels rather than by distorting slice geometry, and touch interaction lets users drill into a tile instead of squinting at a truncated legend. The pie chart’s advantage on mobile is familiarity and immediate part-to-whole reading when categories are few, making it suitable for a single summary card on a phone home screen.
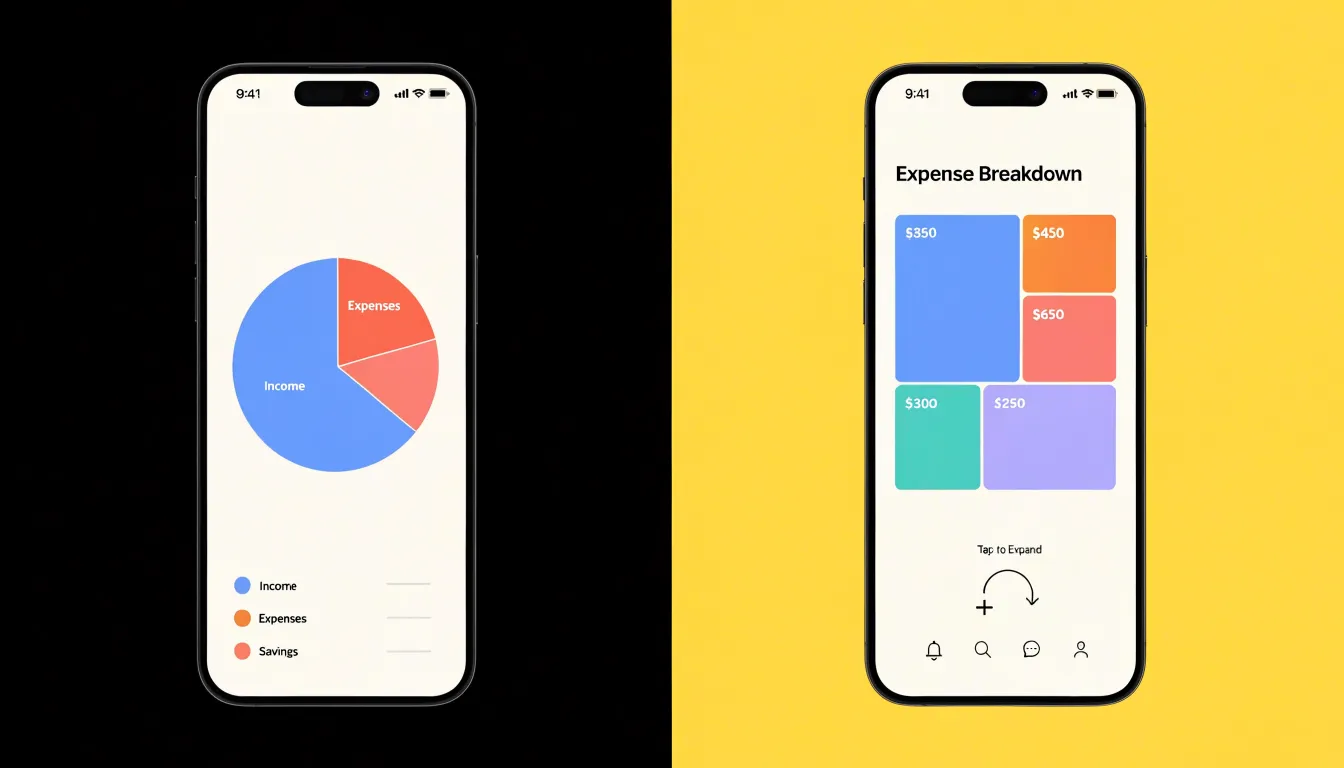
Business dashboards introduce the opposite pressure: many widgets sharing one dense canvas, often viewed on large monitors but also rendered in report embeds and tablet views. Here density favors treemaps, since a single treemap can encode dozens of categories in a compact panel and support hierarchical drill-down without spawning additional charts. Pie charts multiply quickly in dashboards, and a grid of several small pies creates visual noise and forces viewers to compare angles across separate frames. Furthermore, treemap borders, hover states, and consistent color ramps scale cleanly to small panel sizes, while pie labels require collision handling that frequently fails in narrow columns. Reserve pie charts for one or two high-level share metrics in responsive mobile layouts, and lean on treemaps when a dashboard must pack many categories into limited space.
Common Mistakes
Even with the right chart type, poor execution can undermine a report. A frequent mistake is using 3D pie charts, where added depth distorts proportions. Perspective makes some slices appear larger or smaller than their actual values, and the third dimension adds visual clutter without information, leading viewers to misjudge relative slice sizes.
Another common error involves treemaps overloaded with unshaded, equal-sized nodes. When all rectangles are the same size, the treemap loses its primary advantage: area encoding. The chart becomes a grid of identical boxes, forcing readers to rely on labels rather than visual comparison. Without color shading to indicate a second variable, an equal-sized treemap offers little insight beyond a list. Designers should favor simple, accurate encodings and test whether each visual element adds meaningful information.
Use Cases
Pie charts shine where the data is simple and the audience needs an immediate grasp of part-to-whole relationships:
- Household budgeting dashboards: Showing how monthly income splits across housing, groceries, transportation, utilities, and savings communicates proportions at a glance because the slices are few and map to familiar categories.
- Marketing spend allocation: Presenting a budget across four or five channels lets viewers quickly see which channel consumes the largest share.
- Summaries and breakdowns: Election result summaries, survey response breakdowns by demographic group, and simple expense reports all benefit from cognitive ease. A viewer understands a five-slice pie chart with almost no explanation, making it ideal for executive summaries, slide decks, and public-facing reports where time and attention are limited.
Treemaps excel when the data is hierarchical and the number of items is large:
- Complex portfolio tracking: An investment portfolio might contain hundreds of holdings nested across asset classes, sectors, and regions. A treemap displays all of them simultaneously using area for value and color for performance, letting a financial advisor spot an over-weighted sector or a cluster of underperforming holdings without drilling through pages of tables.
- Organizational and system monitoring: Tracking departmental budgets across a large organization, monitoring spending across hundreds of procurement categories, or visualizing disk usage in a file system all require both overview and granular inspection in an analytical dashboard.
Alternatives
When neither treemaps nor pie charts deliver reliable quantitative comparisons, stacked or horizontal bar charts offer a robust fallback. These chart types align a common baseline—the axis—so that lengths can be compared directly, avoiding the perceptual distortions of area or angle.
In a horizontal bar chart, each category occupies its own row, and the bar length encodes the value. Because the human eye is adept at comparing lengths along a common scale, this layout supports precise ranking and exact quantitative comparisons, and the horizontal orientation accommodates many or long category labels without crowding.
Stacked bar charts extend this by showing part-to-whole relationships within categories: each bar represents a total, segmented into subcategories. Because all segments share the same height, viewers can compare both total magnitudes and the composition of each total across groups, though comparing individual unaligned segments within a single bar is less precise.
Decision Framework
To choose between the two formats, evaluate your dataset along two dimensions:
- Count the categories: When the count stays at or below roughly five, a pie chart works well. As the count climbs toward six or seven, consider switching. Past that threshold, choose a treemap so every category remains visible.
- Check the structural depth: If your data has a single flat level of categories, either chart can work within the count limits above. If your data contains a hierarchy, choose a treemap; a pie chart cannot represent more than one level without confusing nested rings or fragmented slices.
Few categories and a flat structure point to a pie chart; many categories or any hierarchy point to a treemap. For borderline cases, such as five or six categories with mild nesting, weigh readability first and pick the chart that lets your audience compare values at a glance.
Frequently Asked Questions
How many categories should a pie chart have?
Pie charts work best with a small number of distinct categories—between two and six. As the count climbs toward six or seven, consider switching; past that threshold, choose a treemap so every category remains visible.
Why are small pie chart slices hard to read?
Small slices narrow into thin wedges, sometimes only a few pixels wide, and can blend into gaps until the category is effectively invisible. Even when visible, comparing slices of one or two percent requires distinguishing angles that differ by less than a degree.
What is a treemap used for?
Treemaps are used for hierarchical data with many items, using nested rectangles whose areas are proportional to quantitative values. They can display thousands of items while preserving part-to-whole relationships at every level.
How is color used in a treemap?
Hue can distinguish top-level categories, while saturation and lightness can encode continuous variables such as growth rate. Diverging color scales can also highlight positive and negative values at a glance.
Are treemaps better than pie charts for mobile and dashboards?
On phones, responsive treemaps often win because they degrade by hiding labels rather than distorting slice geometry, though pie charts can suit a single summary card when categories are few. In dense business dashboards, treemaps favor many categories and hierarchical drill-down, while pie charts are best reserved for one or two high-level share metrics.
What is a common mistake when creating a treemap?
A common mistake is overloading a treemap with unshaded, equal-sized nodes; when all rectangles are the same size, the treemap loses its area encoding and offers little insight beyond a list. Favor simple, accurate encodings and test whether each visual element adds meaningful information.
Tony Astor
Tony writes about data visualization and the tools people use to build charts and dashboards. More about Data Illustrator