Treemap vs Circle Packing: Showing Nested Data
 By Tony Astor ·
Treemap vs Circle Packing
Treemaps and circle packing both visualize hierarchical data, but treemaps encode values as nested rectangles whose areas are directly proportional to magnitude, filling space without gaps for fast, accurate size comparison. Circle packing uses nested circles that convey containment and clustering intuitively, but wastes space on gaps and makes precise area judgments slower and less accurate.
Table of Contents
Treemap
A treemap represents a hierarchical dataset as a set of nested rectangles, where the area of each rectangle is proportional to a quantitative value. The total canvas stands for the whole, and each top-level category receives a rectangle whose size corresponds to its share of that total. Within each of these rectangles, subcategories are drawn as smaller rectangles, and this subdivision continues through as many levels as the data requires. The result is a compact, space-filling layout in which every pixel carries information about magnitude.
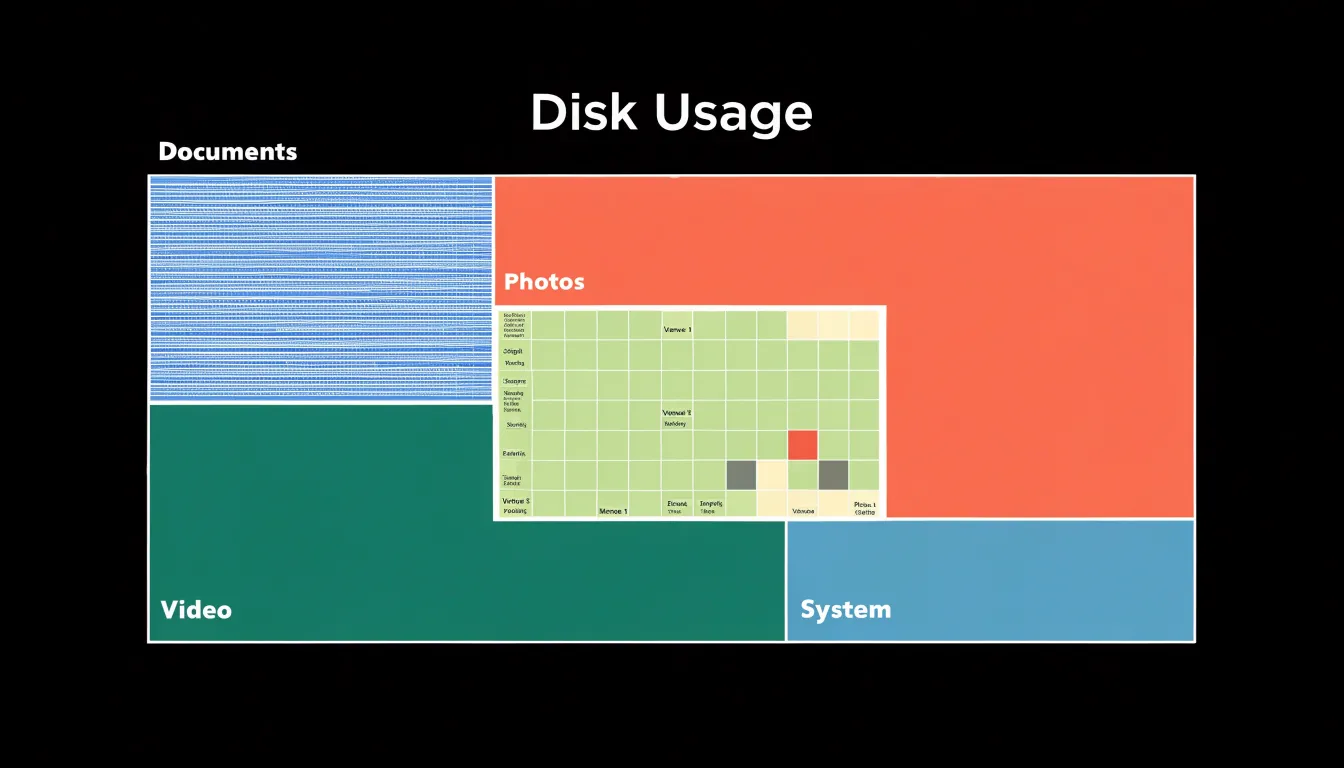
The efficiency of the treemap comes from its reliance on rectangular space division. Rectangles tile a plane without gaps or overlaps, so the entire plotting area is put to work displaying values. Because treemap algorithms such as squarified or slice-and-dice partition each parent rectangle into child rectangles that exactly fill it, the available screen real estate is allocated almost entirely to representing proportional values. This matters most on limited displays, where dense data must remain legible without scrolling or zooming.
The nesting also encodes structure. A reader can see at a glance which categories dominate, how each category splits into its parts, and where small but numerous items cluster. Colour and labels reinforce the hierarchy, allowing quick comparison of sibling rectangles and identification of outliers. The proportional sizing makes relative magnitude the primary visual signal, so differences in area translate directly into differences in value.
This combination of exact area encoding, complete use of space, and readable hierarchy makes treemaps well suited to financial breakdowns, disk usage displays, and any dataset where parts-of-a-whole comparison across nested categories is the central question.
Circle Packing
Circle packing represents hierarchical data through a system of nested circles, where each parent node encloses its children within its boundary. The visual metaphor is one of physical containment: a circle sits inside another circle, and that relationship reads instantly as a structural one. Viewers perceive the outer circle as the container and the inner circles as its parts, which makes the parent-child hierarchy legible without requiring labels or connecting lines. This containment carries the same logic as folders holding files or categories holding subcategories, so the chart maps cleanly onto how people already reason about grouped information.
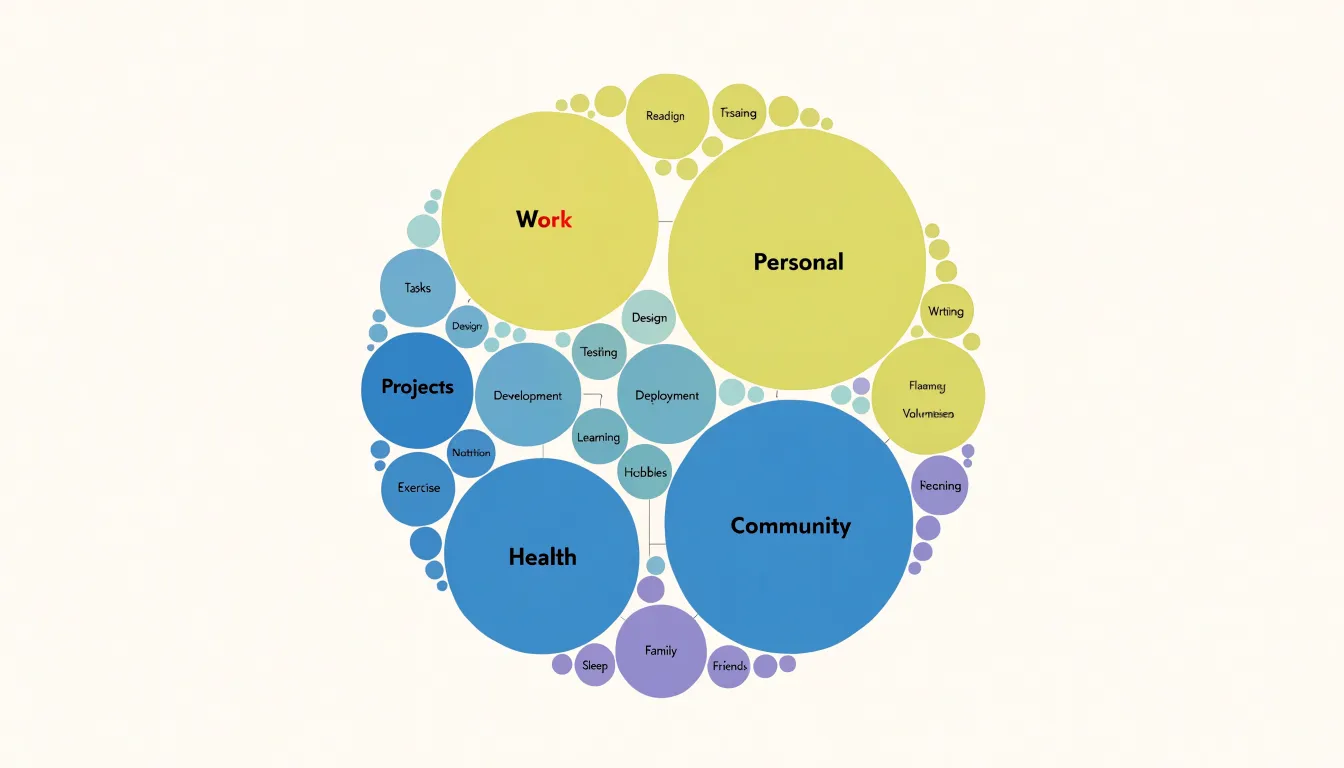
Because each circle is drawn as a discrete shape, natural groupings stand out as distinct visual objects. Sibling nodes appear as a cluster of circles sharing one parent boundary, and their relative sizes communicate magnitude within that group. The round form also gives the eye a smooth contour to follow, so scanning from one cluster to the next feels continuous rather than segmented. Where circles touch each other, proximity reinforces the sense of relationship, and the space between parent boundaries creates a clear separation between top-level categories.
The layout inevitably leaves empty whitespace between shapes, since circles cannot tile a plane without gaps. This padding serves a perceptual purpose: it gives each circle breathing room, keeps boundaries distinct, and prevents the crowding that can make dense rectangular layouts harder to parse. The unused space becomes a separator that helps viewers isolate individual nodes and their immediate families. For datasets where the primary goal is to reveal how elements nest and cluster rather than to compare precise areas, these gaps are a reasonable trade, and the overall pattern of nested circles reads as an intuitive map of structure and grouping.
Space Usage
Space usage becomes a decisive factor when you place a treemap and a circle packing diagram side by side using the same dataset. Because a treemap’s rectangles share edges, the total area of the chart equals the sum of the values being represented, with no wasted pixels.
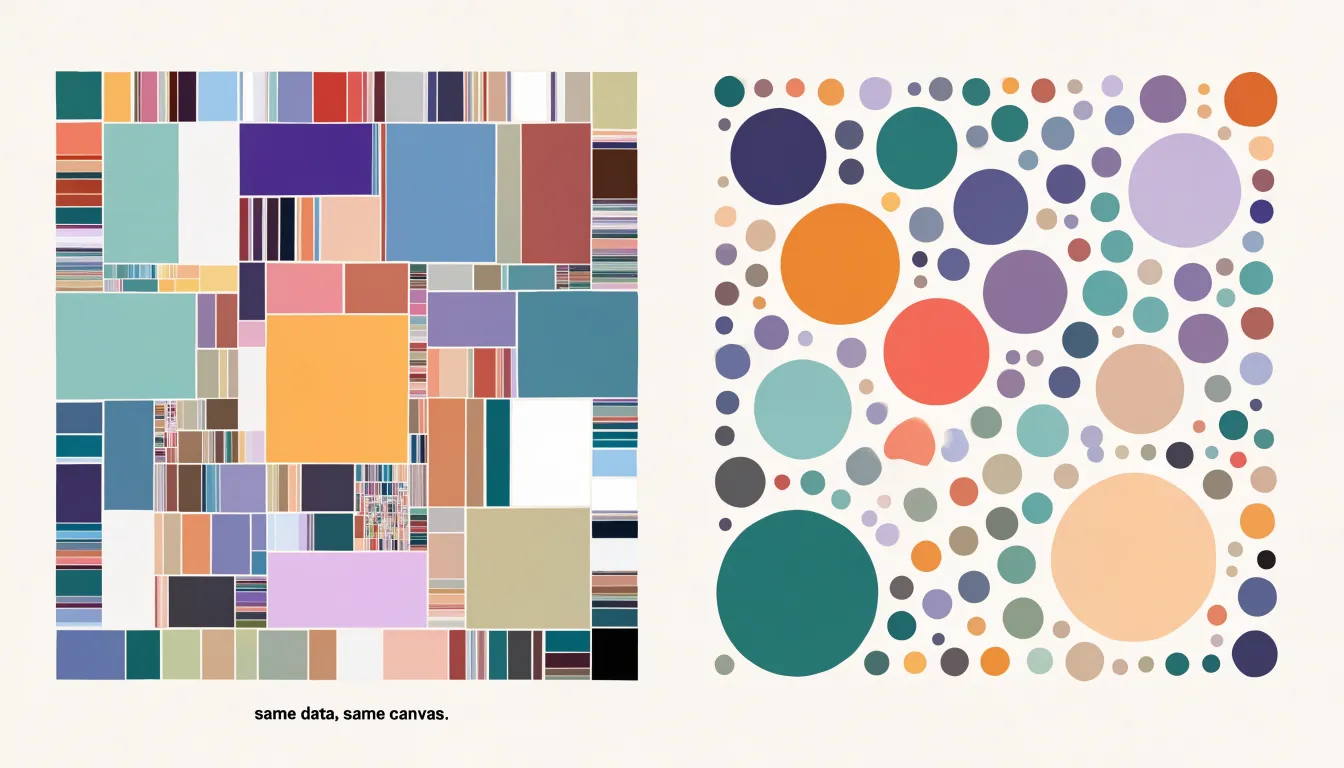
Circle packing follows a different geometric logic. Any attempt to nest or arrange circles produces unavoidable slivers of empty space at the borders. When circles are packed inside a larger circle, the curvature of each boundary creates crescent-shaped voids that belong to no data point. Those voids persist at every level of the hierarchy. A child circle sits inside its parent with a ring of unused area around it, and sibling circles touch at single points at most, leaving triangular and curved gaps between them. The larger the circle count, the more pronounced this border waste becomes, though it never disappears entirely.
For practical charting, this difference matters when the available canvas is limited. A treemap can make use of a narrow panel, a dashboard tile, or a small screen because its tiling respects the container edges. Circle packing needs more room to convey the same number of values, since a meaningful fraction of the area is consumed by spacing and boundary effects rather than data. The same dataset that fills a compact rectangle in a treemap will demand a larger circle-packed frame to keep small values legible, and even then the gaps remain. Comparing the two at identical dimensions shows the treemap delivering denser encoding per pixel.
Reading Speed and Clarity
In the comparison between treemaps and circle packing, comprehension metrics offer a concrete way to measure differences in reading speed. Treemaps use straight-edged rectangles whose areas are directly comparable along shared horizontal and vertical baselines. When a viewer scans a treemap, adjacent rectangles align along common edges, and the eye can quickly judge one block against another by following those straight lines. Size estimations become faster because the comparison relies on linear dimensions that are easy to anchor against neighbors and against the overall frame of the chart.
Circle packing, by contrast, encloses data in circles whose boundaries curve away from one another. Estimating the relative size of two circles requires the viewer to mentally reconcile their diameters or areas without shared straight reference lines. The curved contours leave irregular gaps between shapes, and these gaps can distract the eye or introduce ambiguity about how much space a circle actually occupies. Studies of user comprehension consistently show that participants complete size-comparison tasks more quickly and with fewer errors when working with rectangular layouts than with circular ones. The straight edges of a treemap let viewers trace a line across the chart and read off proportions almost immediately, while the bounding circles of a packed layout demand more deliberate visual processing.
These differences translate directly into practical outcomes. Faster size estimation reduces the cognitive effort needed to answer simple questions such as which category is largest or how two groups compare. In dashboards and analytical tools where users repeatedly scan for patterns, this speed compounds across many interactions. Clarity therefore favors treemaps in tasks centered on quantitative comparison, since the geometry of straight edges supports the kind of rapid, confident reading that circle packing struggles to match.
Deep Hierarchies
In a treemap, recursive partitioning allows a viewer to trace a path from the top-level group down through several subgroup layers by following shared boundaries and shrinking frames within frames. Because every level consumes area rather than adding a separate visual object, a treemap can carry five or six levels of nesting before the smallest tiles become too thin to read. Designers can manage the deepest layers by limiting how far labels are drawn, aggregating tiny leaves into an ‘other’ tile, or allowing a drill-down interaction that reveals finer subdivisions only on demand.
In circle packing, each level appears as a visible ring of circles inside a larger one, so the depth of the structure is legible at a glance, and the eye naturally follows the chain of containment from outer circle to inner circle. The trade-off is that the empty space between siblings accumulates with every additional level. On a chart with many layers, the innermost circles shrink quickly and can become tiny dots that are hard to distinguish or label. Practitioners often counter this by capping the rendered depth, by sizing circles with care so leaf nodes retain a minimum radius, or by using zooming so that deeper layers expand into view when a user selects a parent.
Both approaches therefore handle multi-level nesting without overwhelming the viewer, though they distribute the difficulty differently: the treemap squeezes depth into thinning rectangles, while the circle packing spreads it into diminishing circles. The practical choice depends on how many levels matter at once and whether interactivity is available.
Large Datasets
When visualizing thousands of data points, the choice between treemap and circle packing has direct implications for both rendering performance and layout stability. Treemaps scale efficiently because each node’s area is computed arithmetically and rendered as a simple quadrilateral. Even with tens of thousands of nodes, treemap layouts can be generated quickly and rendered smoothly, as the geometry is straightforward and the number of draw calls remains manageable through techniques like merging adjacent rectangles or using level-of-detail.
In contrast, circle packing requires calculating positions and radii for each circle while ensuring no overlaps, which becomes computationally intensive as the number of circles grows. The packing algorithm often involves iterative collision detection and adjustment, leading to longer layout times and higher memory usage. Rendering thousands of circles also places a greater load on the GPU, particularly when anti-aliasing and borders are applied.
Moreover, treemap layouts tend to be more stable: small changes in data values produce proportional changes in rectangle sizes, and the overall structure remains consistent. Circle packing layouts, however, can exhibit larger shifts because the packing arrangement is sensitive to the order and size of circles; adding or removing a single data point may cause many circles to reposition, making comparisons across updates difficult. For interactive applications that require frequent updates or animations, treemaps offer predictable performance and smoother transitions. Circle packing can still be viable for large datasets if using specialized algorithms like front-chain packing or spatial hashing, but it demands more careful optimization. Ultimately, when dealing with thousands of points, treemaps provide a more reliable balance of speed and stability, while circle packing may be preferred for its aesthetic appeal in static or moderately-sized visualizations.
Size Perception
Human vision is remarkably good at some comparisons and surprisingly poor at others. When two rectangles share a common baseline and are aligned side by side, their lengths can be read directly against one another, so a difference in height translates almost linearly into a perceived difference in magnitude. Judging which of two bars is longer is fast, accurate, and consistent across observers.
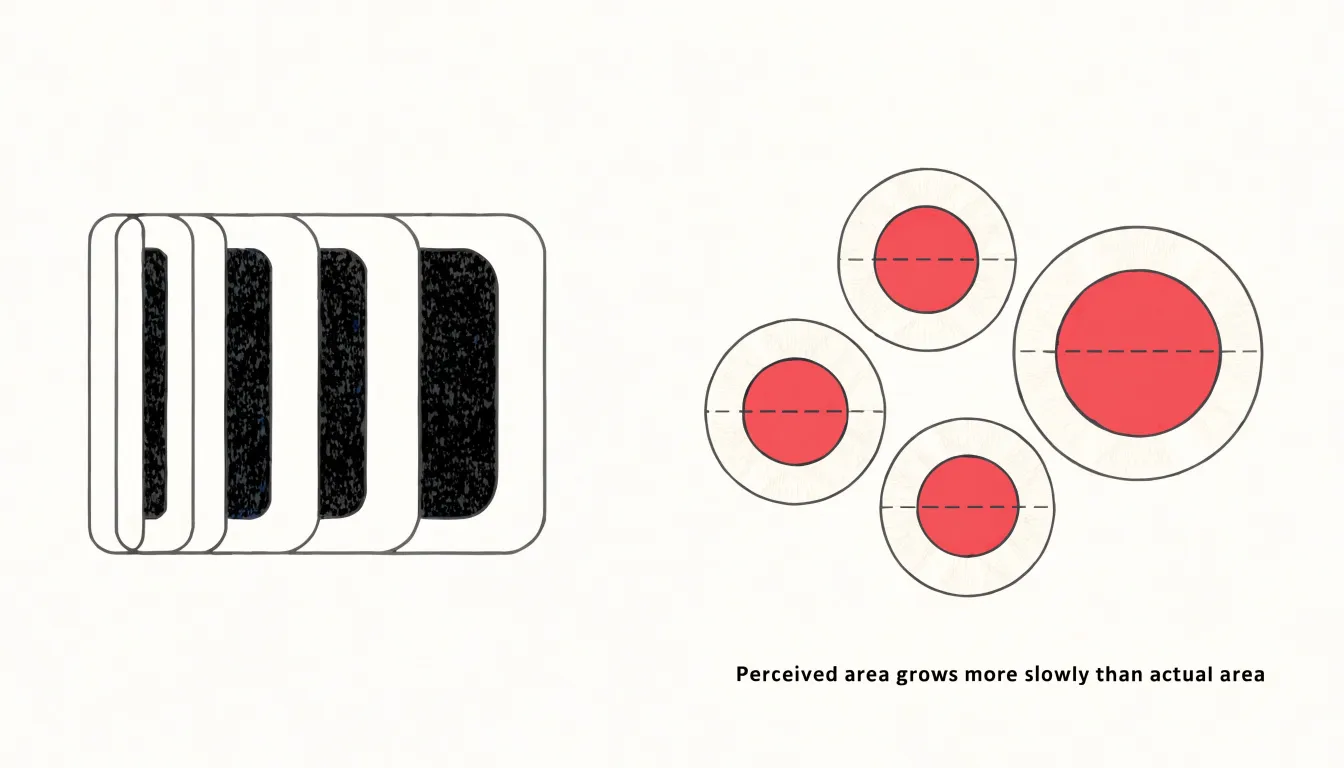
Area judgments for circles behave very differently. Research on graphical perception, most famously the work of Cleveland and McGill, ranked elementary visual encodings by accuracy and found that length and position judgments outperform area judgments by a wide margin. Stevens’ psychophysical power law adds a further complication: perceived area grows more slowly than actual area, with an exponent well below one, meaning large circles are systematically underestimated relative to small ones. A circle twice the area of another does not look twice as large. Because the diameter of a circle scales with the square root of its area, viewers also tend to anchor on diameter rather than area, which inflates the perceived size of larger circles and compresses perceived differences among smaller ones.
Rectangles within a treemap sidestep much of this difficulty because their edges align to a shared grid, giving the eye stable reference lines and consistent aspect ratios against which lengths can be compared. The result is that treemap layouts support quicker and more reliable size rankings than circle packing, where scattered, unaligned disks force viewers to integrate two-dimensional extent without any common frame of reference. For data where precise magnitude comparison matters, the rectangle’s advantage in perceptual accuracy is a decisive argument in its favor.
Color Strategies
Effective color strategies in treemaps and circle packing hinge on a clear distinction between grouping and highlighting. For grouping, categorical hues work best when the number of categories is limited—typically no more than seven to nine—so that each hue remains distinguishable. Assigning a unique hue to each top-level category allows viewers to quickly parse the overall structure. Within each category, depth levels can be conveyed through variations in lightness or saturation of the base hue, creating a natural visual hierarchy. For example, a parent category might use a medium saturation, while child nodes use progressively lighter tints. This approach maintains the categorical identity while signaling nesting. When the number of categories exceeds the comfortable range, consider grouping smaller categories into an ‘Other’ bucket or using a sequential palette for ordered data.
For highlighting key metrics, contrast is essential. Reserve a single, high-saturation color—such as a bright orange or red—for the most important data points, and use it sparingly to draw the eye. Ensure that this highlight color is distinct from all categorical hues to avoid confusion. In treemaps, color can also encode a quantitative variable via a gradient; in that case, use a perceptually uniform sequential palette (e.g., Viridis) and avoid rainbow palettes that create false boundaries.
For circle packing, similar principles apply, but because circles have less area than rectangles of the same bounding box, color differences may be harder to discern. Therefore, increase contrast between depth levels and limit the number of simultaneous colors. Always test color choices for accessibility, ensuring sufficient luminance contrast and avoiding red-green combinations that are problematic for colorblind viewers. By thoughtfully combining categorical hues for grouping and strategic contrast for highlighting, you can guide viewers through complex hierarchies and emphasize the metrics that matter most.
Interactivity
Interactivity turns a dense treemap or circle packing layout from a static picture into a space that rewards exploration. Semantic zooming is the foundation of this experience. As a reader zooms into a region, the display does not simply magnify existing shapes; it changes what it shows. Labels that were hidden at the overview level appear once a tile or circle grows large enough to hold them, and secondary details such as values or categories surface only at closer scales. This keeps the chart legible at every level, so the overview stays clean while closer views become more informative.
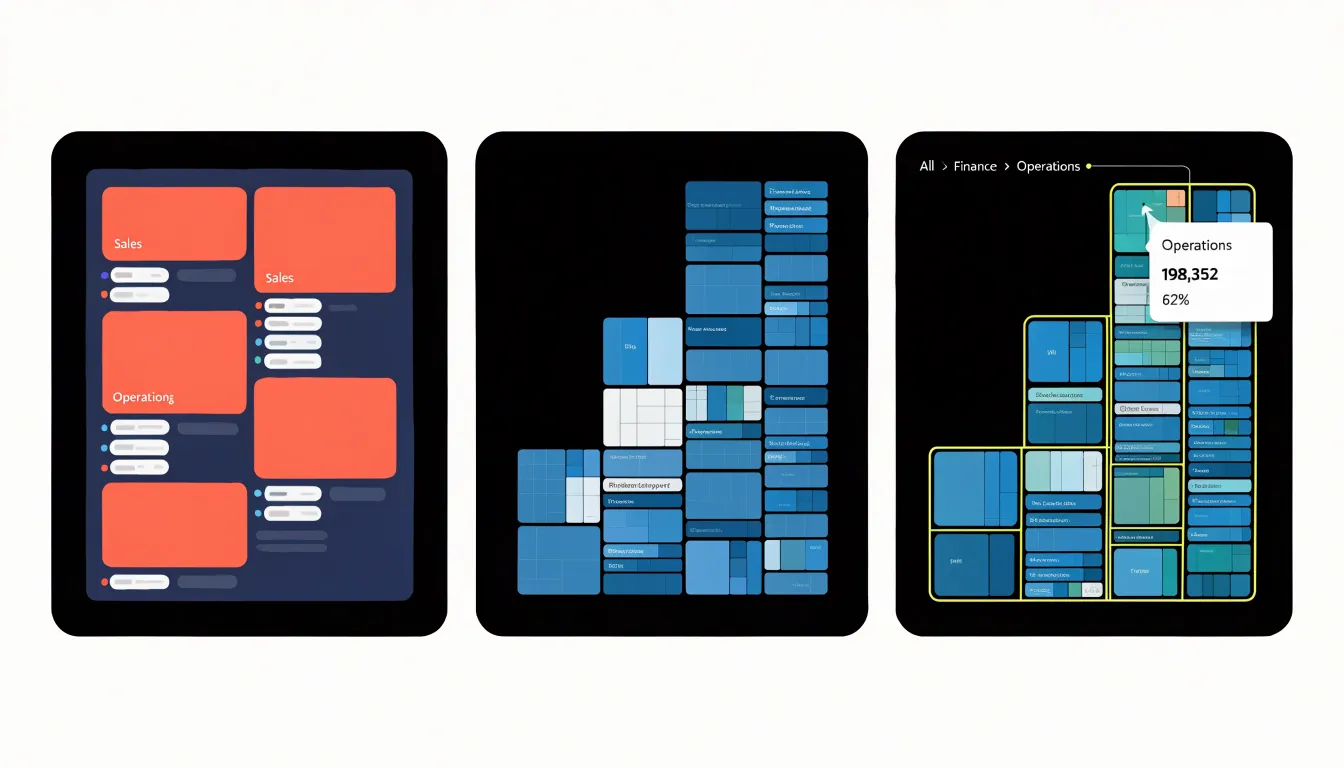
Click behavior complements zooming by supporting drill-down. Selecting a tile or circle can open its children as a fresh layout, letting readers move from a broad category into finer subcategories in a sequence of deliberate steps. A breadcrumb trail or back control keeps this movement reversible, so exploring a hierarchy feels like navigating a map rather than losing one’s place. Double-click or scroll gestures can combine with selection to make the transition fluid.
Custom tooltips anchor these movements with precise information on demand. Hovering over an area can reveal exact values, percentages, labels, and comparisons that would clutter the layout if drawn directly. Well-designed tooltips follow the cursor, stay within the viewport, and update instantly, giving readers confidence in what they are seeing without disturbing the overall composition.
Together these behaviors transform dense static layouts into intuitive interactive charts. Instead of forcing every detail into one view, the chart reveals information progressively: the large picture first, then the specifics through deliberate action. Readers can follow their own questions through the hierarchy, and the same layout serves both a quick glance and a deep investigation.
Mobile Adaptability
On mobile viewports, the available screen real estate forces every visualization to make compromises, and the shape of those compromises depends heavily on the geometry underlying each chart type. Because treemaps consume the full width and height of a phone screen without wasting a pixel, narrowing the viewport simply recalculates the rectangle subdivision, producing smaller but still contiguous tiles that fill the container edge to edge. Labels can be clipped, abbreviated, or moved into tooltips, and the overall structure remains legible because every tile shares straight edges with its neighbors.
Circle packing behaves differently under the same constraints. On a small screen, the gaps between tangent circles and along container borders consume a proportionally larger share of the limited area, and the circles themselves must shrink to fit within the narrower viewport. Deeply nested circles compound the problem by reducing the usable radius of the innermost nodes. On a phone, small bubbles become difficult to tap accurately and nearly impossible to label without overlapping text.
Interactivity further favors treemaps on mobile. Panning and zooming into a treemap keeps rectangular regions aligned with the screen edges, so gestures feel predictable and content stays anchored. Circle packing zooms tend to leave awkward empty corners and require more precise touch targets. Treemaps also handle orientation changes more smoothly, reflowing their rectangles to match landscape or portrait dimensions, while circular layouts often end up with unused space on one axis. For audiences browsing dashboards or reports on phones, these practical differences translate into treemaps remaining readable and usable at small sizes, whereas circle packing tends to require zooming or a switch to a list view to stay functional.
Best Uses for Treemaps
Treemaps excel in domains where the precise proportional relationship between parts and the whole carries real decision-making weight. Financial dashboards are a natural fit: a portfolio’s asset allocation can be rendered as a single rectangle subdivided into stocks, bonds, cash, and alternatives, with each category’s area matching its share of total value. An investor reading such a display can immediately gauge whether fixed income dominates the book or whether a single holding has quietly grown to an uncomfortable concentration, because the geometry encodes the numbers directly rather than relying on a reader’s estimate of a pie slice. The same logic applies to budget breakdowns at the departmental or organizational level, where a treemap can nest sub-categories inside their parent lines, showing at a glance which functions consume the largest share of spend and how the money divides within each one.
File storage is another setting where treemaps have become a familiar sight. Tools for visualizing disk usage map folders to rectangles sized by byte count, so a user scanning a full drive can spot the handful of directories responsible for most of the consumed space without drilling through a file tree. Nested rectangles reveal how space disperses inside a large folder, and color can flag file types or modification recency, turning a routine cleanup task into a quick visual triage.
Across these applications the common thread is the need to read exact proportions. When the question is how much of the total a given component represents, and when that answer needs to be accurate rather than approximate, the rectangular subdivisions of a treemap support the comparison directly. The layout also scales gracefully as categories multiply, accommodating hundreds of small items that would overwhelm a pie chart while preserving the proportional encoding that makes the display useful in the first place.
Best Uses for Circle Packing
Circle packing shines in scenarios where the relationships between elements and the natural clusters they form matter more than precise area measurement. In social network analysis, for example, each circle can represent a person, a group, or an organization, and the way circles nest within one another mirrors the tiers of connection that define a community. Large circles containing smaller ones communicate membership and hierarchy at a glance, making the structure of a network legible even to viewers unfamiliar with the underlying data.
Organizational structures benefit from the same visual grammar: departments, teams, and individual roles can be arranged as nested circles, with the containment itself conveying reporting lines and group affiliation. A reader can trace a path from the whole organization down to a single team without needing to interpret axes, scales, or grid lines.
Biological taxonomies are another natural fit. Kingdom, phylum, class, order, family, genus, and species form inherently nested categories, and circle packing reproduces that nesting in a way that feels intuitive and organic. The enclosing circles echo the way nature itself organizes living things into progressively smaller related groups.
Across all these cases, the aesthetic grouping of circle packing carries real communicative weight. Viewers perceive clusters and boundaries immediately, which supports exploration and storytelling. When the goal is to show how parts belong to wholes, where boundaries between groups fall, and how tightly related items sit together, circle packing offers a clear and visually pleasing answer. It suits presentations and dashboards where the audience needs to grasp overall structure and grouping patterns quickly, and where small differences in area values would not change the story being told.
Common Pitfalls
Two frequent design mistakes undermine otherwise solid treemap and circle packing layouts: crowded labels and wasted space. Because both chart types allocate space proportional to a value, the smallest nodes inevitably shrink below the size needed for readable text. Designers often try to force a full label into every node, and the result is overlapping type, clipped words, and a visual jumble that obscures the very hierarchy the chart is meant to reveal. A more reliable approach is to suppress labels below a size threshold and let color, tooltips, or a legend carry the identification instead. Truncation with an ellipsis is another option, though it works best when the first few characters are distinctive.
Beyond labels, margin padding is a persistent source of wasted space. Adding generous gaps between nested rectangles or between packed circles can look tidy, but each pixel of padding comes directly out of the data area, so the chart’s overall density falls and small values become indistinguishable from one another. Padding should be enough to separate levels visually, usually a few pixels, and no more. The same care applies to outer margins: oversized borders or titles that consume a large share of the canvas reduce the resolution available to the data itself. Reviewing a prototype at the smallest expected display size quickly exposes both problems, since labels that overlap at full width rarely survive shrinking, and padding that feels modest on a large screen can dominate a compact one. Testing at real size keeps the emphasis on the data rather than on decoration.
Decision Framework
A practical decision framework turns the choice between treemap and circle packing into a repeatable process. Begin by assessing data depth. Count the hierarchy levels your dataset contains and note how many are meaningful to viewers. Two-level structures with a clear parent-to-child breakdown read well in either layout, while three or more nested levels favor treemaps, where recursive subdivisions avoid the rapid shrinking of inner rings seen in circle packing.
Next, examine audience requirements. Ask what question the chart must answer: precise value comparisons and dense labeling favor treemaps, whereas organic clustering and containment favor circle packing. Consider the audience’s familiarity with data visualization as well. General audiences often find circles approachable, while analysts accustomed to dashboards expect the efficiency of rectangular layouts. Document any need for labels, tooltips, or annotations, since space per node differs sharply between the two forms.
Then evaluate screen constraints. Small screens and narrow dashboard panels reward treemaps, while circle packing’s whitespace is best suited to large sizes. Test both layouts at the smallest dimension your audience will encounter, including mobile cards and embedded widgets. Check whether interactive drill-down, filtering, or hover detail is required, and confirm that hit targets remain usable in the denser option.
Finally, score each candidate against these criteria, prototype with real data rather than placeholders, and validate with a quick reader test. Record the rationale so future charts follow the same standard.
Dashboard Integration
Embedding a nested chart such as a treemap or circle packing into an executive dashboard requires deliberate attention to layout, scale, and visual hierarchy. These charts carry dense hierarchical information, and placing them beside time-series graphs and headline metrics can quickly overwhelm the viewer. A sound starting point is to reserve a dedicated panel for the nested chart rather than mixing it into a grid of unrelated widgets. Giving it a clear boundary, a concise title, and generous white space helps the viewer recognize it as a distinct analytical object. Dashboard composition benefits from sizing the hierarchy chart to match its role: if it serves as a navigational overview, a compact block near the top of the screen works well; if it is the focal point, allocate a larger area and reduce the number of competing elements around it.
Color strategy matters as much as placement. Time-series graphs often use line colors to encode categories, while treemaps and circle packings use fill to represent hierarchy and magnitude. Restricting the nested chart to a restrained palette, or to a single hue with lightness variation, keeps it from clashing with adjacent visuals. Interactive filtering further reduces overload: allowing the viewer to collapse branches or hover for detail means the chart can present a clean silhouette at rest and reveal depth on demand, letting tooltips and drill-down behavior carry the finer labels so dashboard annotations stay minimal.
Finally, align the nested chart with the dashboard’s shared conventions, including typography, spacing, and legend placement. Grouping it logically with related metrics, and using consistent margins across panels, produces a cohesive layout in which the hierarchy chart contributes context without competing for attention.
Frequently Asked Questions
What is the difference between a treemap and circle packing?
A treemap represents hierarchical data as nested rectangles whose areas are proportional to quantitative values, while circle packing uses nested circles to show containment and hierarchy. Treemaps tile the plotting area without gaps, whereas circle packing leaves empty whitespace between shapes.
Which is better for comparing sizes accurately, treemap or circle packing?
Treemaps support quicker and more reliable size rankings because their rectangles align to a shared grid and provide stable reference lines for comparison. Circle packing relies on area judgments for unaligned disks, which the article says are slower and less accurate than length and position judgments.
Do treemaps or circle packing use space more efficiently?
Treemaps use space more efficiently because rectangles share edges, so the total chart area equals the sum of the represented values with no wasted pixels. Circle packing leaves unavoidable empty space between circles and along container borders, and this border waste becomes more pronounced as the circle count grows.
Which chart type handles large datasets better?
Treemaps scale efficiently and tend to remain stable with thousands of data points because each node’s area is computed arithmetically and rendered as a simple quadrilateral. Circle packing is more computationally intensive and can show larger layout shifts when data points are added or removed, making frequent updates harder.
Are treemaps or circle packing better for mobile screens?
Treemaps remain readable and usable at small sizes because their rectangles fill a phone screen edge to edge and reflow for orientation changes. Circle packing’s gaps consume a proportionally larger share of a small viewport, and small nested circles can be difficult to tap or label without overlapping text.
When should I use circle packing instead of a treemap?
Use circle packing when relationships, natural clusters, or containment matter more than precise area measurement—for example in social network analysis, organizational structures, or biological taxonomies. It also suits presentations and dashboards where the audience needs to grasp overall structure and grouping patterns quickly.
Tony Astor
Tony writes about data visualization and the tools people use to build charts and dashboards. More about Data Illustrator