Timeline Chart: How to Show Events in Sequence
 By Tony Astor ·
Timeline Chart
A timeline chart places events in chronological order along a continuous line, usually horizontal, mapping each event to a specific point or span so temporal relationships—before, after, and simultaneous—are immediately apparent. Markers show points in time, while bars of varying lengths show duration, with consistent scaling and labeling keeping intervals proportional and dates easy to read.
Table of Contents
Timeline Chart
A timeline chart places events in chronological order along a continuous line, typically horizontal, to illustrate the sequence and duration of historical or project milestones. Its foundational principle is mapping each event to a specific point or span on the line so temporal relationships—before, after, and simultaneous—are immediately apparent.
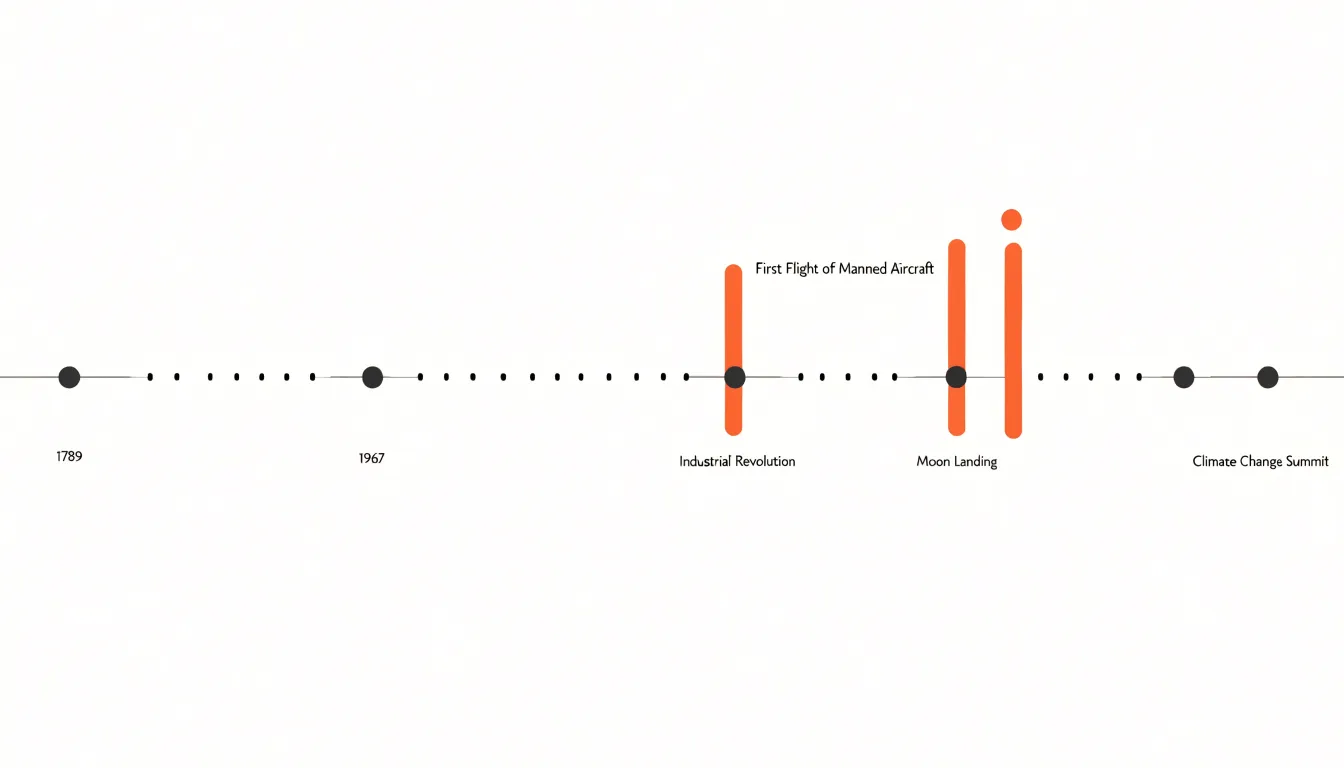
By using markers for points in time and bars of varying lengths for spans, a timeline shows not only when events occurred but also how long they lasted. Progression is depicted through the direction of the axis, usually left to right, guiding the eye through the sequence.
Clarity depends on consistent scaling and labeling so intervals remain proportional and dates are easy to read. In historical contexts, timelines highlight cause-and-effect relationships and major turning points. In project management, they track milestones, deadlines, and phases to support planning and communication. Because the format reduces complex sequences into a linear visual path, it remains accessible to audiences ranging from students to executives.
Timeline Layout
The orientation of a timeline chart shapes how readers move through time and how much information the chart can hold without becoming cluttered.
A horizontal layout arranges events along a left-to-right axis, matching how many readers scan a page and fitting the wide aspect ratio of desktop screens, presentation slides, and printed reports. This orientation works well when the number of events is moderate and each carries a short label, since horizontal space is plentiful while vertical space is constrained. When events cluster closely together, however, horizontal timestamps and descriptions collide, requiring labels to be staggered, rotated, or thinned out to remain legible.
A vertical layout places time along a top-to-bottom axis and uses horizontal width for event descriptions, annotations, and supporting detail. This orientation suits narrow viewports such as mobile screens, where horizontal scrolling is awkward and vertical scrolling is natural. The vertical path also accommodates dense datasets: each event occupies a row with room for longer text, secondary metadata, and inline visuals, allowing the timeline to extend downward indefinitely without zooming or compression.
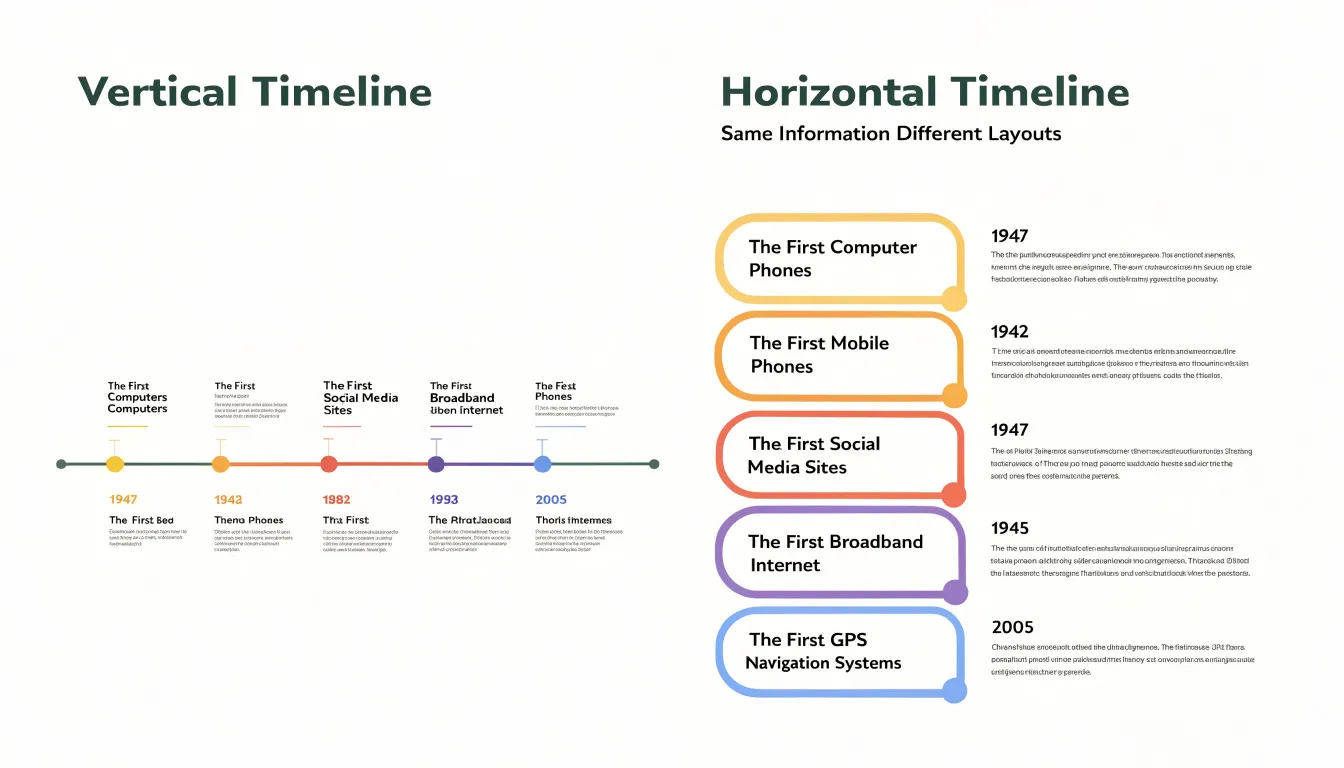
Deciding between the two orientations depends on the delivery medium and data density. Wide, fixed canvases and sparse timelines with brief entries favor horizontal flow. Responsive web pages, handheld devices, and dense timelines with rich entries benefit from a vertical column format that grants each event its own row.
Timeline Data
Organizing timeline data begins with a clean, consistent structure. The most reliable approach is a single flat table where each row represents one event and each column captures a distinct attribute: a date field, an event title, an optional category or grouping, and a description column for longer explanatory text. Keeping one event per row makes the data easy to sort, filter, and format for a visualization tool.
Date formatting requires strict consistency. Choose one standard format for every entry, ideally an ISO-style date (YYYY-MM-DD) or a true spreadsheet date value rather than free text. Consistent dates sort correctly and prevent ambiguity between day-first and month-first conventions. When an event spans a range, store separate start and end date columns instead of placing both into one cell. For events known only to a month or year, a notes column can record that precision level without corrupting the main date field.
Event titles should be short, scannable labels, while detailed descriptions belong in their own column. Mixing narrative text into the title field clutters the chart and complicates sorting. Keep lengthy descriptions plain and free of line breaks that could disrupt import scripts. Adding a unique identifier column also helps when merging datasets or referencing events across documents.
Supplementary columns for category, source, and importance add further utility:
- Category: Enables color-coding or grouping on the finished chart.
- Source: Supports verification of historical or project records.
- Importance: A numeric or sequence field that allows prioritization when many events crowd a tight time window.
Finally, validate the dataset before visualization by checking for missing dates, duplicates, and inconsistent formats, and keep a versioned backup so the underlying data remains traceable as the timeline evolves.
Timeline Scale
Establishing a trustworthy timeline scale begins with choosing a unit of measurement and applying it uniformly across the entire axis. The most common approach maps a fixed visual distance to a fixed span of time, so that one centimeter or one hundred pixels always represents a day, a month, or a decade. Once this ratio is fixed, date positions can be calculated arithmetically rather than placed by eye, removing the inconsistencies that accumulate when marks are nudged into place manually.
Choosing the right unit involves balancing the density of the busiest interval against the overall length of the axis. If the data contains clusters of events separated by long quiet periods, a unit small enough to separate the clustered dates will stretch the quiet periods across a vast space, while a larger unit will compress the clusters. You can resolve this by allowing the chart to grow longer or by breaking the axis into segments.
Consistency also requires a clear rule for calendar irregularities. Because months vary in length, leap years add a day, and daylight saving changes shift clock time, dates should be converted to a single continuous count—such as days since a fixed epoch—before computing spacing. Interval lengths then come directly from subtraction, and the visual gap between two marks is that difference multiplied by the scale factor.
Where an axis must be compressed for practical reasons, an explicit break marker should signal the discontinuity so readers do not mistake the compressed region for a genuinely short interval. Regular gridlines and tick marks reinforce the scale and help readers estimate durations between events.
Timeline Visuals
Timeline visuals rely on icons and color to help viewers parse a sequence of events without reading every label. Strategic iconography acts as visual shorthand for recognizing categories at a glance: a calendar icon beside a product launch, a gavel beside a regulatory milestone, or a person silhouette beside a leadership change signals meaning before the text is processed. Placed consistently along the axis, icons create a visual rhythm that guides the eye and speeds up scanning for specific milestone types.
Color palettes reinforce this grouping and establish visual hierarchy. Assigning distinct hues to categories—such as marketing activities, financial events, and operational changes—lets viewers read the overall sequence of dates and the underlying pattern of categories simultaneously. Within this structure, primary events can be emphasized with stronger saturation or larger markers while secondary events recede into lighter tones. Color also aids navigation across long timelines by helping the eye jump between clusters of related events.
To keep these visual cues accessible, icons should carry text labels or tooltips, and color choices must remain distinguishable for viewers with color vision deficiencies by pairing hues with distinct shapes, patterns, or text reinforcement.
Timeline Milestones
When a project or historical sequence contains dozens of events, milestones serve as anchor points that direct viewers toward the moments that truly mattered. Distinct markers accomplish this by breaking the visual rhythm of the chart. While a standard event dot might be small and muted, a milestone marker can be a diamond, star, or oversized circle rendered in a contrasting accent color. Adding a subtle glow, ring outline, or drop shadow lifts the marker off the background, while neutral grays keep routine events in the background.
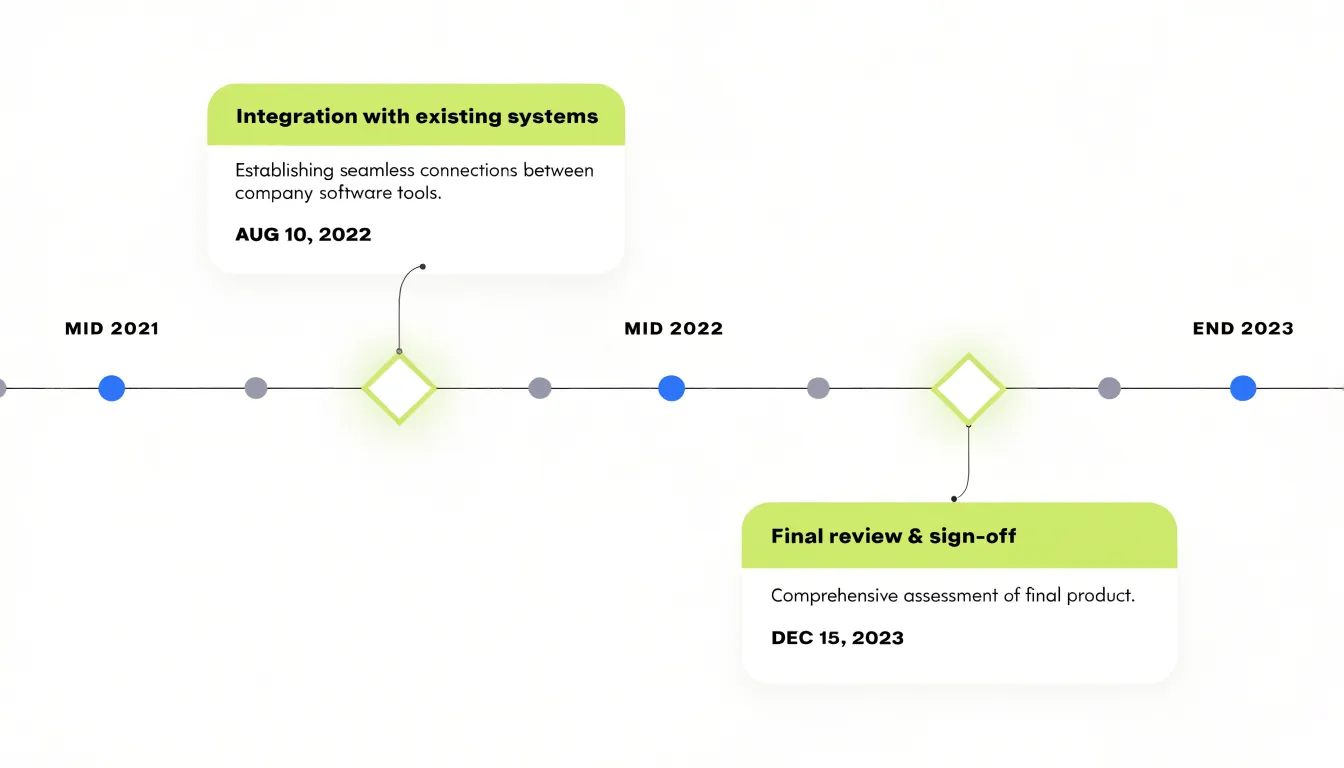
Larger callouts give milestones room to breathe. Instead of a cramped label squeezed beside a minor dot, a milestone callout can occupy a dedicated block with a heading, a short description, and a date in heavier type. These callouts sit above or below the main axis, connected to their markers by a thin leader line or vertical guide line so the exact position in time stays clear. On dense charts, staggering callouts in alternating rows prevents overlap.
Timeline Labels
Timeline labels provide necessary context without overwhelming the layout. Each label should be a short phrase or single sentence that captures what happened, when, and why it matters, using plain language rather than jargon. For example, instead of writing “The implementation of the new policy was initiated on March 15, 2023,” opt for “New policy launched (Mar 15, 2023).”
Placement and formatting maintain visual harmony. Position labels near their corresponding data points without overlapping adjacent elements, and use consistent font sizes and styles throughout the chart. When space is tight, prioritize significant events and use shorter labels or abbreviations for secondary ones so every word earns its place.
Timeline Overlaps
When a timeline includes simultaneous or overlapping events, the layout must give each stream room to be read while keeping their temporal relationships visible.
A common strategy is separating parallel threads into horizontal lanes—one lane per category or actor—so concurrent events sit above or below one another rather than colliding on a single axis. Assign a distinct hue per lane and group related events within it to reduce the cognitive load of tracking multiple streams. Consistent tick marks and vertical gridlines tie the lanes together, letting a reader trace a vertical slice across the chart to see which events coincide.
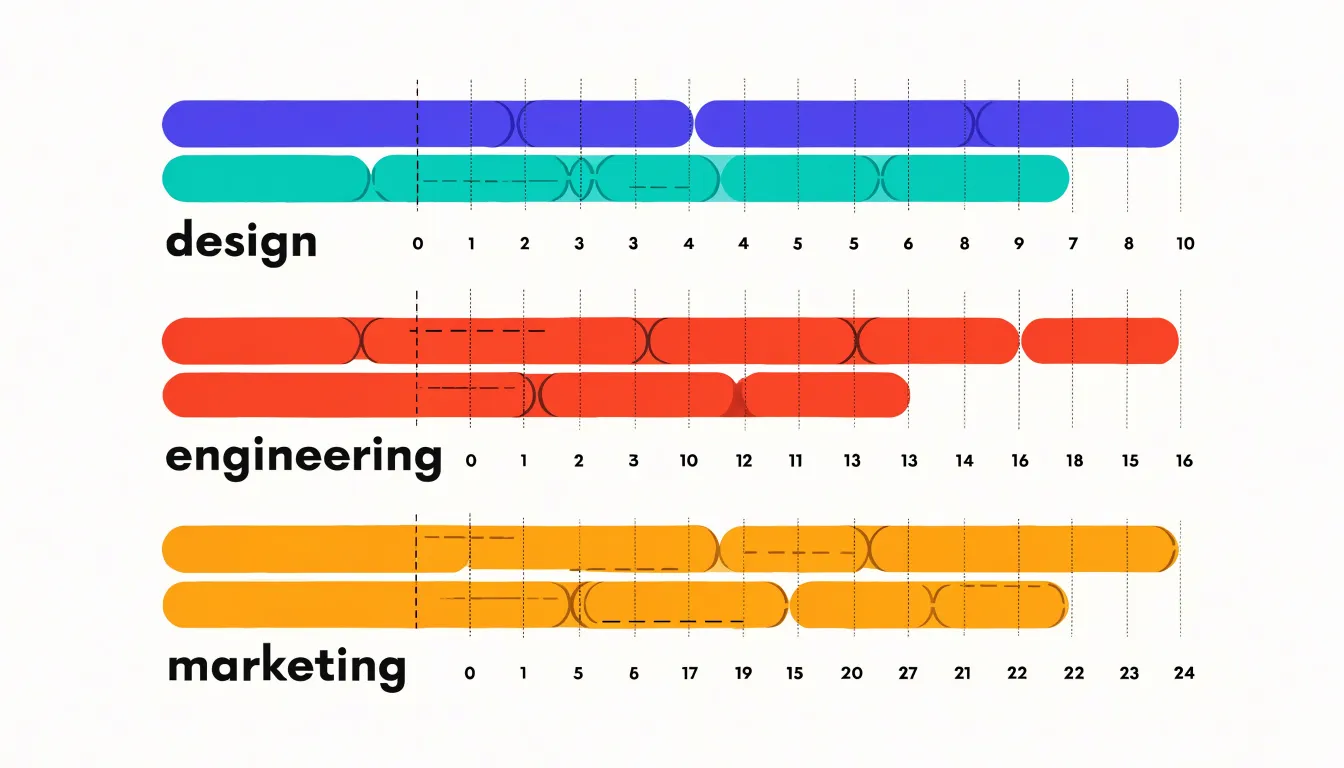
Within a lane, several techniques prevent collisions:
- Staggering: Alternating label heights along a lane preserves the reading sequence while preventing text pileups.
- Offset bars: For spans with different start and end times, bars communicate duration directly, and slight vertical offsets distinguish overlapping spans. Where bars must intersect, transparency or a thin outline keeps both visible.
- Zoom and filtering: In interactive charts, a dense cluster of concurrent events can collapse into a summarized marker that expands on click or hover. Category or actor filters also let readers isolate one thread on demand.
Timeline Branching
Timeline branching splits a single central timeline into two or more distinct tracks that run alongside one another. The split typically begins at a shared origin point—such as a project kickoff, historical event, or decision moment—by drawing a dividing line from the central axis and offsetting each new track by a fixed spacing. Readers can then follow each storyline independently while still perceiving them as related.
This structure suits narratives that unfold concurrently:
- Project planning: A central product timeline can branch into design, engineering, and marketing workstreams, showing how tracks interlock and where they converge at a launch date.
- Historical or biographical storytelling: Branches can display events occurring simultaneously in two regions or institutions, providing context that a single linear sequence would flatten.
- Scenario planning: Branches can represent alternative outcomes stemming from a single decision point, tracing the consequences of each path forward.
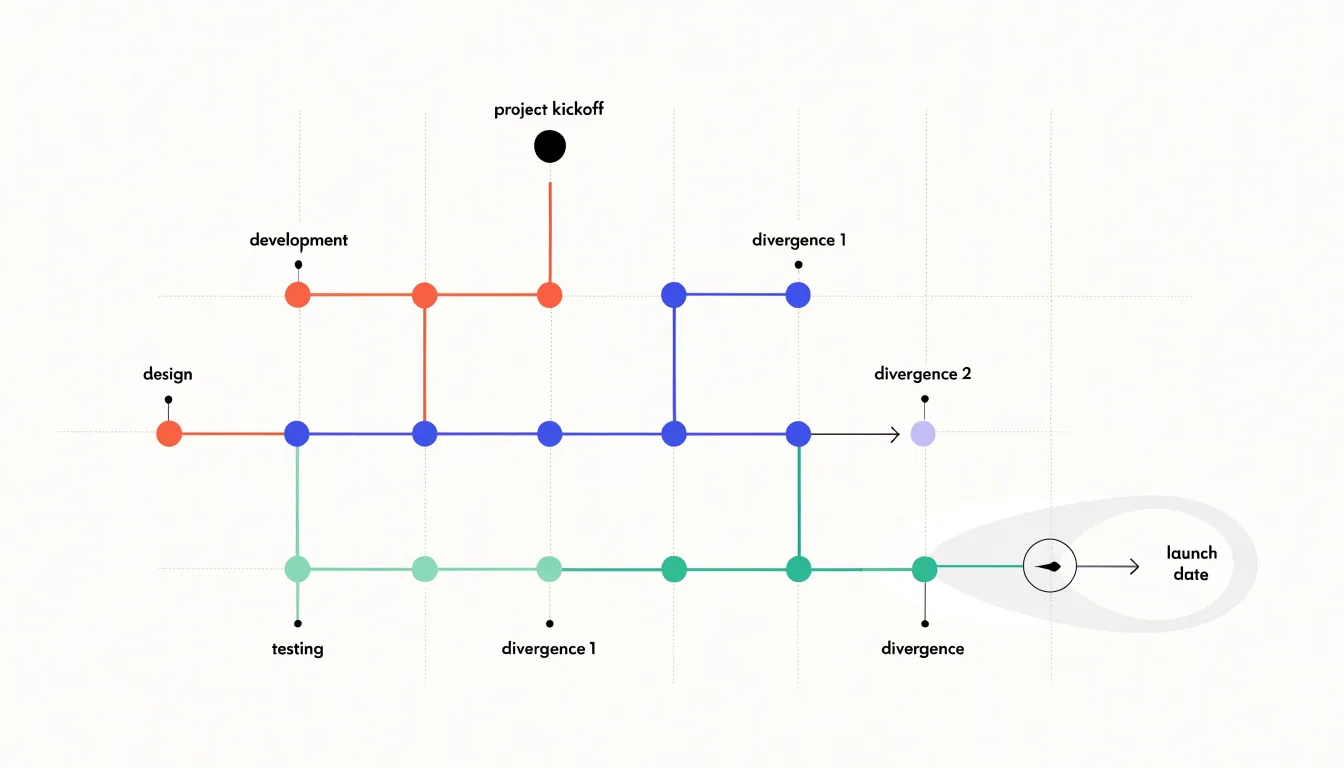
Effective branching depends on clear separation. Give each track a consistent offset, a distinct label at the point of divergence, and a shared time scale so parallel entries align accurately. Reinforce track identity with color or line style, and mark convergence points explicitly where branches rejoin or influence one another. Keep the total number of branches modest so the chart remains easy to scan.
Timeline Color Coding
Color coding lets viewers sort events into meaningful groups without reading every label. Tracing a blue series across a year reveals one department’s activity, while shifting to a green series shows how a second department’s work overlaps or interleaves with the first.
Standardized color schemes make this grouping reliable across multiple charts. If blue always signals engineering deliverables and orange always signals customer-facing launches, readers encountering several timelines in the same report or dashboard can decode new charts with little effort. Many organizations formalize these assignments in a style guide so that colors retain their meaning even when categories are filtered, added, or updated.
Limit the palette to five to eight distinguishable hues that remain legible against the background; beyond that threshold, use secondary cues like shape or pattern for additional distinctions. Place a legend near the chart to anchor each color’s meaning, and use direct labels on the timeline to reinforce the mapping for readers scanning mid-stream.
Timeline Pitfalls
Timeline charts commonly fail due to overcrowding, distorted scaling, and weak hierarchy:
- Overcrowding: Packing too many labels, markers, and annotations into a limited space obscures the sequence. Fix this by including only essential events, grouping minor items into categories, or moving secondary details into interactive hover tooltips.
- Inconsistent time scaling: When visual intervals are not proportional to elapsed time, viewers perceive false patterns or urgency. Keep the axis linear with consistent intervals, or mark any scale breaks explicitly.
- Confusing visual hierarchy: If size, color, and position fail to reflect importance or chronology, the narrative gets lost. Use size and boldness to denote milestone significance, color to categorize, and consistent alignment to show progression, while staggering labels or using callouts to prevent overlap.
Testing a draft timeline with a sample audience helps catch readability and interpretation issues before publication.
Timeline Examples
Timelines adapt to distinct content needs across education, management, and personal storytelling:
- History education: Historical timelines help students visualize cause and effect across centuries. A horizontal layout might use color-coded eras to distinguish the Renaissance from the Industrial Revolution, marking key events with icons or images. A World War II timeline, for instance, can plot major battles, political shifts, and technological developments to show how they interconnected over time.
- Project roadmaps: Gantt charts—a specialized form of timeline—break tasks into phases with start and end dates, dependencies, and milestones. A software development roadmap might display requirements gathering, design, coding, testing, and deployment as overlapping bars, helping teams track concurrent tasks, allocate resources, and communicate status or delays to stakeholders.
- Personal life stories: Biographical or memoir timelines emphasize emotional beats and turning points. A vertical or winding layout can trace a career change or family history across childhood memories, education, career milestones, and family events, leaving room for photos and narrative annotations.
Timeline Review
The review phase serves as the final quality-assurance checkpoint before a timeline is published.
- Verify chronological accuracy: Confirm that every date is parsed consistently, time zones and calendar conventions are applied uniformly, and entries appear in the intended sequence. Cross-reference computed intervals against source values, check for misplaced gaps or overlaps, and ensure axis labels reflect whether proportional or categorical spacing was used.
- Check text elements: Ensure labels sit close to their markers without colliding with adjacent lines or dots. Confirm that date formats match throughout and abbreviations are expanded where needed for clarity. Align titles, axis captions, and annotations to a consistent baseline, and verify the placement of callout anchors and legends.
- Assess visual balance: Step back to evaluate the distribution of marks, white space, and text weight. A dense cluster on one side may require adjusted spacing, repositioned labels, or a wider canvas. Check margins, connector line lengths, and the prominence of headings versus data so neither cramped clusters nor empty regions throw off the composition. Review the chart at both full size and reduced scale to catch detail and layout issues.
Timeline Export
Choosing the right export format and resolution ensures the finished timeline stays crisp across its target medium:
- Print (reports, posters, handouts): Use vector formats like PDF or SVG to preserve sharp edges and text at any size. If a printer requires a raster file, export at 300 DPI at the final printed dimensions and convert the color mode to CMYK.
- Web embedding: Use PNG or SVG in RGB mode at 72 to 96 PPI (higher resolutions only inflate file size on screens). PNG handles detailed graphics and transparency well, while SVG stays lightweight and scales infinitely across responsive layouts.
- Presentation slides: Export high-resolution PNG files at 150 to 192 PPI for sharp projection on large displays without bloating the deck, or embed an SVG or EMF file where the slide software supports it to keep the graphic editable and sharp.
Name export files clearly with the date included for version control, and preview the file on its intended medium—paper, browser, or projector—before sharing it widely.
Timeline Overview
A timeline overview dashboard gives decision-makers a compact summary of project status relative to the planned schedule without requiring them to dig through detailed task records.
Start by placing key quantitative metrics in a prominent row of numeric tiles with clear labels and trend indicators:
- Total elapsed time versus plan
- Count of milestones completed on schedule
- Number of milestones currently at risk of slipping
- Average delay across completed items
Below the metrics, build a horizontal visual strip plotting recent milestones and using color to distinguish completed, in-progress, and upcoming events. Pair this strip with a short list of recently achieved milestones, including dates and owners, to convey momentum and accountability.
Keep the dashboard free of dense tables and fine-grained task data, which belong in the full timeline view. Include a brief annotation area where the project lead can flag one or two items requiring executive attention, such as a shifted milestone or an upcoming dependency, and connect the dashboard to refresh automatically from the underlying timeline data between meetings.
Frequently Asked Questions
What is a timeline chart used for?
A timeline chart places events in chronological order along a continuous line to show the sequence and duration of historical or project milestones. It helps highlight cause-and-effect relationships in history and track milestones, deadlines, and phases in project management.
Should I use a horizontal or vertical timeline layout?
Use a horizontal layout for wide, fixed canvases and sparse timelines with brief entries, such as desktop screens, slides, and printed reports. Use a vertical layout for narrow viewports like mobile screens and dense timelines with longer descriptions and supporting detail.
What data structure should I use to build a timeline?
The most reliable approach is a single flat table where each row represents one event and each column captures a distinct attribute, such as date, event title, optional category, and description. Keep dates in one consistent format and store event ranges as separate start and end date columns.
How do I choose a timeline scale?
Choose a unit of measurement and apply it uniformly across the entire axis, fixing a ratio so date positions can be calculated rather than placed by eye. Balance the unit against the busiest interval and overall axis length, and mark any compressed axis break explicitly.
How can I make timeline colors accessible?
Use a limited palette of five to eight distinguishable hues and place a legend near the chart to anchor each color’s meaning. Pair hues with distinct shapes, patterns, or text reinforcement so color choices remain distinguishable for viewers with color vision deficiencies.
What are common timeline chart pitfalls?
Common pitfalls include overcrowding, inconsistent time scaling, and confusing visual hierarchy. Fix overcrowding by including only essential events or moving secondary details into tooltips, keep the axis linear or mark scale breaks, and use size, color, and alignment to reflect importance and chronology.
Tony Astor
Tony writes about data visualization and the tools people use to build charts and dashboards. More about Data Illustrator