Tableau Alternatives for Charts and Dashboards
 By Tony Astor ·

Tableau Alternatives for Charts and Dashboards
Power BI, Looker, Qlik Sense, Domo, Metabase, Apache Superset, Looker Studio, Zoho Analytics, Sisense, Klipfolio, Redash, Mode Analytics, and ThoughtSpot are the leading Tableau alternatives for charts and dashboards. They range from free open-source tools to enterprise platforms, differing in pricing, data modeling depth, real-time connectivity, embedding support, and ease of use for technical vs. business users.
Table of Contents
Power BI
Power BI is a primary Tableau alternative, particularly for organizations invested in Microsoft technology. As Microsoft’s flagship reporting and dashboarding platform, Power BI connects natively with Excel, Azure, SQL Server, SharePoint, and Teams, letting teams pull data from existing sources without building complex custom connectors. Reports published to the Power BI service can be embedded directly in Teams channels or SharePoint pages, giving colleagues a single place to view metrics alongside daily work. Row-level security and workspace permissions integrate with existing Azure Active Directory identities, so access management follows corporate system rules.
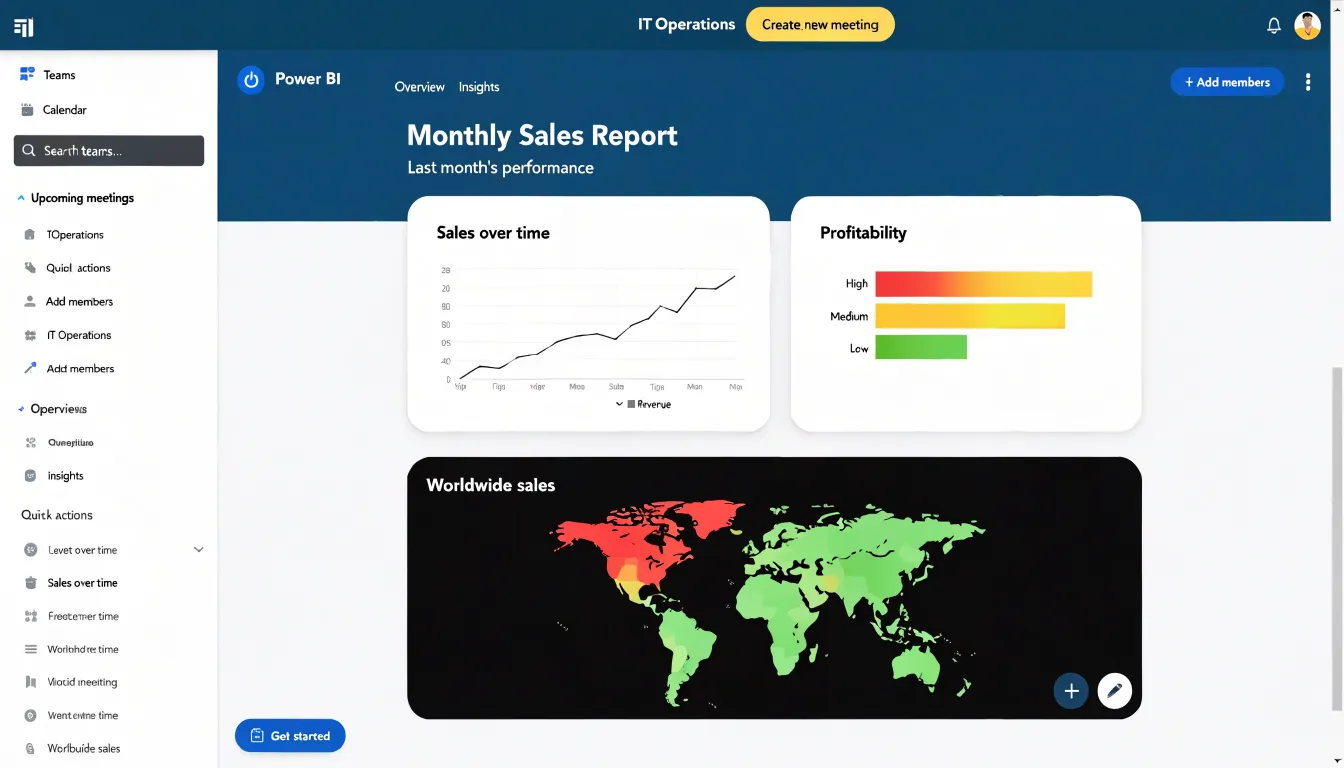
Data modeling is one of Power BI’s strongest capabilities. The platform includes Power Query for shaping and transforming data before it reaches the report layer, and it supports a full relational model with relationships, calculated columns, and DAX measures for sophisticated calculations. Analysts can build star schemas, define hierarchies, and reuse datasets across multiple reports, keeping definitions consistent as dashboards multiply. This modeling depth allows enterprise teams to handle large datasets and complex business logic within the tool, while the desktop authoring experience gives developers fine-grained control over data flow from source to visual.
Pricing keeps Power BI accessible for teams of varying sizes. A free desktop version supports individual authoring, while per-user Pro licenses cover standard sharing and collaboration. Organizations with heavier distribution needs can use Premium capacity to serve large audiences without licensing every viewer individually. Because the platform is bundled into many existing Microsoft agreements, the incremental cost for enterprises already paying for Microsoft 365 is often modest, making it straightforward to extend reporting to more departments. This combination of ecosystem fit, modeling power, and predictable cost makes Power BI a common choice for enterprise dashboard programs.
Looker
Looker, now part of Google Cloud, approaches analytics through a modeling layer between the data warehouse and the end user. This layer is defined using LookML, a proprietary language that describes dimensions, measures, joins, and relationships. By centralizing these definitions, Looker ensures that every chart, dashboard, and exploration draws from a single, governed source of truth. Teams do not need to replicate business logic across multiple reports or rely on ad-hoc SQL; instead, they maintain one canonical model that propagates consistently throughout the organization.
LookML models are version-controlled, reviewable, and reusable, meaning changes to metrics or business rules can be audited and rolled out systematically. This centralized approach reduces the risk of conflicting numbers and simplifies compliance with data policies. At the same time, Looker supports exploratory data analysis. Users can start from a curated dashboard and drill into granular details, pivot across dimensions, and create new visualizations without writing SQL. The underlying LookML model enforces row-level security and access controls, keeping exploration within safe boundaries.
Looker’s architecture pushes computation to the data warehouse, leveraging the scalability of Google BigQuery and other supported databases. This design allows for real-time analysis on large datasets without extracting data into a separate engine. For organizations invested in Google Cloud, Looker integrates seamlessly with services like BigQuery, Dataflow, and Vertex AI, enabling a cohesive analytics stack. This combination of governed self-service and elastic compute addresses dashboard sprawl and metric drift for enterprise teams prioritizing data consistency.
Qlik Sense
Qlik Sense is built around an associative engine that changes how users explore data. Rather than relying on predefined query paths or rigid hierarchies, the engine maintains a full map of associations across every field and table in the data model. When a user makes a selection, the engine immediately recalculates which values are related, which are excluded, and which remain possible. This surfaces indirect relationships that might stay hidden in conventional dashboard tools built around filtered queries. Clicking a single value highlights connected data across the entire model, showing how a product, region, or time period links to seemingly unrelated metrics. Visual cues for selected, optional, and excluded values give a live picture of the data’s structure, supporting discovery-oriented analysis and helping analysts ask better follow-up questions.
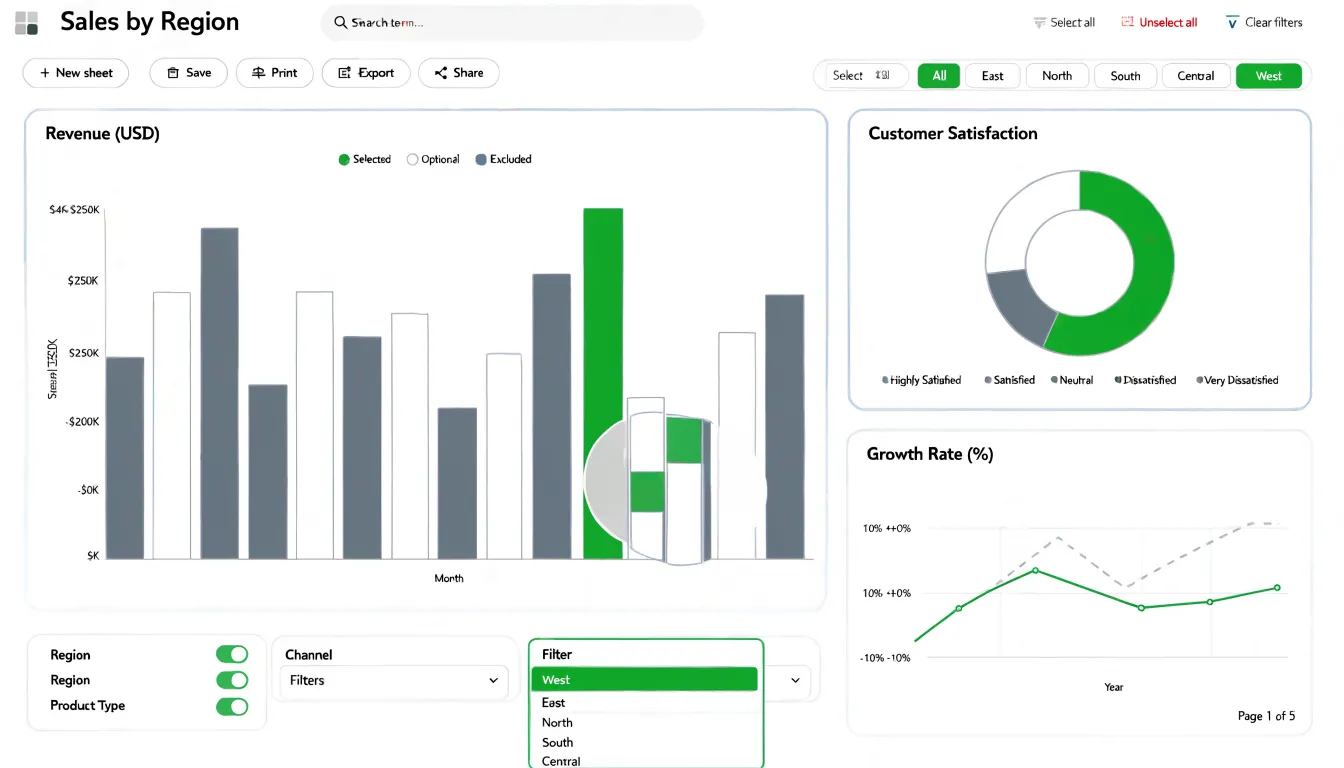
The dynamic chart environment complements this associative behavior. Visualizations respond to selections in real time, so bars, lines, scatter plots, and KPI objects update together as users narrow or broaden their focus. Users can build sheets with a mix of chart types and rearrange them through drag-and-drop interactions, while responsive rendering keeps the interface fluid even with large data volumes. This combination of associative search and interactive visualization supports investigative analysis, ad hoc reporting, and complex datasets where the goal is often to uncover patterns rather than confirm a single known metric, allowing business users to move quickly between overview and detail without losing context.
Domo
Domo approaches dashboards from a cloud-first perspective, treating live connectivity to dispersed data sources as the platform’s foundation. Rather than relying on scheduled overnight extracts, Domo maintains persistent connections to cloud applications, warehouses, and databases so dashboards reflect current conditions as events occur. This architecture suits organizations whose operational picture changes hourly and whose leaders need to act on immediate signals.
The platform offers hundreds of prebuilt connectors covering major cloud data warehouses, business applications, and marketing platforms, alongside tooling for custom APIs and file-based sources. Once connected, Domo’s cloud data pipeline handles ingestion, transformation, and storage, allowing builders to blend information from multiple systems without managing separate ETL infrastructure. Executive dashboards can draw together financial metrics, sales pipelines, and operational KPIs that otherwise live in separate tools.
Real-time alerting is a distinguishing capability. Users define thresholds and conditions against live data, and Domo pushes notifications through email, mobile apps, and chat integrations when those conditions are met. This turns dashboards into active monitoring instruments where anomalies reach decision-makers automatically. Mobile access extends this experience to phones and tablets so alerts and dashboards travel with executives.
Domo’s cloud infrastructure maintains performance at scale by distributing query workloads and caching frequently accessed datasets to keep large dashboards responsive. Governance features, including row-level security, permission controls, and audit trails, help organizations share sensitive metrics safely across departments. The result is a platform oriented toward continuous operational monitoring rather than periodic review.
Metabase
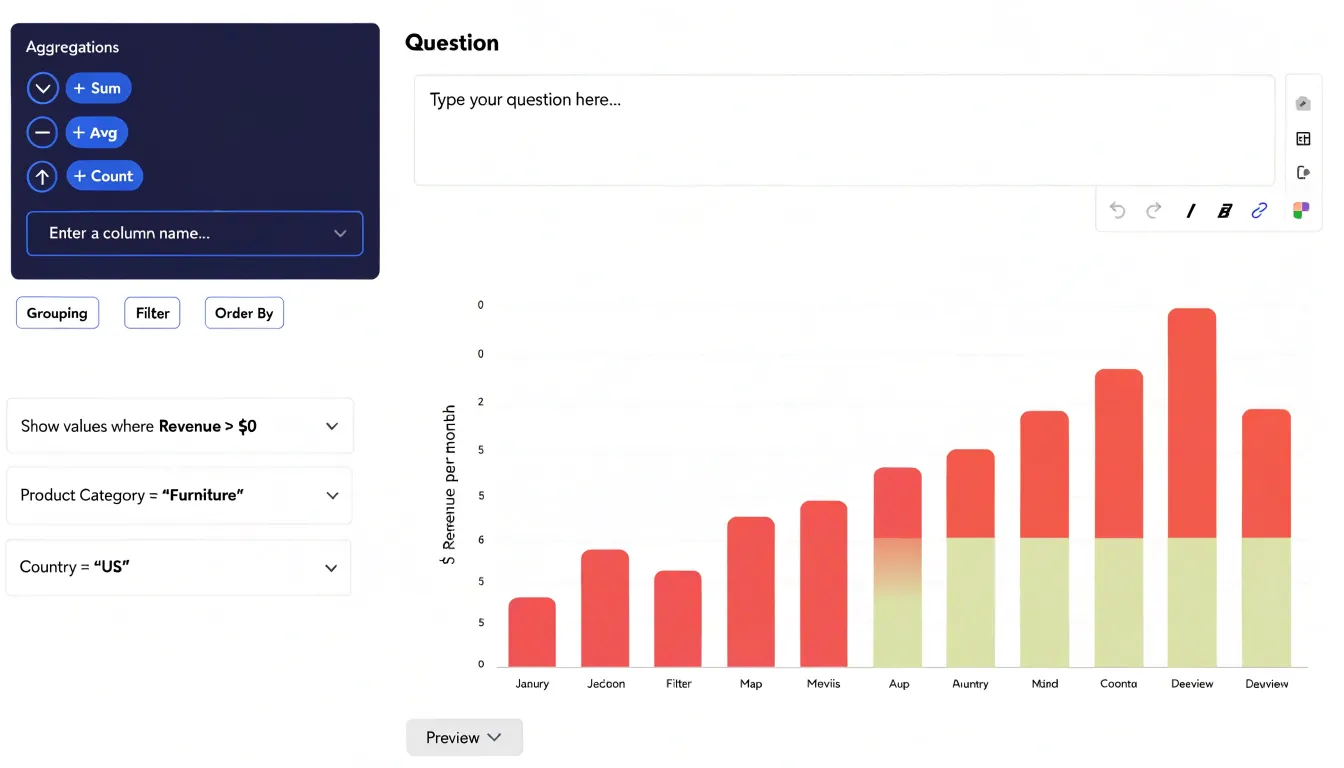
Metabase is an open-source business intelligence tool designed to make data exploration accessible across the skill spectrum. Its web-based interface lets non-technical users build visual queries without writing code. The query builder uses simple dropdown menus to select a database table, apply filters, choose aggregation methods, and group results, enabling anyone to generate charts and dashboards quickly without relying heavily on technical teams.
For advanced analysts, Metabase offers a native SQL editor to write custom queries against connected databases, providing full control over complex logic, joins, and performance tuning. These SQL queries can be saved as questions and added to dashboards, sharing sophisticated analyses across the organization. This dual interface lets teams start with visual queries and incorporate SQL as needs grow without switching tools.
Setup is straightforward, connecting to common databases like PostgreSQL, MySQL, and BigQuery through a simple configuration process. Metabase can be self-hosted via Docker or JAR file, or used through Metabase Cloud. The free open-source edition includes core features like dashboards, alerts, and embedding, offering quick time-to-value and low training overhead by combining visual and SQL workflows in one platform.
Apache Superset
Apache Superset is an open-source data exploration and visualization platform designed to handle massive scale, custom charts, and modern data warehouses without proprietary licensing or vendor lock-in. Built for performance, its architecture queries large datasets directly from source systems and renders results quickly for organizations with substantial data volumes.
Superset offers a SQL-based query interface, a no-code visualization builder, and a wide set of standard chart types. Users can also create custom charts using plugins to meet specific visualization needs beyond the default library.
The platform connects natively to modern data warehouses such as Snowflake, BigQuery, Redshift, and PostgreSQL, alongside traditional databases, performing live queries on existing infrastructure without extensive data duplication. Advanced features include a lightweight semantic layer for defining metrics and dimensions, row-level security, and granular dashboard permissions.
As an Apache Software Foundation project, Superset is actively maintained by a large open-source community, providing a scalable, customizable, and cost-effective alternative to commercial BI tools.
Looker Studio
Looker Studio, formerly Google Data Studio, gives small businesses and digital marketers a free path into polished visual reporting. A user can sign in with an existing Google account and begin building a report within minutes, lowering the barrier for teams on tight budgets.
Looker Studio’s primary strength is its native integration with Google’s ecosystem. Reports pull live data directly from Google Analytics, Google Ads, Search Console, Google Sheets, and BigQuery, eliminating manual exports or copy-and-paste updates. A small business tracking website traffic, ad performance, and campaign results can assemble that information in one view that updates automatically as underlying data changes.
The beginner-friendly interface offers a drag-and-drop layout, a chart library, and pre-built templates. Digital marketers can assemble client-facing reports combining scorecards, time-series charts, and geographic maps, styled with brand colors and logos. Sharing works through links or scheduled email delivery, suiting agencies that send regular client performance summaries. Looker Studio provides a no-cost foundation for visual reporting that scales with a team’s data needs.
Zoho Analytics
Zoho Analytics focuses on small and midsize businesses seeking dependable dashboards without a heavy financial commitment. Its pricing scales gently across user tiers, letting a growing company add analysts and viewers gradually rather than absorbing a large upfront licensing cost. Automated data preparation tools handle routine cleaning, column type detection, and scheduled refreshes, reducing time spent wrangling spreadsheets.
A wide library of native connectors supports cross-departmental reporting. Marketing can pull campaign metrics from advertising platforms, sales can sync CRM pipelines, finance can connect accounting software, and operations can bring in inventory or support data within a single workspace. Feeding shared dashboards from these sources lets department heads view their numbers alongside company-wide context, reducing the friction of reconciling separate reports before meetings. Scheduled email digests and embedded links circulate updates to stakeholders who rarely log into an analytics tool.
Zoho Analytics also incorporates AI-assisted features like natural language querying and automated insight generation, surfacing trends and anomalies without requiring complex formulas or calculated fields. For SMBs where staff wear multiple hats, these features lower the analytical skill barrier. The platform fits naturally into organizations already using Zoho’s business applications, while its connector range supports mixed software environments as well.
Sisense
Sisense is built to embed analytics directly inside client-facing SaaS applications rather than using a separate reporting portal. It exposes a full set of APIs and SDKs so development teams can embed interactive charts, dashboards, and widgets directly into their own interfaces. End users interact with live data inside the host product’s layout without encountering Sisense branding.
White-labeling lets teams strip away Sisense’s visual identity and apply custom themes, colors, logos, and typography so embedded analytics look like a native application feature. Access controls pass through from the host application’s authentication layer, enforcing row-level permissions so each customer sees only their entitled data. This tenant-aware approach suits multi-tenant SaaS environments where thousands of end users share a single deployment but require isolated views.
Beyond standard charts, Sisense supports custom visualization development for bespoke chart types or interactive components. It includes tools for handling large data volumes and composing queries across multiple sources to keep embedded charts responsive as datasets grow. Developers can configure filtering, drill-downs, and cross-widget highlighting to give end users exploratory control.
Operationally, the embedding model relies on JavaScript integration and server-side APIs, supporting cloud and on-premises deployments. For SaaS companies treating analytics as a product differentiator, Sisense lets developers focus on integration and customization rather than building a charting engine from scratch.
Klipfolio
Klipfolio is designed to give teams a fast, clear view of daily operational metrics. Its architecture centers on Klips—small data components that pull metrics from spreadsheets, databases, analytics APIs, or marketing platforms. A manager can visually connect a data source, choose a metric, arrange Klips onto a dashboard by team or function, and publish without writing code or waiting on a data team.
This focus on KPI tracking shapes its feature set. Klips refresh on user-controlled schedules suited to hourly or daily operational monitoring. Visual options lean toward gauges, single-value tiles, sparklines, and simple bar or line charts that communicate status at a glance rather than supporting deep exploration. Thresholds and conditional color coding flag metrics that drift outside expected ranges, while date, region, or team filters and annotations let users add context to unusual spikes.
Dashboards can be embedded in internal portals, pushed to office TVs, or scheduled as email snapshots, with role-based permissions restricting sensitive metrics. A template library covering sales pipelines, support volume, and website traffic shortens setup time for teams focused on repeatable performance checks.
Redash
Redash is built around SQL as the primary interface for accessing data. Teams connect Redash to databases or warehouses and write queries directly using an editor with syntax highlighting, autocomplete, and schema browsing. Query results appear immediately as a table, which users can convert into a chart, pivot table, or counter by adjusting axes and groupings through form controls rather than code. This tight loop between querying and visualizing suits iterative exploration.
Collaboration happens through a shared query repository where team members can open, fork, and modify saved work. Each query maintains a version history for reviewing changes and restoring older versions, alongside comment threads for discussing refinements directly next to the SQL. Access can be scoped per query to control viewing and editing permissions.
Dashboards are assembled by dropping saved query visualizations onto a grid. Widgets refresh on a schedule, and non-technical viewers can adjust parameters, date ranges, or filters on the dashboard without touching the underlying SQL. Dashboards can be shared via links or scheduled for delivery to email and chat tools.
Mode Analytics
Mode Analytics unifies tools that advanced data teams typically use in separate environments. At its core is a SQL editor for querying connected data warehouses like Snowflake, BigQuery, Redshift, and PostgreSQL, previewing results inline, and building interactive charts and dashboards. Mode’s distinguishing feature is its integrated notebook environment, where analysts embed Python or R code alongside SQL queries to perform statistical analysis, build predictive models, or run complex transformations. Code output flows into the same report as query results, combining raw tables, model outputs, and custom visualizations in a single document.
This workflow suits programming-savvy analysts moving between querying, analysis, and presentation. Keeping everything in one interface shrinks the handoff between data engineering, analysis, and reporting, while versioned, re-runnable notebooks and queries keep reports reproducible against fresh data. For analytical organizations, Mode treats SQL and code as first-class citizens, creating reports that double as working documents with visible, editable logic.
ThoughtSpot
ThoughtSpot replaces the drag-and-drop canvas with a search bar. Users type questions in plain business language—such as revenue by region over the last four quarters—and the natural language query engine parses the request, maps terms to the underlying data model, and returns an interactive chart within seconds. Non-technical users get immediate answers without learning a query language, while analysts can quickly explore unfamiliar datasets.
Rather than starting from a blank grid, users build dashboards by saving useful searches and pinning them to a live board that refreshes against source data. Because every answer originates from the same semantic layer, metric definitions stay consistent across the organization. ThoughtSpot’s AI layer also surfaces suggested follow-up questions and highlights anomalies automatically.
This instant graph workflow benefits casual data consumers in sales operations or finance who need quick answers rather than bespoke visual design. The tradeoff is less pixel-level control over layout and formatting compared to traditional charting tools. ThoughtSpot supports cloud and on-premises deployment with row- and column-level governance for regulated industries.
Platform Comparison
When evaluating visualization tools, pricing is the first dimension to examine. Tableau uses per-user subscription pricing that climbs quickly as teams expand, particularly when Creator licenses are required for development. Alternatives range from flat-rate subscriptions and usage-based models to free open-source options. Mapping expected user counts against each vendor’s tier structure reveals the true total cost of ownership.
Ease of use and technical complexity shape daily workflows and infrastructure needs:
- Skill requirements: Some platforms require understanding data modeling, joins, calculated fields, and query logic, suiting dedicated analysts. Others emphasize drag-and-drop interfaces and guided workflows for business users in marketing or operations.
- Infrastructure: Self-hosted solutions demand server maintenance, security updates, and IT involvement, whereas cloud-native platforms shift that burden to the vendor. Native connectors to existing databases and spreadsheets also reduce setup effort.
- Target use cases: Enterprise environments with strict governance and large user bases often justify robust platforms with granular permission controls. Smaller teams producing recurring reports may prefer lighter, more affordable tools, while organizations building client-facing applications should prioritize embedded capabilities and scalability.
Frequently Asked Questions
Is Power BI a good Tableau alternative for organizations using Microsoft technology?
Yes. Power BI is described as a primary Tableau alternative, particularly for organizations invested in Microsoft technology, with native connections to Excel, Azure, SQL Server, SharePoint, and Teams. Reports published to the Power BI service can also be embedded directly in Teams channels or SharePoint pages.
How does Looker keep charts and dashboards consistent?
Looker uses LookML, a modeling layer that centralizes definitions for dimensions, measures, joins, and relationships so every chart, dashboard, and exploration draws from a single governed source of truth. These models are version-controlled, reviewable, and reusable.
What makes Qlik Sense different for data exploration?
Qlik Sense is built around an associative engine that maintains a full map of associations across fields and tables. When a user makes a selection, it recalculates related, excluded, and possible values and updates visualizations in real time.
Does Domo support real-time alerts?
Yes. Domo lets users define thresholds and conditions against live data, and it pushes notifications through email, mobile apps, and chat integrations when those conditions are met.
Is Metabase suitable for both non-technical users and SQL analysts?
Yes. Metabase’s web-based interface lets non-technical users build visual queries without writing code, while advanced analysts can use a native SQL editor for custom queries against connected databases.
Are there free Tableau alternatives mentioned in the article?
Yes. Looker Studio is described as a free path into visual reporting for small businesses and digital marketers, Metabase has a free open-source edition with core features, and Apache Superset is an open-source platform without proprietary licensing or vendor lock-in.
Tony Astor
Tony writes about data visualization and the tools people use to build charts and dashboards. More about Data Illustrator