Sunburst Chart: Visualizing Hierarchies in Rings
 By Tony Astor ·

Sunburst Chart
A sunburst chart is a radial visualization that displays hierarchical data as concentric rings, where the center is the root and each outer ring represents a deeper level. Arc angles are proportional to quantitative values, preserving part-to-whole relationships across levels. It suits multi-tier breakdowns that a pie chart cannot show in one view.
Table of Contents
Sunburst Chart
A sunburst chart organizes hierarchical information as a set of concentric rings, with each ring representing one level of depth. The center holds the root of the structure—the single category from which everything else descends. Moving outward, each successive ring corresponds to the next level of granularity, so that a child node appears as an arc positioned within the angular span of its parent. This radial layout means any slice can be read from the middle outward as a path of descent: root, then child, then grandchild, and so on toward the outer edge.
The angle allocated to an arc typically reflects a quantitative value such as count, budget, or proportion, so the size of a wedge communicates magnitude while its position in the ring system communicates ancestry. Because children are drawn directly adjacent to their parent’s arc, the chart preserves the containment relationships that define hierarchical data. In an organizational chart, for example, a large department appears as a broad arc in the first ring, its sub-teams appear as smaller arcs nested within that same angular region in the second ring, and individual roles occupy the outermost ring. Deeper levels continue this pattern, producing a visual impression of branching outward from the center.
The number of visible rings tells the viewer how many levels of the hierarchy are displayed, and the width of the outermost segments reveals how finely the structure has been subdivided. This makes sunburst charts especially useful for showing part-to-whole relationships that repeat at multiple scales, allowing a viewer to trace a single path from a broad category down to its most detailed components without losing sight of the overall structure.
Concentric Rings
Each concentric ring enforces a strict geometric containment rule: every segment in an outer ring is positioned directly beneath its parent segment in the adjacent inner ring, and its angular span is proportional to its share of the parent’s total. Because the rings are concentric, the chart preserves overall composition at every level. The total of all segments in any complete ring equals the total of the root, and each parent’s angular extent equals the sum of its children’s extents.
Interpreting this structure requires reading both radially and angularly:
- Radial scan (center to edge): Reveals the drill-down path and full breakdown for a specific branch.
- Angular scan (around a single ring): Compares sibling items at the same hierarchical level.
While this layout makes multi-level part-to-whole relationships clear, it also means that deeper rings can become visually thin and harder to label as the number of categories grows.
Inner and Outer Rings
The innermost ring occupies the core of the chart and represents the highest level of the hierarchy—the macro categories that frame everything else. When a viewer first encounters the chart, this core ring serves as the starting anchor, offering an immediate sense of which top-level groupings dominate and which occupy smaller portions of the overall space.
From this central anchor, readers should establish context at the center and then trace outward along the wedges most relevant to their question. The second ring breaks each core segment into its constituent subcategories, and subsequent rings continue this subdivision until the outermost ring presents the finest available level of detail. Color and labeling typically reinforce the correspondence between a parent segment and its children, helping the eye stay within one branch. When outer segments become thin and tightly packed, zooming or filtering usually helps keep the granular detail from overwhelming the macro picture.
Color Choices
Color is one of the most effective tools for guiding the reader through a radial hierarchy. A practical approach begins with assigning a distinct hue family to each main parent branch in the innermost ring. This gives viewers an immediate visual anchor to locate a major branch at a glance and track it across the circle. Best practices suggest choosing a palette of well-separated hues—such as blue, orange, green, and purple—that remain distinguishable for viewers with common forms of color vision deficiency. Limiting the number of top-level hues to roughly five to seven keeps the chart legible, since too many competing colors create visual noise and weaken the grouping effect.
Once parent hues are established, child slices within each branch should be rendered using monochromatic gradients derived from the parent color. A common technique is to assign the deepest or most saturated shade to the parent ring and progressively lighten the tint as the hierarchy descends toward the outer edge. This creates a natural sense of depth while preserving the family resemblance among all slices belonging to the same lineage.
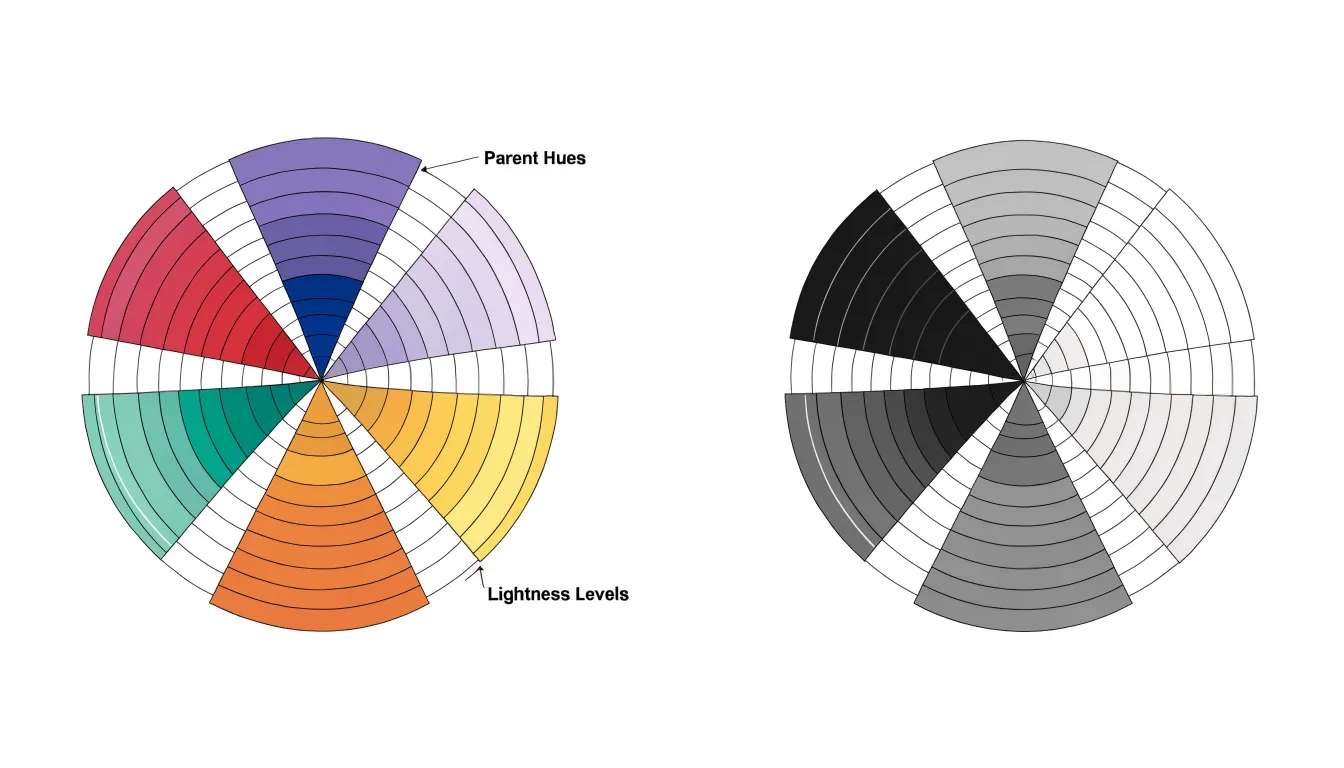
Consistency across gradients matters as much as the choice of hues:
- Maintain even steps: Lightness steps of around 10 to 15 percent generally provide enough separation to prevent adjacent child slices from appearing identical without producing jarring transitions.
- Ensure text contrast: When labels or tooltips are placed directly on slices, verify sufficient contrast between the text and background shade.
- Test in grayscale: Checking the final palette in grayscale reveals whether the lightness progression still distinguishes levels, offering a useful safeguard for printed or low-fidelity reproductions.
Interactive Exploration
Interactive features turn a static sunburst chart into a working instrument for discovery, resolving the tension between showing a clean overview and providing granular detail.
- Click-to-drill-down: When a user selects a segment, the chart promotes that branch toward the center, revealing its children in greater detail. Drill-down animations support this transition by interpolating segment angles and radii between states, so the viewer can follow exactly where the selected branch moved and how it expanded. Without that animated continuity, each click produces a jarring redraw; with it, the hierarchy feels like a physical object being rearranged.
- Hover tooltips: Because a sunburst packs many small segments into a confined radial space, static labels for every arc quickly become unreadable. Tooltips keep the overview clean while surfacing an arc’s name, exact value, percentage of parent, and depth in the hierarchy on demand.
- Dynamic zooming: Rotating or scaling the view through scroll gestures or dedicated controls lets users inspect dense outer rings where segments shrink to slivers. Smoothly animated zoom keeps spatial context intact, so users retain a sense of where they are within the whole even as they magnify a small region.
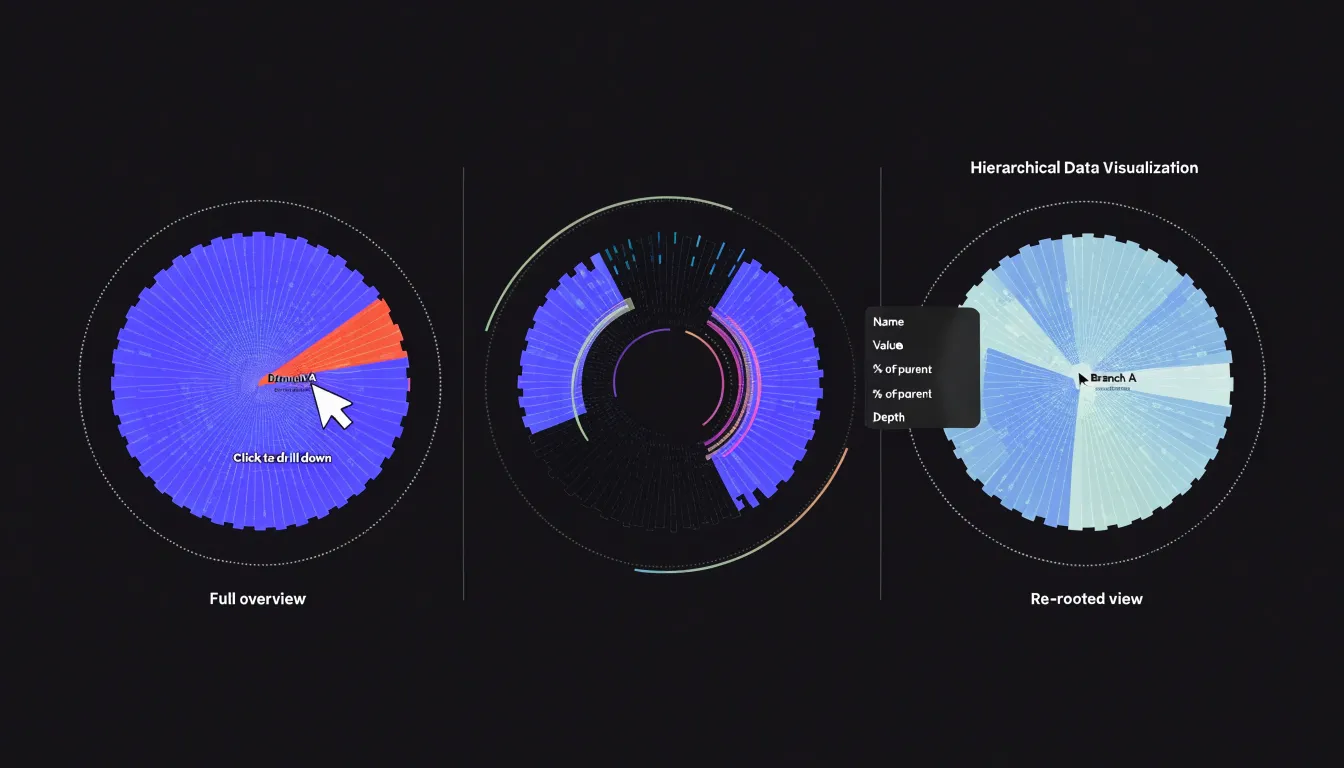
Together these features shorten the path from question to answer: a viewer wonders which subcategory drives a large branch, clicks it, watches the branch expand, hovers for the exact figure, and zooms to compare siblings.
Sunburst vs Pie Chart
A pie chart communicates proportion at a single level: each slice represents a share of one whole. A sunburst chart takes the same radial logic and extends it outward through concentric rings, allowing a single visualization to carry proportion across multiple relational tiers at once.
Suppose a company wants to show revenue by region, then by product line within each region, and finally by individual product within each line. A pie chart can display only the regional split; showing the product breakdown would require a separate chart for every region, forcing readers to hold several images in mind and compare across them. A sunburst presents all three tiers in one frame: the inner ring shows regional share, the middle ring shows how each region’s revenue divides among product lines, and the outer ring shows the products themselves.
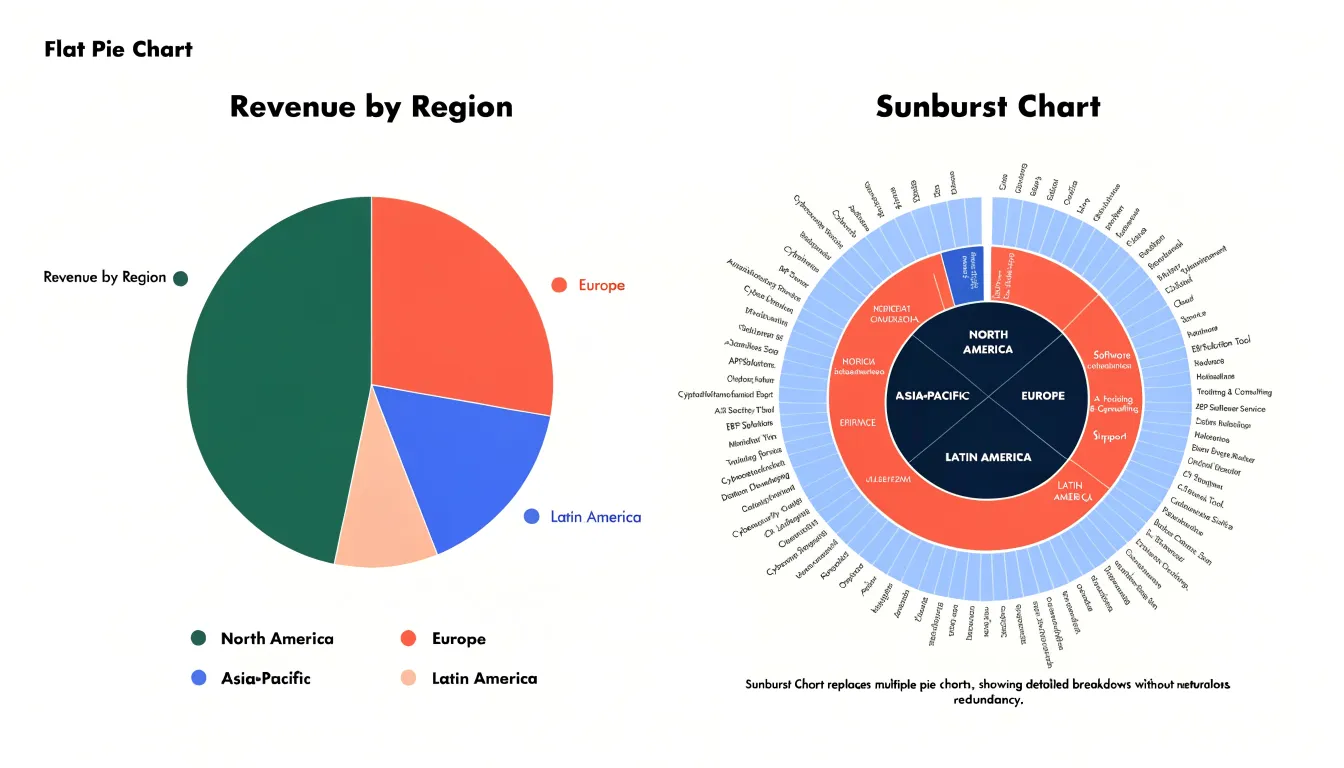
This nesting preserves context that separate charts would lose. An outer arc’s size is read in relation to its parent arc, so viewers see not just that a product is small, but that it is small within an already modest product line. For data with genuine relational depth, the sunburst’s added rings supply contextual layering that a flat pie chart cannot express.
Sunburst vs Treemap
When choosing between a sunburst chart and a treemap, the geometry of the layout shapes the viewer’s experience in distinct ways.
A sunburst’s radial structure fits neatly into a square or circular space, making efficient use of the canvas for deep hierarchies and clearly showing the number of levels. However, the radial layout introduces readability challenges: labels must be placed along arcs or rotated, and comparing segment sizes across different rings is harder because angles and curved areas are less intuitive to judge than straight lengths or flat rectangles.
Treemaps, in contrast, fill a rectangular space with nested rectangles whose areas are proportional to their values. This rectangular packing is highly space-efficient—especially for wide, shallow hierarchies—and supports straightforward horizontal labeling within each box. The trade-off is that treemaps can become cluttered with many small rectangles, and the nesting structure is often less immediately apparent than the distinct concentric levels of a sunburst.
In practice, sunbursts often appeal when highlighting hierarchy depth, branching paths, and cyclical or organic part-to-whole relationships. Treemaps are usually favored in analytical contexts where precise area comparisons, dense data display, and direct comparison of leaf nodes are the primary priorities.
Data Preparation
Before any visualization library can render a sunburst chart, raw data must be transformed into a clean parent-child hierarchy where every node except the root has exactly one parent. For example, sales data might be organized from a root total into region, country, city, and finally product category.
Once the levels are defined, choose a data format that suits your charting tool:
- JSON: Directly represents nested structures and works naturally with libraries like D3.js. A typical JSON hierarchy includes properties like
name,value, andchildren, wherechildrenis an array of sub-nodes. - CSV: Requires a flat structure with columns for
id,parentId, andvalue. TheparentIdcolumn explicitly links each row to its parent, allowing the library to reconstruct the hierarchy. This approach works well when data comes from spreadsheets. - SQL: Relational databases often store hierarchies using recursive queries or adjacency lists, where each row contains an
idand aparent_id. You can export these query results as JSON or CSV for the charting library.
Regardless of format, data cleaning is essential. Ensure that each node has a unique identifier, parent references are valid, and there are no circular references (cycles) in the hierarchy. Handle missing values by either omitting the node or assigning a default value, and maintain consistency in naming and data types to prevent rendering errors.
Arc Size
Every arc’s size is the primary carrier of quantitative information. The chart divides a full 360-degree circle into segments, calculating the sweep angle assigned to each segment as a proportion of the whole. If a category accounts for a quarter of the total value at its layer, its arc spans 90 degrees; a category representing one-tenth receives 36 degrees. Length along the circumference and the radial depth of the ring work together to reflect the magnitude being measured, letting a reader estimate values by comparing the visual heft of one arc against another or against the complete ring.
In business contexts, these angles translate directly into metrics such as sales volume or traffic share. A web analytics team, for instance, might place overall site traffic at the hub, with acquisition channels like organic search, paid campaigns, and referral forming the first ring in proportion to their visit counts, and individual campaigns splitting the channel arcs beneath them. Readers can scan sweep sizes around each ring to rank sibling categories, spotting dominant contributors and thin slivers of activity at a glance.
Ring Thickness
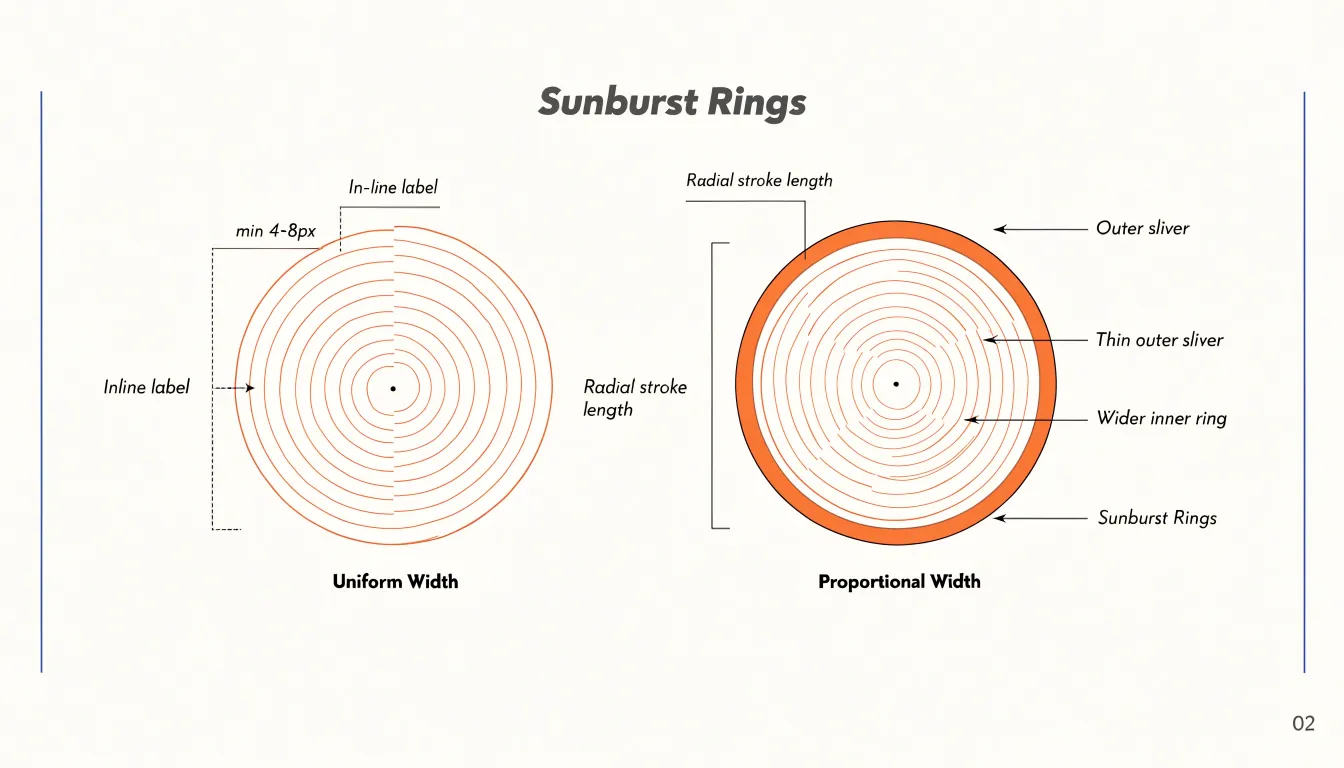
Ring thickness determines how legible a sunburst chart remains as it grows outward. You can control thickness using two main approaches or a combination of both:
- Uniform width: Gives every ring equal visual weight, keeping the chart balanced and making it easy to trace radial paths from center to edge. This works well when the hierarchy has a consistent number of levels and outer segments stay reasonably wide.
- Proportional width: Adjusts each ring’s thickness to reflect the number of nodes or the aggregate value at that level, emphasizing depth and signaling where data is concentrated.
- Hybrid approach: Uses uniform widths for the inner two or three rings to establish a stable visual anchor, then allows proportional adjustments further out.
Because thin outer rings risk becoming illegible once sub-segments fragment, set a minimum pixel width for any ring—often 4 to 8 pixels depending on display size—and enforce it by either widening the ring or reducing the number of displayed levels. Label placement also depends on ring thickness: inline labels need vertical clearance that uniform rings provide more reliably, while thin proportional rings may require external callouts. Always test the chart at its final display size, since fragmentation at the outer edge is where readability fails first.
Design Pitfalls
Crowded labels and visual clutter are the most common failures in sunburst charts, especially when the dataset includes many micro-slices—segments that occupy only a tiny fraction of the circle. Labeling every slice produces a jumble of overlapping text that obscures the chart’s structure.
To prevent label clutter and overlapping text:
- Set a minimum angle threshold: Slices below a specific angular threshold receive no direct label; communicate their values through hover tooltips or a separate summary table instead.
- Aggregate micro-slices: Group tiny categories into an “Other” slice at each level, reducing the number of labels while preserving the overall proportional shape.
- Adjust label orientation and placement: For cramped but readable slices, rotate labels to follow the arc, stagger label placement radially across adjacent rings, or place labels outside the ring with leader lines. Dynamic collision-detection algorithms can also hide or reposition colliding labels automatically.
- Use a legend key system: When direct labeling becomes impossible, shift the burden off the chart by assigning each category a consistent color and listing them in an external legend grouped by parent category.
Prioritize labeling the most significant slices, rely on legends or interactivity for the rest, and always check the result at its target display size.
Tool Selection
Selecting a tool for building a sunburst chart depends on how much control you need over the final visualization, how quickly you must iterate, and who will maintain the result.
- D3.js: Offers the deepest customization, giving developers direct control over every arc, label, transition, and interaction through its hierarchy and partition layout modules (
d3.hierarchy()andd3.partition()). This flexibility comes with a steeper learning curve and a code-first workflow suited to teams with JavaScript expertise and custom design requirements. - Plotly: Provides built-in sunburst support through a concise API in Python, R, or JavaScript, with hover interactions and zoom behavior available with minimal configuration. It suits analysts who want programmatic output without building rendering logic from scratch.
- Power BI and Tableau: Designed for users who prefer drag-and-drop authoring over code. Power BI includes a native sunburst visual, while Tableau relies on community-built extensions or workarounds using its hierarchy features, so teams should verify current support before committing. These platforms excel when charts must connect to governed data sources, refresh automatically, and sit alongside dashboards that non-technical stakeholders update themselves. Their trade-off is limited pixel-level control and licensing costs that scale with users.
Teams serving mixed audiences often pair tools, using a library like Plotly for embedded analytics and a BI platform for executive reporting. Checking documentation for hierarchical data support, label collision handling, and export options early in the process prevents costly rework later.
Mobile Layout
Smartphone viewports impose hard limits on how much of a multi-ring sunburst can be shown at once. Adapting the chart for mobile requires adjustments to sizing, interaction, and fallback representations:
- Fluid sizing and ring reduction: Scale the chart container to the available width, deriving the outer radius from the smaller of viewport width and height so the diagram never overflows or forces horizontal scrolling. On very narrow screens, collapse deeper levels into a summary arc labeled with a count or aggregate value.
- Zoom-on-tap navigation: Make tapping a segment smoothly re-root or expand that branch until its children occupy most of the circle, keeping labels readable and touch targets large enough for fingers (with generous padding to prevent mis-taps). Provide a breadcrumb trail or back button so users can retreat up the hierarchy, and render tooltips or detail panels outside the diagram footprint.
- Adaptive labeling: Use short forms, rotated radial text, or leader lines at mid-sizes, reserving full labels and values for the zoomed-in state.
- Linear fallbacks: When a screen is too small for radial geometry, present the same hierarchy as a compact indented list or stacked bar chart, which also works better for assistive technologies. Detecting limited viewport size, coarse pointers, or user preference can trigger the fallback automatically, alongside a manual toggle allowing users to switch views.
Step-by-Step Tutorial
This tutorial walks through creating a basic interactive sunburst chart from raw hierarchical data using JavaScript and D3.js:
- Define the data: Structure your data as nested JSON, where each node has a
name, an optionalvalue, and achildrenarray (for example, a budget breakdown with categories and subcategories). - Set up the HTML container: Create an HTML file with a container
<svg>element and include the D3.js library via a CDN. - Construct the root hierarchy: In your script, pass the JSON to
d3.hierarchy()to convert it into D3’s hierarchical node format, then call.sum()on the root to compute aggregate values for each node based on a specified accessor, ensuring leaf nodes have numerical values. - Apply the partition layout: Use
d3.partition()configured with a.size()of[2 * Math.PI, radius]. This maps the hierarchy into radial coordinates, assigning each node an angular span (x0tox1) proportional to its value and a radial depth (y0toy1). - Create the arc generator: Define a generator using
d3.arc(), setting thestartAngle,endAngle,innerRadius, andouterRadiusaccessors based on the partitioned node coordinates. - Render the segments: Bind the partitioned nodes to
<path>elements inside the SVG and apply a categorical color palette usingd3.scaleOrdinal(). - Add hover interactivity: Attach
mouseoverandmouseoutevent listeners to the paths to highlight active segments and display tooltips. - Enable click-to-zoom: Attach
clickevent listeners that update the partition layout’s domain with the clicked node as the new root, using a D3.transition()on the path’sdattribute to smoothly animate the arcs to their new positions. - Position the labels: Append
<text>elements positioned at the centroid of each arc, applying rotation and text truncation so labels fit within their segments.
Overview
Building an effective sunburst chart comes down to transforming flat, messy records—such as spreadsheets, exported logs, or overlapping categorical fields—into a deliberate, well-validated hierarchy. Practitioners can ensure their charts remain clear and trustworthy by following four core rules:
- Define hierarchy depth deliberately: Too many rings create thin, unreadable outer slivers, while too few lose the value of a nested radial structure.
- Aggregate carefully at each level: Group micro-slices and resolve missing branches or duplicates so that arc widths remain proportional and meaningful.
- Guide attention with restraint: Use parent-hue gradients, thresholded labels, and interactive tooltips to clarify lineage rather than decorate indiscriminately.
- Validate against raw data: Verify that every ring sums properly to the root total, because a compelling visual is only as reliable as the data preparation beneath it.
Frequently Asked Questions
What is a sunburst chart?
A sunburst chart organizes hierarchical information as concentric rings, with the center holding the root of the structure and each outward ring representing the next level of depth. The angle allocated to an arc typically reflects a quantitative value such as count, budget, or proportion.
How do you read a sunburst chart?
Read radially from center to edge to follow the drill-down path for a specific branch, and scan angularly around a single ring to compare sibling items at the same hierarchical level. Children are positioned within their parent’s angular span, preserving the hierarchy.
How should I choose colors for a sunburst chart?
Assign a distinct hue family to each main parent branch in the innermost ring, limit top-level hues to roughly five to seven, and render child slices with monochromatic gradients derived from the parent color. The article also recommends ensuring text contrast and testing the palette in grayscale.
What interactive features can a sunburst chart include?
Interactive features can include click-to-drill-down, hover tooltips, and dynamic zooming. These help users reveal children in greater detail, see an arc’s name, exact value, percentage of parent, and depth, and inspect dense outer rings.
What is the difference between a sunburst chart and a pie chart?
A pie chart communicates proportion at a single level, while a sunburst chart extends the same radial logic through concentric rings to show proportion across multiple relational tiers in one frame. This nesting preserves context, so an outer arc is read in relation to its parent arc.
How do I prevent crowded labels in a sunburst chart?
To prevent label clutter, set a minimum angle threshold for direct labels, aggregate micro-slices into an “Other” slice, adjust label orientation and placement, or use a legend key system. Prioritize labeling the most significant slices and check the result at the target display size.
Tony Astor
Tony writes about data visualization and the tools people use to build charts and dashboards. More about Data Illustrator