Step Chart vs Line Chart: When Values Jump
 By Tony Astor ·
Step Chart vs Line Chart
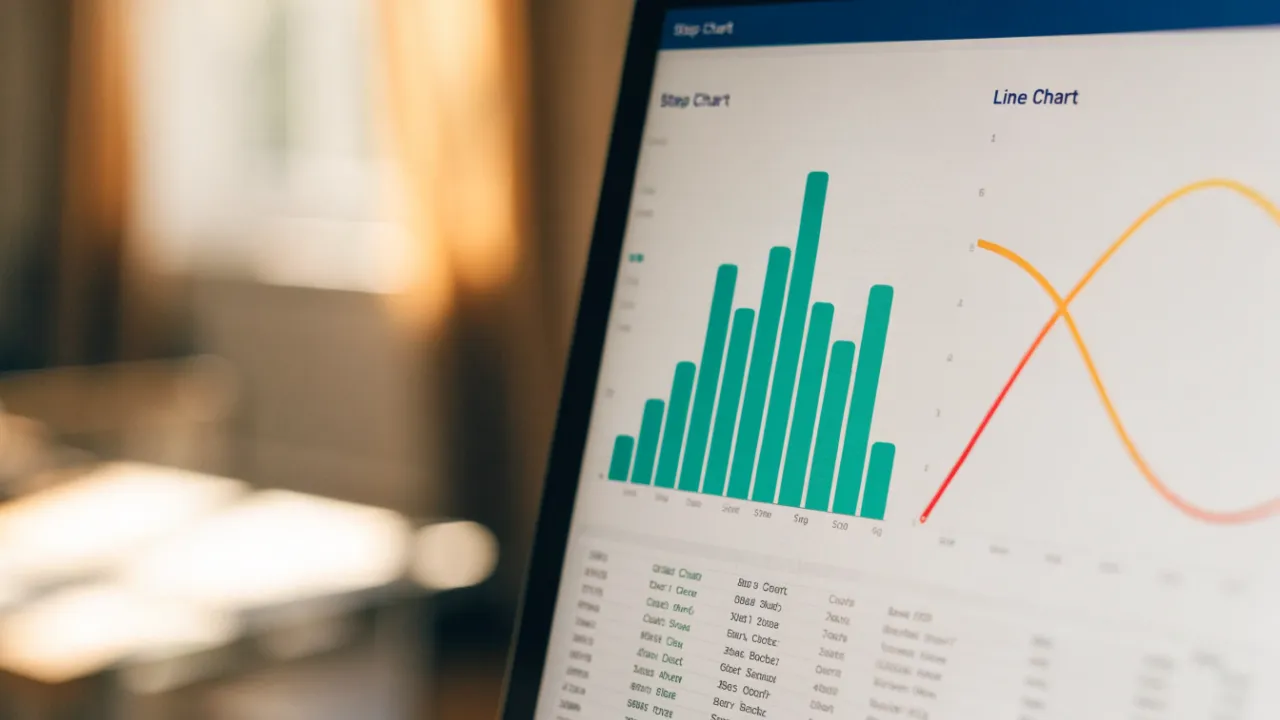
Use a line chart for continuous data that changes smoothly over time, like temperature or stock prices, because connected points show trends and transitions. Use a step chart for discrete data that holds steady then changes abruptly at specific moments, like interest rates, inventory drops, or policy updates, because flat segments show duration and vertical jumps mark exact timing.
Table of Contents
- Line Chart
- Step Chart
- When to Use Step Charts
- When Line Charts Mislead
- Inventory Tracking
- Rate and Price Changes
- Status and Uptime Logs
- Temperature and Process Monitoring
- Plant Growth
- Shelf Life and Potency
- Combining Chart Types
- Axis and Scale Setup
- Common Chart Mistakes
- Choosing the Right Chart
- Dashboard Overview
Line Chart
A line chart connects individual data points with a continuous line, making transitions explicit rather than leaving the reader to mentally bridge the gaps between disconnected markers. This makes the line chart a natural fit for phenomena that change continuously rather than in discrete jumps, such as daily temperature readings, stock prices, or website traffic across a month. The eye follows the slope between points and immediately grasps direction: rising, falling, or holding steady.
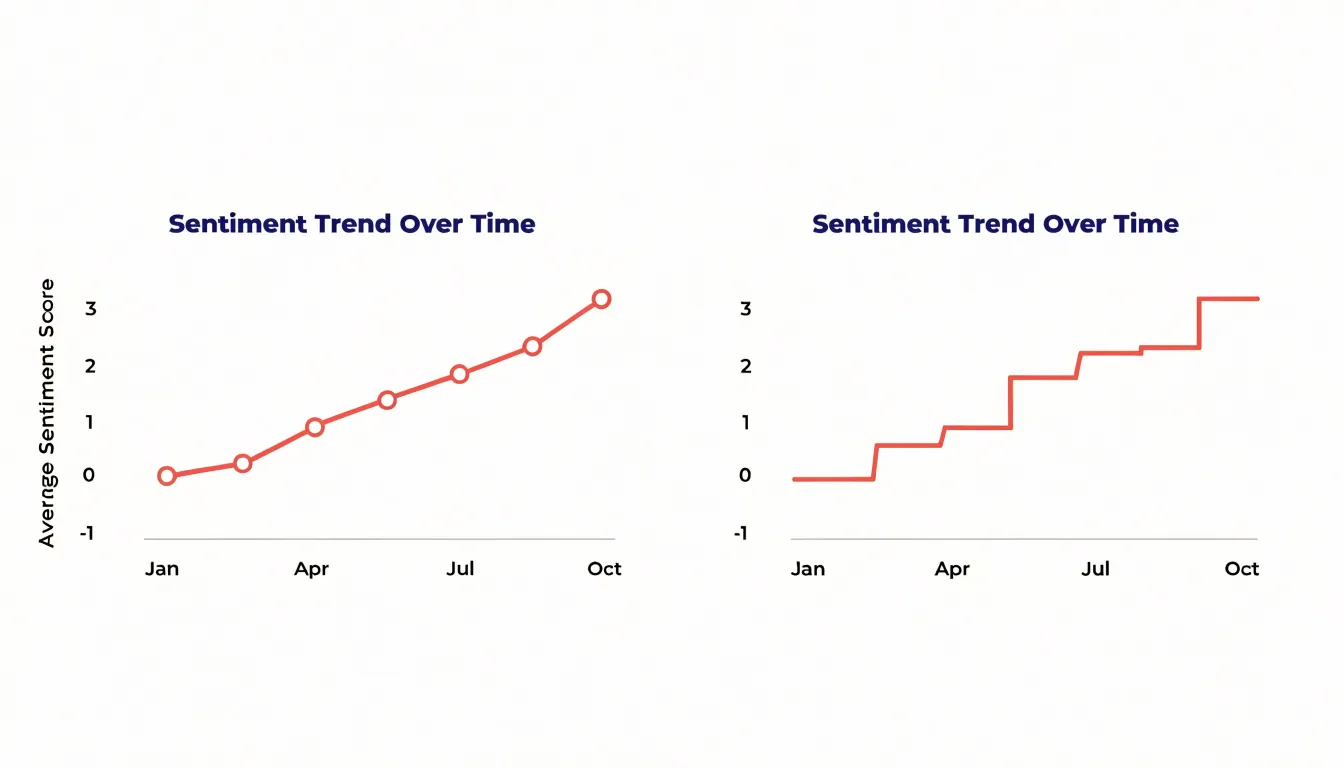
The effectiveness comes from how faithfully the line mirrors the underlying process. Temperature does not leap from one day’s reading to the next and then pause; it drifts through intermediate values, and the connecting segment stands in for that unbroken drift. The same holds for market trends, where prices move moment to moment and a connected series captures the texture of that movement, including the small oscillations between larger swings. Readers perceive acceleration, reversal, and plateaus directly from the geometry of the line without consulting individual labels.
Line charts also handle dense data gracefully. With a hundred daily observations, the connected line remains readable, whereas a hundred separate markers would clutter the plot. The line aggregates visual attention along a single path, letting viewers spot cycles, seasonal patterns, and long-term drift at a glance. Choosing an appropriate time interval matters, since the spacing of points along the horizontal axis shapes how smooth or jagged the line appears.
Step Chart
A step chart is built for data whose values hold steady and then change abruptly at specific moments. Horizontal segments show the periods during which a value remains constant, and vertical segments connect one level to the next at the exact point of change. Rather than implying a gradual transition between two points, the chart shows the value sitting at a plateau and then moving instantly to a new plateau.
This structure suits discrete events that are set by a decision, an announcement, or a scheduled adjustment and then hold until the next one. Policy updates behave this way, with a rule remaining in force for a period and then being revised on a specific date. Interest rate adjustments follow the same pattern, with a central bank setting a rate that stays fixed until the next meeting or announcement. A step chart captures both the timing and the duration of each setting, so a reader can see how long a given rate or policy was in effect and when the next change arrived.
The horizontal run of each segment communicates duration and stability, while the vertical rise or fall marks the moment of transition. Because the change appears as an instant jump rather than a slope, the chart avoids suggesting intermediate values that never actually existed.
When to Use Step Charts
Step charts are best suited to data defined by sudden shifts at specific moments or thresholds, such as subscription prices revised on specific dates, inventory levels that adjust with each delivery, or tiered pricing structures that change at defined thresholds.
Whereas a standard line chart’s diagonal segments imply continuous movement across an interval, a step chart keeps the value flat until the moment of change. This emphasis on exact timing is especially useful when aligning a shift with other events, such as a policy announcement or a promotional period. When the analytical question is when a change occurred and how long each level persisted, the step chart communicates that structure directly without suggesting constant drift between intervals.
When Line Charts Mislead
When underlying data is discrete—meaning each point is a separate, self-contained value with nothing meaningful in between—a line chart’s continuous stroke fabricates intermediate states. A common example is a chart of monthly headcount by department, where a line drawn from twelve employees in January to twenty in February passes visually through sixteen along its path. No moment existed in which the department held sixteen people as part of a gradual climb; the change happened as a discrete event, yet the slope invites readers to perceive a smooth transition that never took place.
The same distortion appears with values that cannot be fractional at all, such as counts of customer complaints, number of stores open, or survey responses on a five-point scale. The eye follows the incline and infers a rate of change, a trajectory, and often a direction of travel that the data does not support. Readers may conclude that a metric is accelerating or decelerating simply because the line bends, when the bend reflects nothing more than the difference between two unrelated snapshots.
This becomes especially risky in reporting contexts where audiences scan for movement and momentum. A line that climbs steeply between two categories encourages forecasts and assumptions about causation that the numbers cannot bear. When the points are genuinely separate observations, such as quarterly results from different years or rankings of unrelated items, that implication of continuity is false. A step chart or a bar chart presents the same values without drawing a path between them, letting each discrete fact stand on its own and keeping the reader from reading a trend into a sequence that is merely a list.
Inventory Tracking
In a warehouse setting, stock levels remain steady for extended periods and then plummet instantly when a major shipment is dispatched. For example, a retailer might hold 5,000 units of a product for most of the day, then ship 3,000 units to a distribution center in a single transaction. A line chart would blend these sudden drops into gradual slopes, misrepresenting the operational reality.
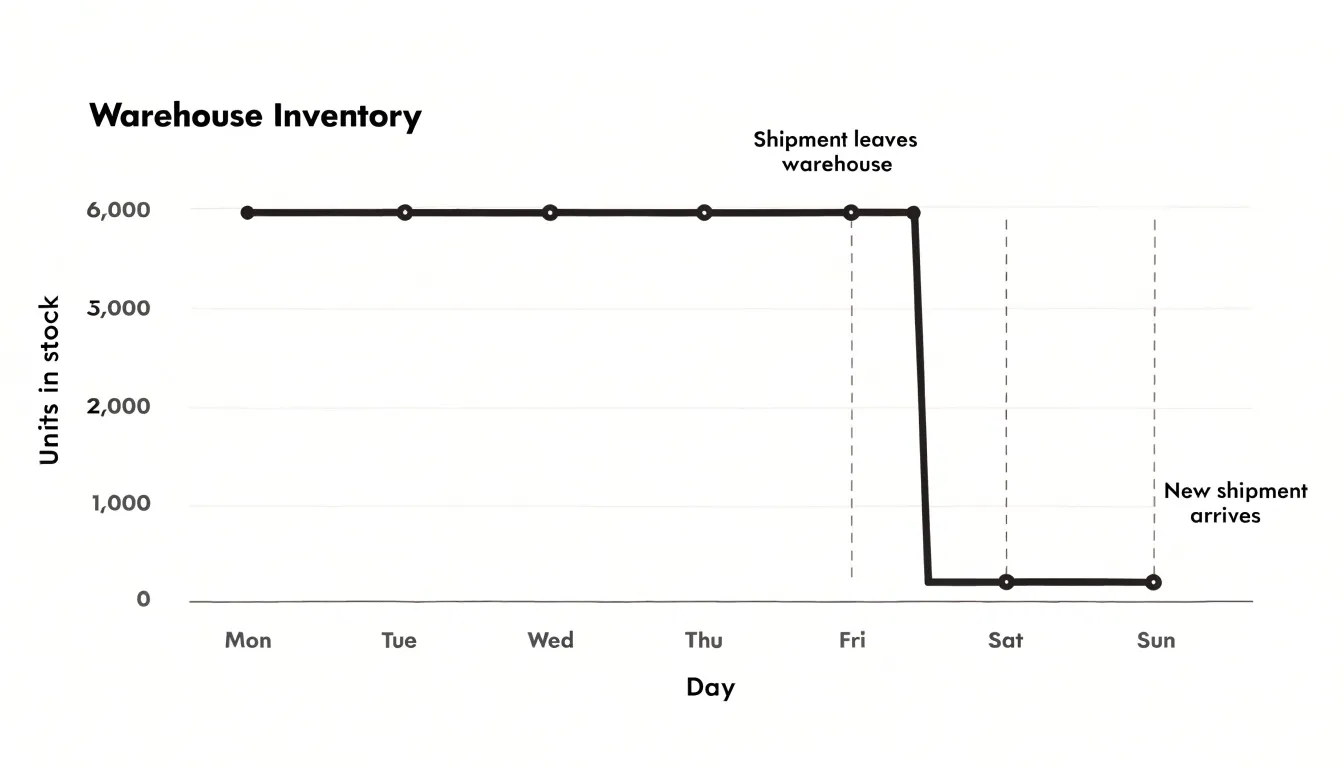
A step chart preserves the exact timing and magnitude of each batch-based movement. This precision helps warehouse managers identify exactly when stock was depleted and how much was removed at each event, aligning with how inventory systems record transactions as discrete events rather than continuous flows. When analyzing historical stock levels, a step chart reveals patterns such as multiple shipments occurring on the same day or extended periods without activity, and it supports forecasting by highlighting the frequency and size of batch withdrawals.
Rate and Price Changes
Pricing and rate structures commonly remain fixed for a period and only adjust when a scheduled update occurs or a threshold is crossed:
- Subscription tiers often stay fixed for months or years before a planned increase takes effect.
- Tax rates are legislated at specific values and remain unchanged until a new law or regulation sets a different rate.
- Shipping fees may stay flat for certain weight brackets or order totals, jumping to a new level once a threshold is crossed.
Because these values do not fluctuate continuously between updates, a step chart helps with planning and analysis. Viewers can quickly see when a price increase will occur and how much it will be, giving an accurate picture of how subscription costs, tax obligations, or shipping expenses evolve over time.
Status and Uptime Logs
Status and uptime logs track binary operational states—such as server uptime or machine active status—that switch between on and off, active and inactive, or up and down. For example, a server running from 00:00 to 08:00 before going down shows a horizontal line at the ‘up’ level until 08:00, followed by an instantaneous vertical drop to the ‘down’ level, and a horizontal line at that level until the next change.
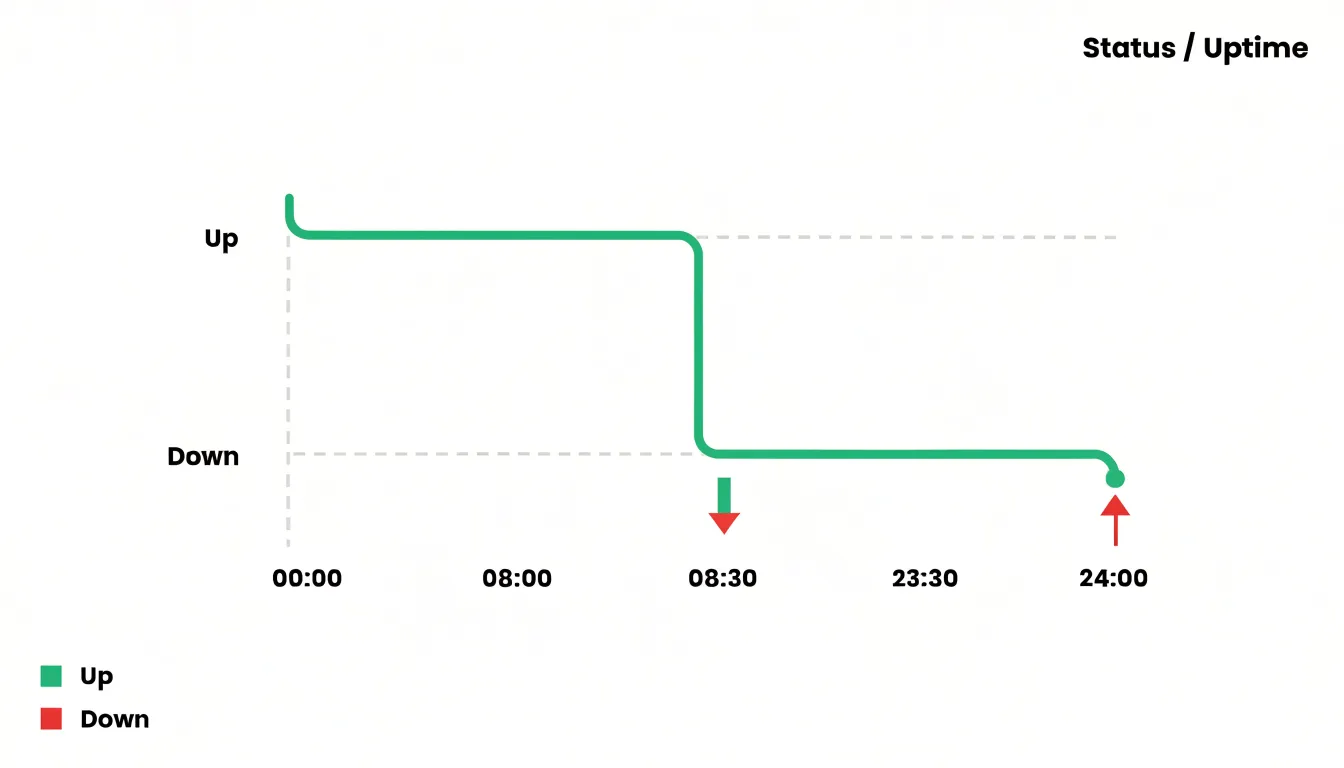
Unlike a sloped line that implies a gradual transition, the step chart’s sharp vertical transitions convey that the system was fully up until one moment and fully down the next, with no intermediate values. This visual sharpness makes it easy to identify exact start and end times, which is crucial for analyzing uptime, diagnosing outages, and calculating availability metrics. It also helps in spotting patterns, such as frequent short outages or long stable periods, because the eye is drawn to the abrupt changes.
Temperature and Process Monitoring
Industrial temperature and process monitoring offers a clear everyday example of data that holds steady between adjustments. When an industrial thermostat is set to maintain a fixed temperature within a manufacturing process, the system cycles heating or cooling elements on and off to keep the reading at that constant level. Hour after hour, the plotted readings form a horizontal line, with only tiny fluctuations from the control system’s normal operation.
The shifts arrive when manual recalibration occurs. An operator might adjust the setpoint to accommodate a new batch of material, a change in ambient conditions, or an updated product specification. At that instant, the temperature reading departs from its previous level and climbs or drops to a new plateau, appearing on a step chart as a sharp vertical jump followed by another long, flat run.
This pattern repeats across furnaces, ovens, environmental chambers, and process vessels, which all hold a target value until a human decision or scheduled procedure changes it. Viewing such readings as a step chart makes the structure of the process immediately legible, since each horizontal segment corresponds to a defined operating state and each vertical transition marks a deliberate recalibration.
Plant Growth
Plant growth is a continuous biological process, and measurements such as height recorded over weeks or months naturally form a sequence of accumulating values. Because height increases gradually rather than in abrupt jumps, a standard line chart is the natural choice.
By plotting height on the vertical axis and time on the horizontal axis, a line chart allows viewers to trace the trajectory of growth, identify periods of rapid or slow development, and spot trends such as a slowdown in growth rate as the plant matures. Each week’s measurement builds upon the previous ones, and in educational or research contexts, this format facilitates clear comparisons across different plants, treatments, or species.
Shelf Life and Potency
Essential oils age from the moment a bottle is sealed and filled. A step chart can represent the discrete events that punctuate this aging process, while a line chart captures the continuous drift in chemical stability that runs underneath those events.
Consider a storage timeline spanning several months or years. At defined checkpoints—when a bottle is first opened, stored in a warm location, decanted into a smaller vessel, or exposed to light—the graph drops sharply in a staircase pattern. Each drop corresponds to a specific moment when the conditions around the oil change in a measurable way.
The underlying chemical reality, however, is continuous. Terpenes and other volatile constituents oxidize gradually even inside a closed bottle kept in a cool, dark place, so the oil’s potency declines along a slow downward slope that a line chart renders naturally. That slope represents baseline degradation: the unavoidable drift that accumulates with time regardless of handling. Opening a bottle introduces a different mechanism. Oxygen enters the headspace, and oxidation proceeds through immediate steps, with hydroperoxides forming and the oil’s aromatic profile shifting within hours or days. On a step chart, this appears as a sudden vertical drop at the moment of opening, followed by a flatter tread as the newly introduced oxygen is consumed and the rate settles into a slower decline.
Plotting both views helps clarify why two bottles from the same batch can test differently. One may follow a gentle continuous slope while another shows a series of abrupt drops tied to repeated opening and storage interruptions. The step chart isolates the events, and the line chart shows the baseline drift, giving formulators a way to reason about shelf life, potency, and the practical cost of every opening.
Combining Chart Types
Combining step and line chart formats within a single report allows continuous environmental metrics (such as temperature, humidity, pressure, or pollutant concentration) to be paired with discrete operational events (such as equipment start-ups, maintenance interventions, threshold breaches, or batch changes). Overlaying the two formats on shared axes lets viewers see cause and effect directly: a sharp vertical riser in an operational step often aligns visibly with a subsequent inflection in the environmental line, making the relationship between an intervention and its measured outcome immediately legible.
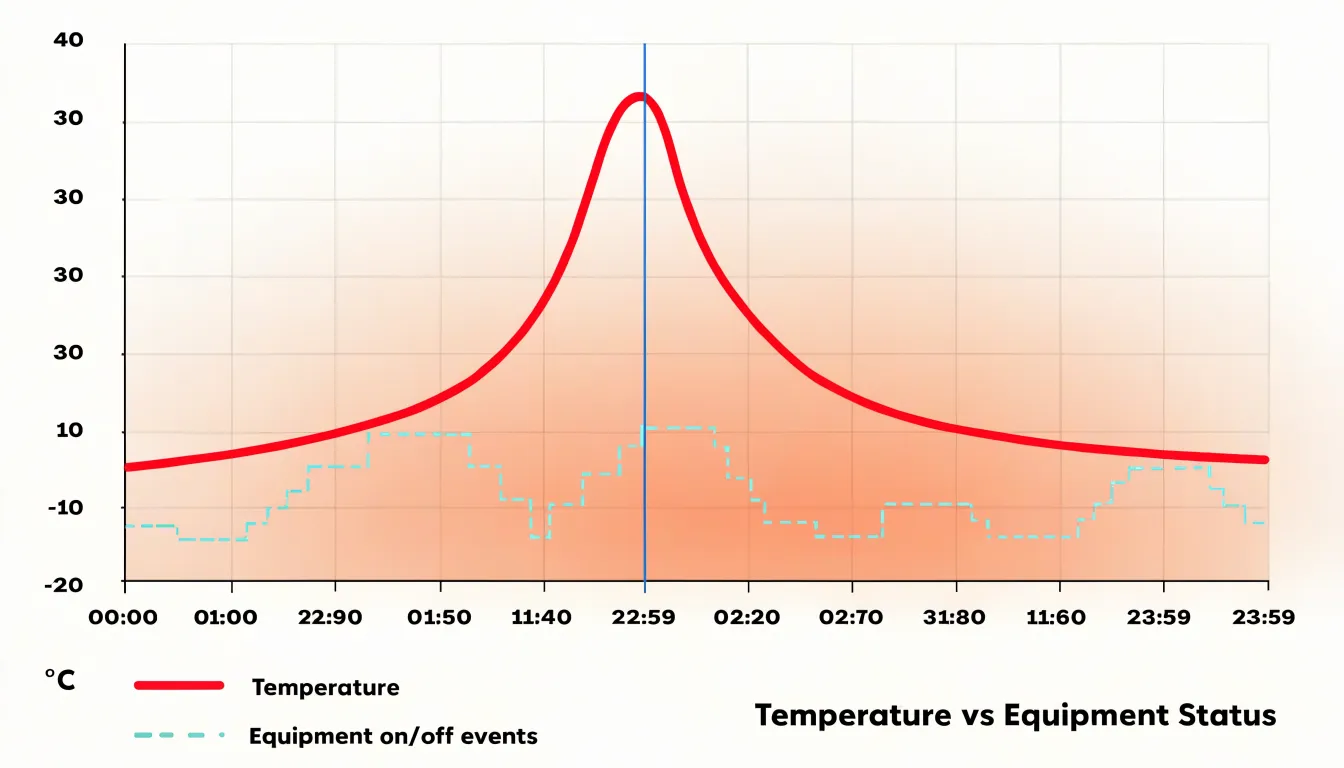
A line chart of temperature alone tells the reader what happened, while adding a step layer showing when a ventilation system was switched on or when a production line shifted modes supplies the why. Analysts can scan vertically at any timestamp and read both the environmental condition and the operational state without cross-referencing separate panels, supporting both retrospective diagnosis and real-time monitoring.
When layering formats, balance the visual weight so the step series remains readable without obscuring the continuous line:
- Use lighter fills or dashed risers for event data and a solid, higher-contrast stroke for the continuous metric.
- Use shared time axes and consistent labeling to keep the combined view unambiguous.
- Include a clear legend distinguishing the two encodings to prevent misreading.
Axis and Scale Setup
When building a step chart or a line chart, the first consideration is configuring uniform time intervals—whether daily, weekly, monthly, or yearly—along the horizontal axis. Without uniform intervals, the visual distance between points becomes misleading, and readers may misinterpret the pace of change. For example, if a chart jumps from daily to weekly intervals without clear demarcation, a sudden spike might appear more or less significant than it truly is. Consistent spacing ensures that each unit of time occupies the same visual width.
Equally important is a balanced vertical scale. If the scale is too compressed, sudden value jumps may be flattened and overlooked; if it is too stretched, minor fluctuations may appear as dramatic shifts. Choose a range that accommodates the full spectrum of values while keeping the axis readable. Starting the vertical axis at zero is often recommended for step charts, as it provides an honest baseline and prevents exaggeration of differences. However, in cases where all values are clustered far from zero, a non-zero baseline may be necessary to reveal meaningful patterns—provided it is clearly labeled to avoid misinterpretation.
Together, uniform time intervals and a balanced vertical scale ensure that the height of a step or the slope of a line corresponds directly to the magnitude of change, and that horizontal distance reflects true time spans.
Common Chart Mistakes
Layout errors in step charts often begin with interpolation choices designed for continuous data. When a plotting library defaults to a smoothed spline, the resulting curve bends gradually between recorded values, and the sharp vertical risers that define a step change dissolve into gentle slopes. Removing spline smoothing and rendering the segments as true horizontal and vertical lines restores the exact moment of the transition, so the visual break aligns with the tick mark or timestamp where the change occurred.
Misplaced data markers introduce a related problem. Markers placed at the midpoint of a step, or scattered along a smoothed curve, suggest that data was sampled at that location, inviting readers to treat the point as a genuine observation. Placing markers at the vertices where each step begins reinforces that the value holds steady until the next recorded point. This placement matters most in dense charts with many transitions, where overlapping markers can cluster around a jump and visually merge two distinct levels into a single blur.
Finally, check axis alignment and label placement around transitions. A vertical grid line that falls slightly off the step boundary, or an annotation that floats between segments, can mislead readers about when a change took effect. Aligning grid lines with the actual transition points and anchoring labels to the correct segment keeps attention on the jump itself.
Choosing the Right Chart
Selecting between a line chart and a step chart comes down to matching the visual format to the behavior of your metric:
- Use a line chart when values flow in a smooth, unbroken stream, such as temperature drifting upward through the morning, a stock price ticking across a trading day, or a patient’s heart rate rising and falling moment to moment.
- Use a step chart when values hold steady and change in discrete bursts, such as inventory dropping when a shipment leaves, a subscription count stepping up when a campaign launches, or rates and tiers resetting at defined moments.
Matching format to data is a matter of accuracy rather than aesthetics: a continuous process rendered as steps implies abrupt shifts where none occurred, while a discrete series rendered as a smooth line implies gradual transitions that the data never contained.
Dashboard Overview
Placing line and step visualizations side by side on a dashboard gives stakeholders two complementary readings of the same dataset without requiring them to switch tools or interpret raw tables. Overall trends stand out immediately in the line chart, while abrupt shifts register in the step chart. A product manager checking subscription counts, for instance, can see the long-term growth curve while also noticing the specific week a pricing change produced a sharp step upward. The two views reinforce each other, reducing the risk that an important event gets averaged away by a smooth trend line.
Positioning both visualizations close together with a shared color palette, consistent labeling, and aligned time scales lets viewers compare the two charts without mental conversion. Executives reviewing weekly performance, analysts monitoring operational metrics, and cross-functional teams tracking project milestones all benefit from seeing both the broader direction and the discrete moments of change in a single summary.
Frequently Asked Questions
What is the difference between a step chart and a line chart?
A line chart connects individual data points with a continuous line to show continuous change, while a step chart uses horizontal segments for periods when a value stays constant and vertical segments at the exact moments it changes abruptly.
When should I use a step chart instead of a line chart?
Use a step chart when values hold steady and change in discrete bursts or at specific moments or thresholds, and when you need to show when a change occurred and how long each level persisted. Use a line chart when values flow in a smooth, unbroken stream.
Why can a line chart be misleading for discrete data?
When data is discrete, a line chart’s continuous stroke can fabricate intermediate states, such as a line from 12 to 20 employees appearing to pass through 16 even though no gradual climb occurred. A step chart or bar chart presents the same values without drawing a path between them.
How does a step chart help with inventory tracking?
In inventory, stock levels can remain steady and then drop instantly when a major shipment is dispatched. A step chart preserves the exact timing and magnitude of each batch-based movement, helping show when stock was depleted and how much was removed at each event.
How are step charts used for rate or price changes?
Subscription tiers, tax rates, and shipping fees often stay fixed for a period and then adjust at a scheduled update or threshold. A step chart shows when a price increase will occur and how much it will be, giving an accurate picture of how costs evolve over time.
How do you combine step and line charts in a report or dashboard?
Overlay step and line formats on shared axes to pair continuous environmental metrics with discrete operational events, so viewers can see cause and effect. Use lighter fills or dashed risers for event data, a solid higher-contrast stroke for the continuous metric, shared time axes, consistent labeling, and a clear legend.
Tony Astor
Tony writes about data visualization and the tools people use to build charts and dashboards. More about Data Illustrator