Step Chart: Visualizing Values That Change in Jumps
 By Tony Astor ·

Step Chart
A step chart displays data that stays constant at one value and then jumps abruptly to another, drawing flat horizontal segments for each stable period and vertical lines at the exact moment of change. It suits discrete data like interest rates, tax brackets, and pricing tiers, where values never pass through intermediate states.
Table of Contents
Step Chart
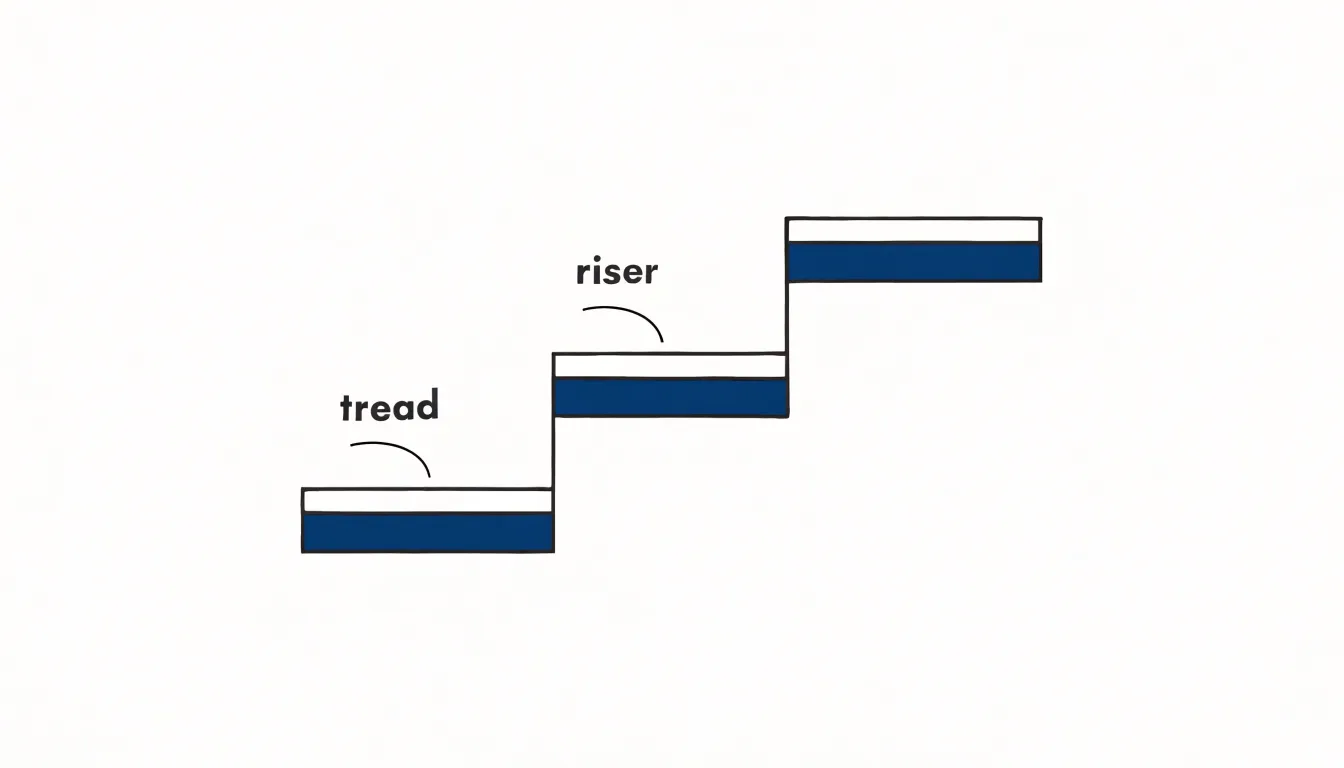
A step chart represents data that does not move gradually between values. When a quantity holds steady at one level and then jumps to another, the change happens at a single moment rather than spreading across the space between two points. A step chart draws a flat horizontal segment (tread) at each value and connects successive values with a vertical line (riser) at the exact point where the change occurs. The resulting series of plateaus and abrupt risers mirrors how the underlying quantity actually behaves.
Continuous trends call for a different visual grammar. When a value shifts smoothly over time, a sloped line communicates that the variable passes through every intermediate value along the way. A steep slope indicates rapid movement, a gentle slope indicates slow movement, and the area between the line and an axis suggests accumulation over the interval. For genuinely continuous data, this is an honest representation.
Discrete data changes have no intermediate states. A price tier, an interest rate set by policy, a shipping bracket, or a subscription level stays fixed until an event triggers a new value. Plotting such data with sloped lines implies the quantity drifted through values it never actually held. The step transition removes that implication: the vertical riser marks the moment of change, and the flat tread marks the period of stability.
This visual distinction shapes interpretation. Sloped lines invite readers to estimate rates of change and interpolate between points. Step transitions direct attention to thresholds, timing, and duration, preventing conclusions about gradual movement that the data cannot support.
Step Chart
A standard line chart connects adjacent data points with a straight segment, carrying an implicit claim of gradual, continuous movement. When data actually changes in discrete jumps, this drawn continuity becomes a fiction. A price holding at one level for three weeks before leaping overnight appears on an ordinary line chart as a gentle diagonal slope across those weeks. The viewer sees a gradual drift where there was only stillness followed by an abrupt event.
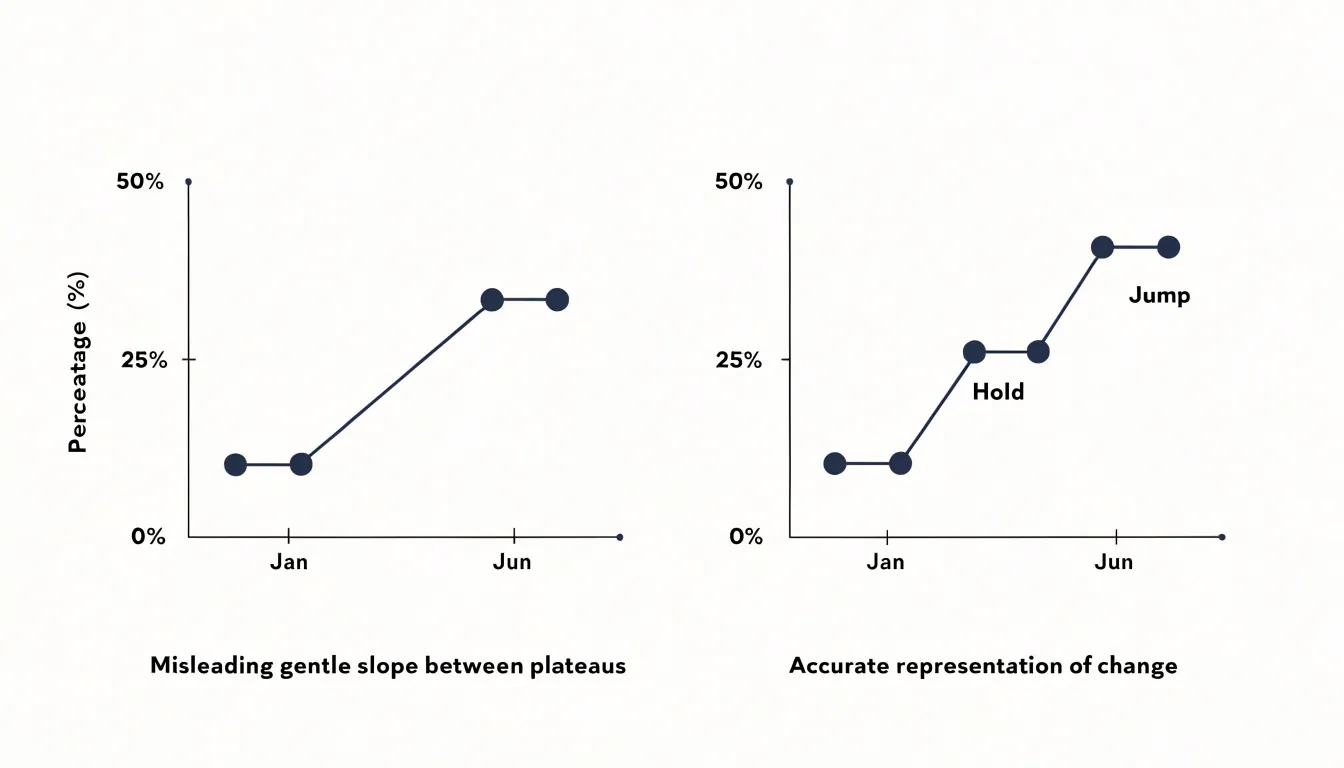
Stable intervals carry real meaning, often reflecting a deliberate hold, a fixed rate, a demand plateau, or an untouched policy. By stretching the transition across the gap between readings, a line chart erases the boundary between the quiet stretch and the sudden shift. Readers then misattribute movement to the days or weeks before the jump and infer gradual causation. Two identical endpoints can hide completely different stories: a slow climb versus a flat line punctuated by a single spike.
The problem compounds when several intervals appear in sequence. A series of holds and jumps renders as soft ramps, which the eye reads as a smooth, organic curve. Decision-makers may then forecast continued gradual movement, underestimate volatility, and misjudge the timing of past events as thresholds, deadlines, and trigger points vanish into the slope.
Step charts keep flat stretches visibly flat and place jumps where they occurred. For any series built on discrete events, rate changes, or state transitions, that honesty about timing lets viewers read the chart accurately.
Step Chart
In a step chart’s visual grammar, the length of each horizontal segment shows how long a value persists—whether for seconds, days, or months—while its endpoints mark the boundaries of that steady state. This is especially useful for metrics that update only at specific events, such as inventory levels after restocking or a subscription tier after an upgrade.
Vertical steps mark the exact moments the metric changes, and their height shows the magnitude of the change. A vertical line has no duration; it is an instantaneous boundary marker. If a step chart shows a vertical jump at noon, the value held at one level up until noon and a new level from noon onward, rather than changing over the preceding horizontal segment.
To read a step chart, trace the path from left to right:
- Follow each horizontal segment to see the duration of a constant value.
- Note the vertical step that ends it: the x-position gives the exact time of change, and the y-difference gives the size of the change.
Reading the chart this way reconstructs the metric’s full history—when it was stable, when it changed, and by how much.
Step Chart
Step charts are well suited for rates, brackets, and pricing tiers:
- Interest rates: Benchmarks typically jump from one level to another and remain fixed until the next adjustment.
- Tax brackets: As income crosses a threshold, the marginal tax rate increases in discrete steps. Plotting the rate across bracket boundaries makes it easy to see the effective rate for any income level.
- Subscription pricing tiers: Monthly costs often hold fixed across a usage range or feature set and jump when a customer moves to the next tier, providing a clear visual guide to the pricing structure.
Whether communicating financial thresholds, regulatory limits, or product pricing, step charts make exact transition boundaries explicit.
Step Chart
Before building a step chart, confirm that the underlying data actually moves in discrete jumps:
- Examine how each data point was recorded. Values captured at fixed intervals from a continuously varying source—such as a thermometer logging every minute or a sensor streaming fluid measurements—drift between readings. Ask whether each raw record marks a distinct event (a new price, a status change, a revised threshold) or simply the next sample in a regular stream. Evenly spaced timestamps with gradually moving values belong on a line chart.
- Check the transition structure. Each break between flat stretches should correspond to an identifiable source event, such as a policy taking effect, a rate adjustment, or an operational status flipping. Trace a sample of transitions to confirm the change is real and not an artifact of rounding, interpolation, or a data entry correction. Watch for unrecorded gaps and duplicate timestamps that could create phantom steps.
- Verify consistency of units and recording rules. A change in measurement method midway through the dataset can look like a step when it is really a change in instrumentation. Document the semantics of each field, note any resampling or smoothing, and confirm that step boundaries fall at the moments the state actually changed.
Step Chart
Alignment decisions determine how a value change is positioned relative to its timestamp marker, shaping what the chart communicates about when the change occurred:
- Left alignment: The new value begins at the timestamp and holds until the next recorded time, so the horizontal segment extends forward from the marker. This treats the timestamp as the moment the change takes effect, suiting event-driven updates like a price change or status flip.
- Right alignment: The segment runs up to the marker and the change lands at the end of the interval, so the step appears to arrive at the marker rather than depart from it. This fits data recorded at the close of a period, such as an end-of-day inventory count or a month-end balance.
- Center alignment: The transition sits midway between successive timestamps, distributing timing ambiguity evenly across the interval. This is useful when the exact moment of change is unknown and the data represents a period average or aggregate.
Left and right alignments anchor the jump to a specific marker for a crisp reading of timing, while center alignment softens that anchor and implies uncertainty. When comparing multiple series on a shared time axis, use consistent alignment across charts; mixing alignments makes identical changes appear offset. Timestamp density also matters: closely spaced intervals reduce the perceptual difference between alignments, while sparse markers amplify it. Choose the alignment that matches whether your timestamps mark the beginnings, endings, or midpoints of the intervals they describe.
Step Chart
Raw spreadsheet tables are often inconsistent and incomplete, requiring preparation before plotting a step chart:
- Sort and clean the table. Sort rows chronologically by date or time, remove duplicate entries, strip non-essential columns, ensure numeric fields are stored as numbers, and standardize date formats on the x-axis.
- Forward-fill missing date ranges. Leaving gaps can produce misleading jumps or broken lines. Insert rows for each missing period and fill the corresponding y-values with the last known value to preserve periods of no change.
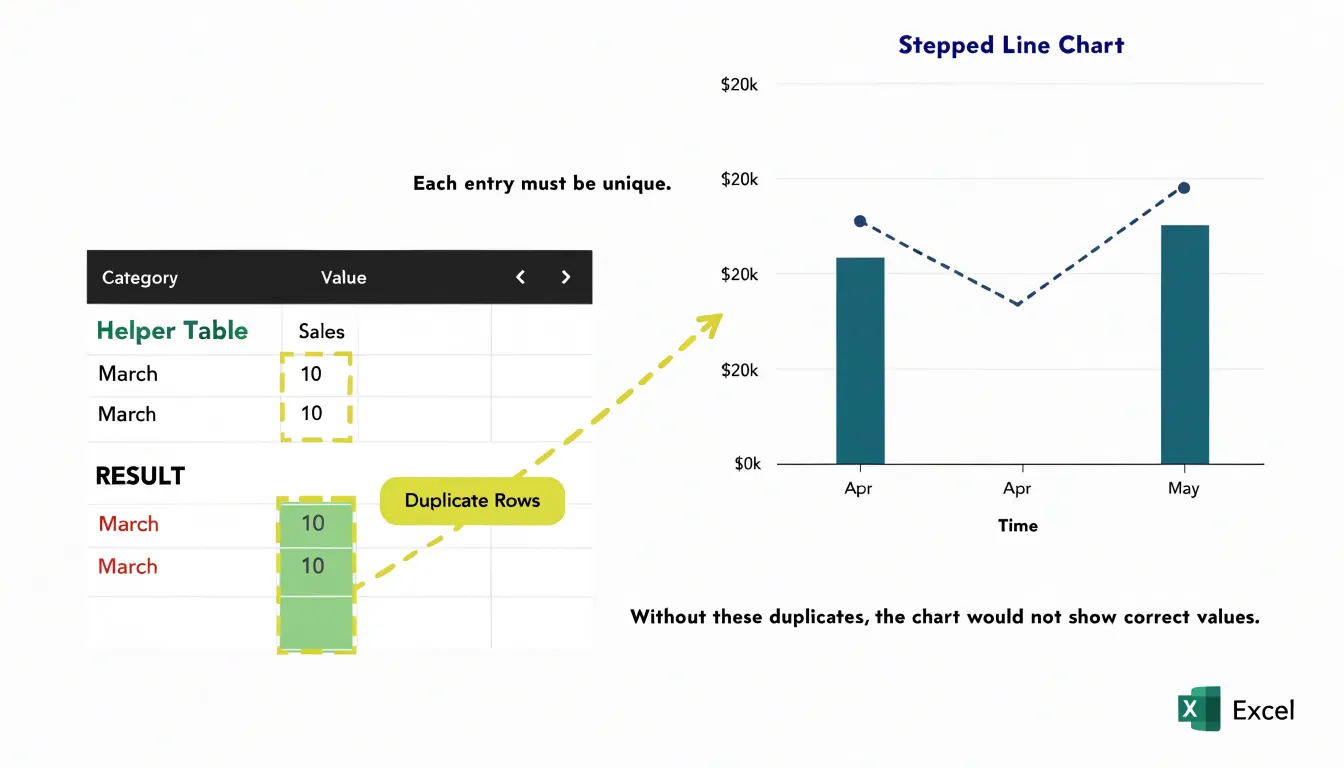
- Duplicate data points to create horizontal segments. Create a new table where each original row is repeated: one point at the current y-value and a second point at the next x-value carrying the same y-value. For the final data point, duplicate it with an extended x-value to close the last step.
Step Chart
Because Excel has no built-in step chart type, building one relies on a helper layout:
- Build a formula-driven helper table. Create two repeated rows for each data point: one holding the category or date with the previous value, and a second holding the same category with the new value. For example, if a price changes from 10 to 15 in March, enter
March, 10followed byMarch, 15so the chart draws a flat segment up to March and a vertical jump at that point. Use formulas referencing your original data so the chart updates automatically. (Alternatively, modify an existing line chart by inserting empty rows between data points and using formulas to carry values forward.) - Insert a line chart. Select the helper range and insert a 2D line chart (with or without markers). Excel will connect the repeated rows into a stepped outline.
- Configure the horizontal axis. Open the Format Axis pane and set the horizontal axis to a text axis, or to a date axis with the base unit fixed to one day. This prevents Excel from spacing categories proportionally and keeps the vertical transitions sharp.
- Style and save as a template. Format the line with a solid color, remove markers if you prefer a clean profile, and adjust gridlines and labels. Test the setup by changing a source value to confirm the chart redraws properly, then save the workbook as a template for future use.
Step Chart
Google Sheets also lacks a dedicated step chart type in its standard menu, but offers several workarounds:
- Expand the data table. Pair each x-value or category boundary with its y-value, duplicating points so transitions draw vertically. You can repeat each original value across two rows with slightly shifted x-values, or use array formulas to generate the duplicated sequence automatically when source data changes.
- Insert and configure a line chart. Plot the expanded table as a line chart and set the x-axis to a continuous scale in the chart editor. Turn off line smoothing and adjust point display so the stepped corners stay crisp.
- Consider column-based alternatives. You can also create a step effect without add-ons by using a stacked column chart with narrow columns placed side by side, or a combo chart that pairs a column series with a line series to emphasize flat and jump segments.
Save the configured chart as a template to reuse the setup on future datasets.
Step Chart
Thoughtful styling makes a step chart readable across projectors, mobile screens, and print:
- High-contrast line colors: Choose colors that differ strongly in luminance from the background—such as dark navy or charcoal on a white or light gray background, or bright orange or teal on a dark background. Avoid low-contrast pastels, which fade at small sizes or in print. When plotting multiple step series, differentiate them by both hue and lightness for readers with color vision deficiencies, and pair solid lines with dashed or dotted styles for secondary series.
- Subtle grid lines: Use thin, light gray, often dashed background lines placed at meaningful data intervals so viewers can trace values without visual competition. Prefer horizontal grid lines only; vertical grid lines can clutter the vertical step risers and should be kept extra light or omitted entirely.
- Clear data markers: Highlight exact values at step changes using markers that contrast with the line, such as white-filled circles with a colored border. Size them large enough to be seen without obscuring the step corners, and keep marker shapes consistent within each series.
Step Chart
Two common construction errors can distort a step chart’s meaning:
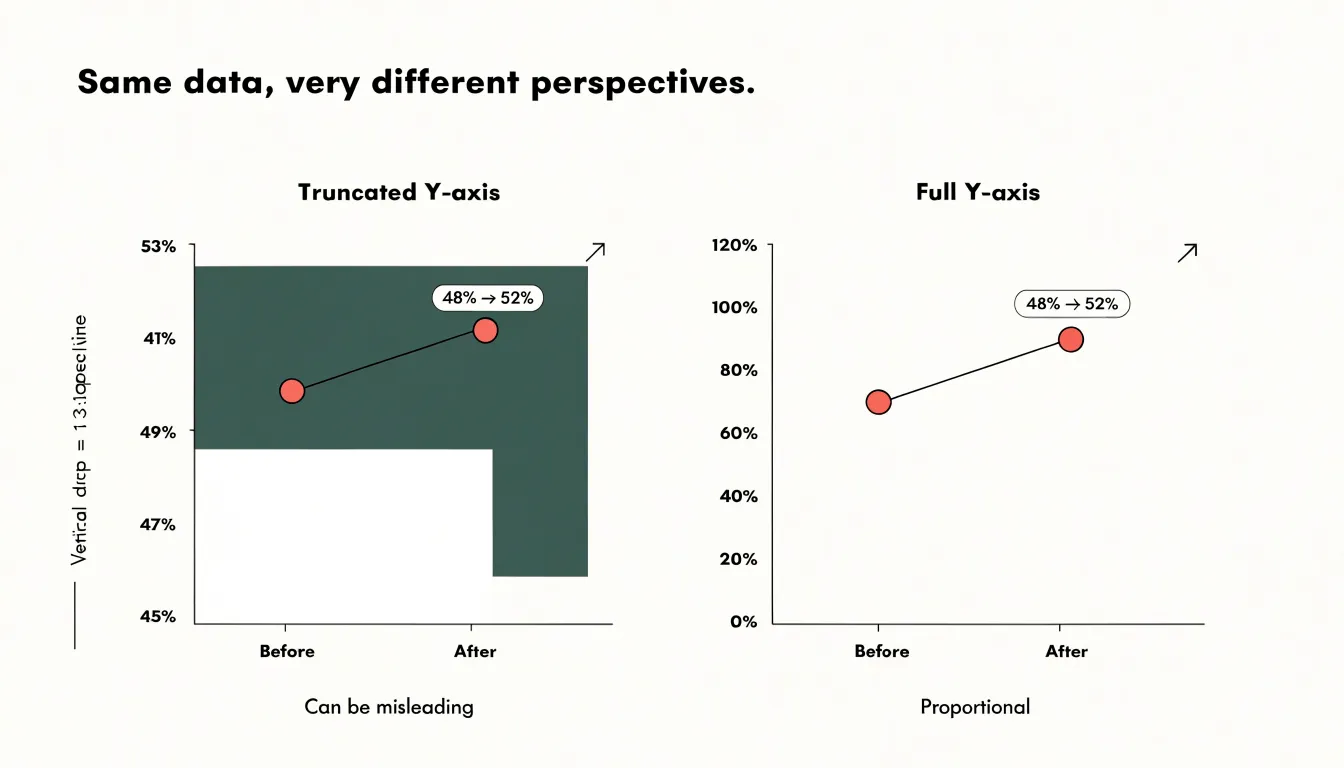
- Truncating the vertical axis: Starting the y-axis well above zero magnifies small fluctuations into dramatic cliffs. If a metric moves from 48% to 52% on an axis starting at 45%, the step looks enormous. Start the vertical scale at a meaningful baseline—usually zero for quantities and totals—to keep step heights proportional to actual changes. When zooming in is necessary, state the truncated baseline explicitly in a subtitle or annotation.
- Connecting across missing data or irregular intervals: Skipping missing data points causes the chart to draw a long flat segment across the gap, falsely implying the metric was measured and held constant. Split the line into separate segments with a visible break to show where data is missing. Similarly, spacing points evenly when they were recorded at irregular time intervals stretches or compresses the timeline; always use a uniform time scale.
Step Chart
Both step charts and bar graphs show values across categories, but they treat time differently. A bar graph renders each value as a standalone column separated by whitespace. That gap signals separation, which works well for distinct categories like product lines or geographic regions, but distorts continuous time series where the underlying variable never pauses between measurements.
Because a step chart connects horizontal segments with vertical risers in a single sequence, it preserves progression along the horizontal axis. Bar graphs emphasize magnitude comparisons at isolated snapshots, obscuring how a value carried forward between observations. When the analytical goal centers on continuity, state persistence, or the timing and duration of transitions, the connected step line keeps those temporal relationships intact.
Step Chart
The flat segments and sharp corners of a step chart provide clear visual anchors for annotations without obscuring the data:
- Point callouts: Place a short text label just above or beside a new level to show its exact value, or use a leader line to connect longer explanations to the vertical riser where a policy shift or price adjustment occurred. For dense timelines, use numbered markers paired with a brief legend to keep the plot area clean.
- Contrasting accent colors: Use a neutral palette for baseline steps and reserve a single saturated hue for major adjustments. Applying that accent color to both the callout marker and its corresponding step segment links the label to the data even at small sizes.
- Background shading: Shade across a range of steps to highlight an extended period—such as sustained elevated pricing—complementing point callouts with broader context.
Keep annotations selective, marking only consequential shifts like structural breaks or policy-driven rate changes so the visual hierarchy stays clear.
Step Chart
Interactive features turn a static step chart into a responsive dashboard tool:
- Hover states: When a user moves the pointer across the chart, highlight the nearest step segment or point via a subtle color shift or raised marker. On dense multi-metric dashboards, this immediate feedback confirms which stair-step segment is under examination without forcing the eye to scan the entire line.
- Custom tooltips: Display the timestamp or category, the exact value at that step, the change from the previous step (showing both prior and new levels to clarify the transition), and any relevant metadata like targets or thresholds. Format numbers with consistent units, delimiters, and rounding.
Hiding granular labels inside tooltips keeps the main plot clean while giving users fast access to exact figures. Use smooth transitions, sensible hover delays, and tooltip positioning that does not cover the active step.
Step Chart
In executive dashboards and multi-page reports, layout and grouping help readers connect stepped trends to business outcomes:
- Primary placement: Position the step chart near the top or center of the main view, directly above or beside the KPIs it explains, so it establishes the sequence of events before readers examine supporting metrics.
- KPI grouping and color coding: Pair the chart with related KPI tiles—for example, placing a pricing step chart next to revenue-per-customer and margin tiles—so executives see before-and-after impacts without switching tabs. Use consistent color coding and shared annotation vocabulary between the chart and its companion tiles to reduce cognitive load.
- Predictable layout across pages: In multi-page reporting suites, keep step charts in a consistent spot (such as the left column or top band) so readers can locate them quickly and compare across periods. Reserve step visuals for genuinely discrete data; overusing them across a dashboard dilutes their visual impact.
Frequently Asked Questions
What is a step chart used for?
A step chart represents data that does not move gradually between values, using flat horizontal segments for steady values and vertical risers at the exact moment a change occurs. It is well suited for discrete changes such as interest rates, tax brackets, and subscription pricing tiers.
How is a step chart different from a line chart?
A standard line chart connects adjacent data points with a straight segment, implying gradual, continuous movement. A step chart keeps flat stretches visibly flat and places jumps where they occurred, which avoids implying that a discrete value drifted through intermediate states.
When should I use a step chart instead of a line chart?
Use a step chart when the underlying data actually moves in discrete jumps and each break between flat stretches corresponds to an identifiable source event. Values captured at fixed intervals from a continuously varying source, such as a thermometer logging every minute, belong on a line chart.
How do I read a step chart?
Trace the chart from left to right: follow each horizontal segment to see how long a constant value lasted, then note the vertical step that ends it. The x-position of the vertical step gives the exact time of change, and the y-difference gives the size of the change.
How do I create a step chart in Excel?
Excel has no built-in step chart type, so you build a helper table with two repeated rows for each data point: one holding the category or date with the previous value and a second holding the same category with the new value. Then insert a 2D line chart and set the horizontal axis to a text axis, or to a date axis with the base unit fixed to one day.
What common mistakes should I avoid in a step chart?
Avoid truncating the vertical axis, which can magnify small fluctuations into dramatic cliffs; start the vertical scale at a meaningful baseline, usually zero for quantities and totals, and state any truncated baseline explicitly if zooming in is necessary. Also avoid connecting across missing data or irregular intervals, since this can falsely imply the metric was measured and held constant or distort the timeline.
Tony Astor
Tony writes about data visualization and the tools people use to build charts and dashboards. More about Data Illustrator