Stacked vs Grouped Bar Chart: Which Should You Use?
 By Tony Astor ·
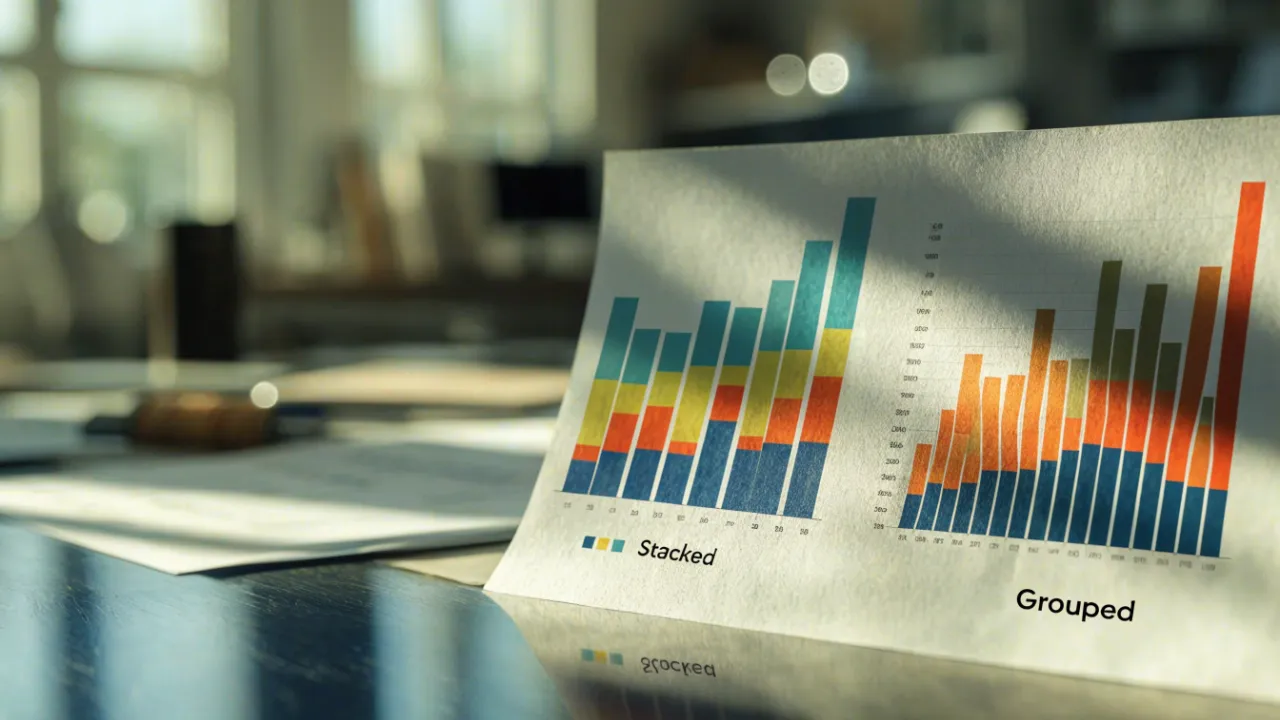
Stacked vs Grouped Bar Chart
Grouped bar charts place subgroup bars side by side on a shared baseline for precise comparisons within and across categories. Stacked bar charts stack segments to show part-to-whole totals and composition. Choose grouped when comparing individual values, stacked when the total matters, and 100% stacked when relative proportions matter more than absolute totals.
Table of Contents
Bar Charts
Bar charts serve as one of the most direct tools for comparing values across categories. At their core, they translate quantities into rectangular bars whose lengths correspond to the magnitude of each value, allowing readers to grasp relative differences at a glance. This simplicity makes bar charts a dependable starting point for working with categorical data to show how distinct variables measure up against one another.
The fundamental principle behind a standard bar chart is proportionality. Each bar’s length represents a value on a common scale, so comparing two categories becomes a matter of comparing two lengths. When the bars share a baseline, differences in height or width translate immediately into differences in magnitude, and readers can rank categories from largest to smallest without mental calculation. The categorical axis carries the labels, while the numeric axis provides the scale that anchors every comparison.
Clarity depends on several design choices:
- Consistent geometry: Bars should remain a consistent width, with spacing that separates categories without fragmenting the chart.
- Zero baseline: The baseline should begin at zero, since truncating the axis distorts perceived differences and undermines trust in the visual.
- Logical ordering: Ordering categories by value, or by a meaningful sequence such as time or rank, helps readers follow the comparison rather than hunting for patterns.
- Clean labeling: Labels and axis values should be legible and unobtrusive, keeping attention on the data itself.
Bar charts also accommodate multiple variables through orientation. Horizontal bars work well for long category names and many categories, while vertical bars suit shorter labels and conventional presentations. Color can distinguish groups or highlight a particular category, provided it is used sparingly and consistently. These principles form the foundation for more elaborate variants, including the stacked and grouped bar charts that extend the basic form to multiple series.
Grouped Bar Charts
Grouped bar charts organize data into clusters, where each primary category on the axis contains a set of bars placed side by side. This cluster layout allows readers to compare discrete subgroup metrics directly within each major category, since the bars for every subgroup sit adjacent to one another at the same position along the axis. A typical example is a chart of quarterly revenue broken down by region: each quarter forms a cluster, and within that cluster a separate bar represents each region, so the viewer can scan across the cluster to see how regions perform relative to one another in that quarter, then move to the next cluster to follow the same comparison over time.
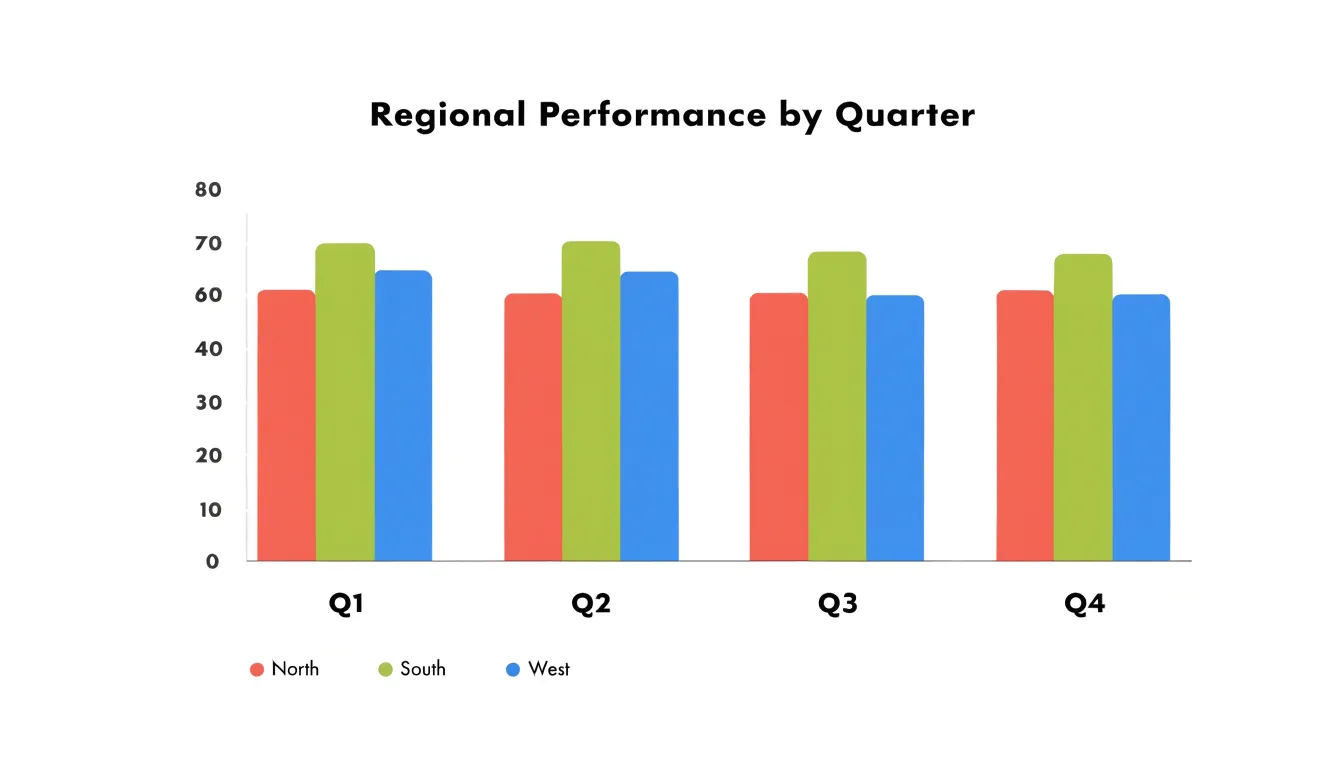
The structure of a grouped chart rests on two levels of categorization. The major categories, such as quarters, products, or departments, determine the position of each cluster along the primary axis. The subgroups, such as regions or customer segments, determine the individual bars inside each cluster, usually distinguished by color and identified through a legend. Because every cluster contains the same set of subgroups in the same order, the chart supports consistent visual scanning: a reader can track a single subgroup across all clusters by following one color or bar position, or compare all subgroups within a single cluster by reading left to right.
This layout suits datasets where the subgroups are discrete and the number of subgroups per cluster stays modest, typically between two and five. With more subgroups, the bars within each cluster grow thin and the comparisons become harder to make. Spacing between clusters, consistent bar widths, and a clear legend all help preserve readability.
Stacked Bar Charts
A stacked bar chart places the segments of each category directly on top of one another, so the full height of the bar represents the combined total for that category. Reading a stacked bar starts with the overall length of the bar, which gives an immediate sense of magnitude across categories, and then moves inward to the individual segments, each of which shows how much a particular subgroup contributes to that total. This dual reading makes the stacked format well suited to part-to-whole questions, where the goal is to explain what makes up a result rather than simply to compare isolated values.
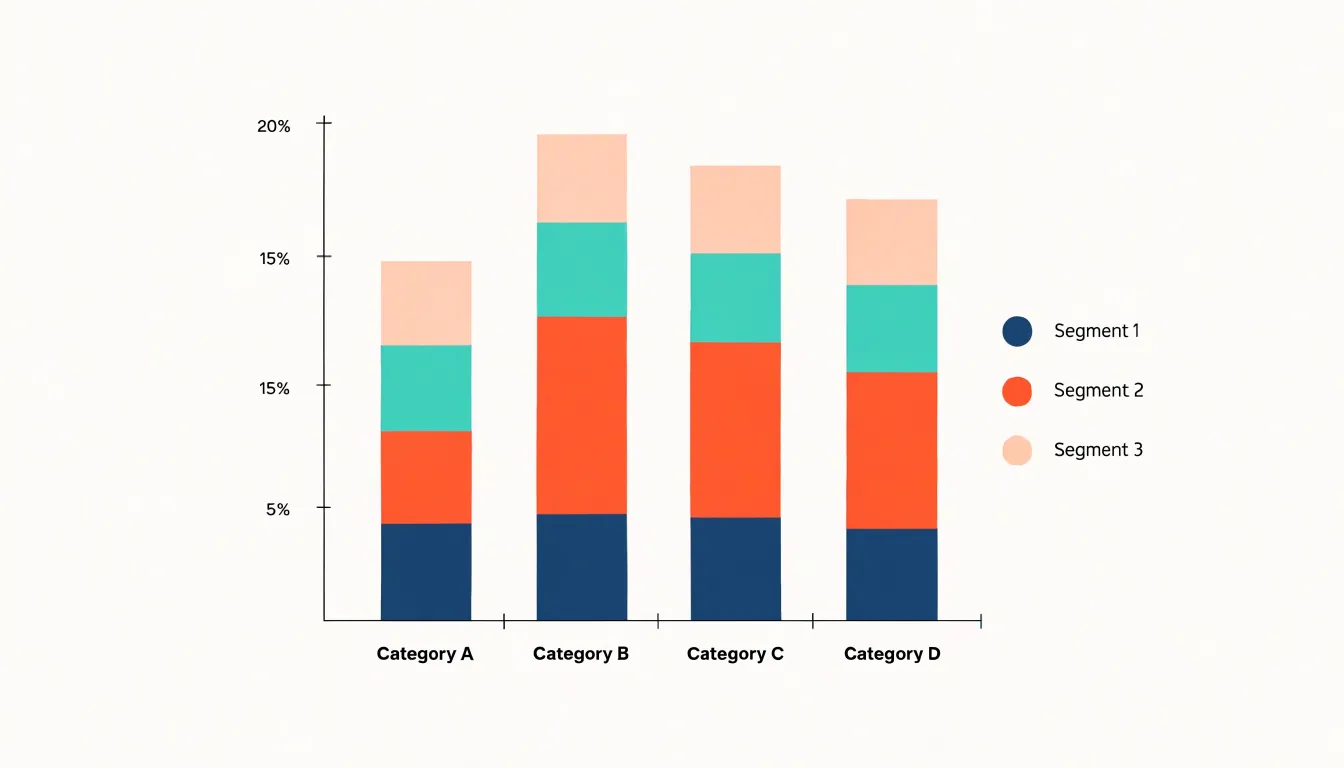
The stacking arrangement turns each bar into a compact visual sum. A viewer can scan the tops of the bars to compare totals between categories, then examine the internal divisions to see which components drive those totals. When the same color order is used consistently across bars, patterns in composition become visible, such as a growing share for one subgroup or a component that stays roughly constant while the total expands.
Stacked charts work best when the number of segments stays modest, since many thin slices become difficult to distinguish and label. Ordering segments by size or by a meaningful sequence helps readers follow the progression from bottom to top. With a clear legend and thoughtful color choices, the stacked bar chart communicates two messages at once: the overall scale of each category and the internal makeup that produces it.
Grouped vs Stacked
Choosing between grouped and stacked bars comes down to what question your readers need answered. Grouped bars place each subgroup side by side within every category, giving each bar its own baseline on the category axis. If the story is about which region sold more, which product outpaced its rival, or how one subgroup changed from quarter to quarter, grouped bars deliver that comparison with minimal interpretive effort.
Stacked bars organize the same data differently, prioritizing the whole. This layout answers questions about proportion and contribution: how much of the total came from each subgroup, and how the mix shifted between categories. Stacked charts also use space efficiently and keep the aggregate visible at a glance, which matters when the total itself is the headline.
The trade-off is real. In a stacked bar, only the bottom segment shares a common baseline; every segment above it starts at a different height, making comparisons between those segments across categories harder and sometimes misleading. Grouped bars, meanwhile, fragment the aggregate, so readers must mentally sum the bars to recover the total, and the chart grows wide as subgroups multiply.
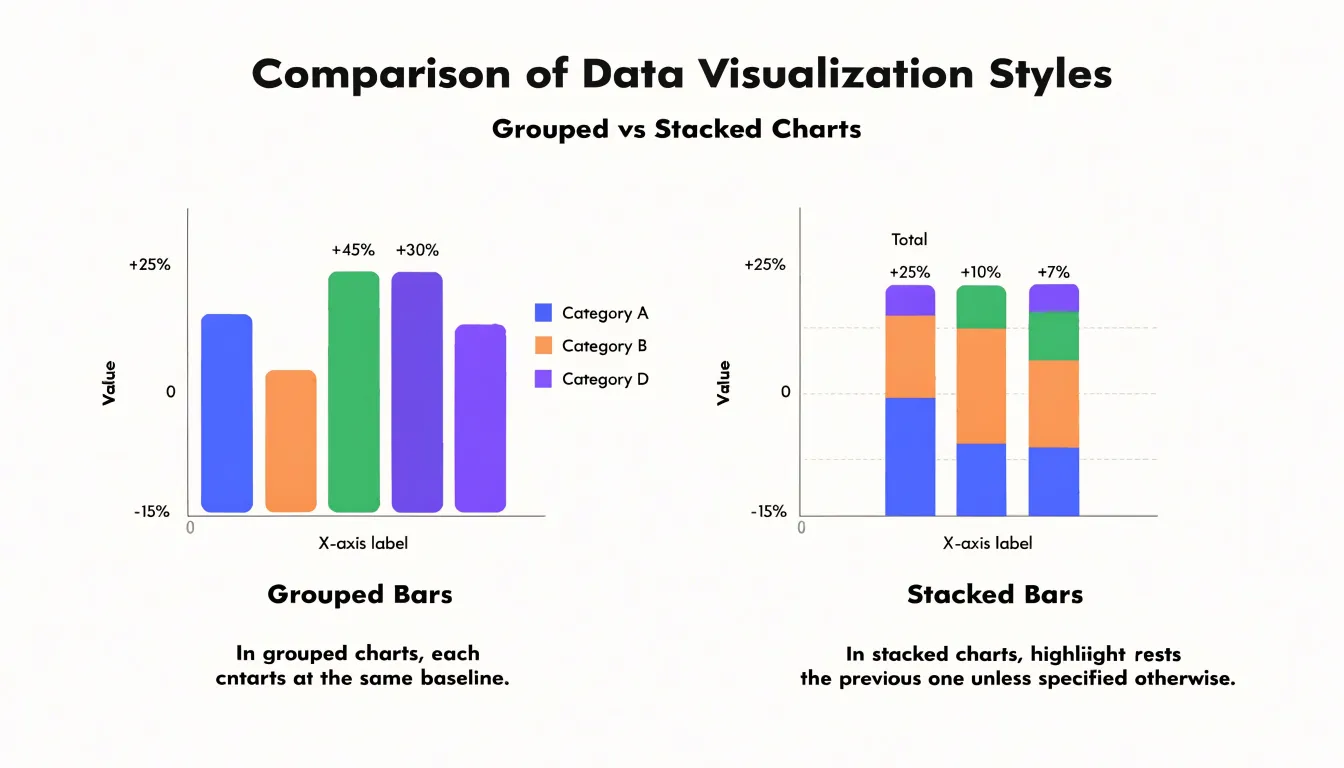
A practical approach is to decide which comparison is primary. When differences between subgroups drive the message, choose grouped bars. When the total and its internal makeup drive the message, choose stacked. Where both matter, consider pairing the charts or annotating totals so readers get composition and comparison without sacrificing accuracy.
Grouped Bar Charts
Because all bars in a grouped cluster grow from the same starting line, the eye can compare their heights directly without estimating offsets or doing mental subtraction. Subtle value variations that might be obscured in a stacked layout become visible, since each bar’s full length represents its own value rather than a cumulative total.
This makes grouped bars especially useful when the analytical question concerns the relative performance of sub-items within a category. A marketing team comparing quarterly revenue across three regions can see at a glance which region leads in each quarter and how wide the gaps are. Similarly, a researcher tracking survey responses by age bracket can quickly identify shifts in which subgroup responds most favorably.
Positive and negative values also read clearly in this format as bars extending in opposite directions from the shared zero line. With a sensible color scheme and a fixed order of sub-categories, grouped bar charts turn cluster-level comparison into a quick visual task, helping audiences detect small but meaningful differences.
Stacked Bar Charts
Stacked bar charts are a natural fit for tracking totals over time while preserving a visible breakdown of what those totals are made of. When the goal is to monitor macro-level growth trends, the overall height of each bar provides an immediate read on how a total is changing from period to period, without requiring a second chart or a separate table.
This dual view supports monitoring questions such as whether total revenue is rising steadily, and whether that growth is spread evenly across product lines or concentrated in one area. Stacked bars also suit situations where the sum itself carries meaning, such as cumulative sales across regions or total spending across departments, since the chart visually anchors every segment to the whole it belongs to. The format works well for dashboards and reports where leadership needs a compact overview of both aggregate performance and internal composition, reducing the need to switch between summary and detail views.
100% Stacked Bar Charts
A 100% stacked bar chart converts each bar into a uniform length by normalizing its constituent segments to percentages of the total. Every bar represents 100 percent, and each segment’s height reflects its share of that bar’s total. This normalization allows you to compare the composition of different categories even when their absolute totals vary widely.
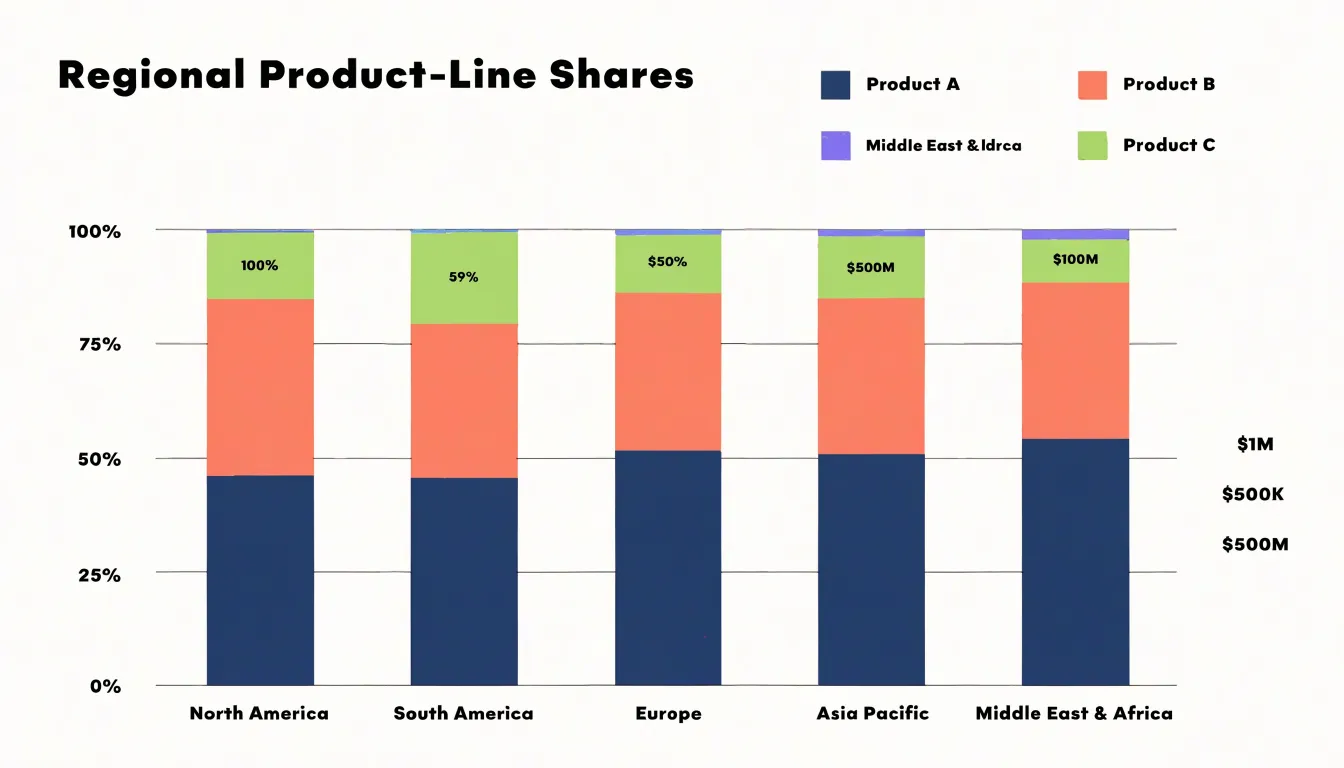
For example, if you are comparing the sales mix of products across regions with vastly different revenue volumes, a 100% stacked bar chart highlights the proportion of each product line within each region, making patterns and differences in distribution immediately visible. The chart type shifts the focus from magnitude to relative contribution, which is particularly useful when the question is about structure rather than size. By standardizing each bar to the same length, the viewer can quickly assess which segments dominate in each category and how those proportions change across groups. This makes 100% stacked bars effective for spotting shifts in market share, budget allocation, or survey response distributions.
However, because the total volume information is removed, it is important to ensure that the audience understands the chart is showing percentages, not absolute values. Clear labeling and a legend are essential to avoid misinterpretation. When used appropriately, the 100% stacked bar chart provides a concise visual summary of proportional data, enabling comparisons that would be obscured in a standard stacked bar chart where varying totals distort the visual weight of segments.
Cognitive Load
Visual processing demands differ meaningfully between grouped and stacked layouts. In a grouped chart, every bar sits on a shared baseline, so readers judge segment magnitude through a single perceptual act: comparing bar lengths against a common reference. The eye moves horizontally across aligned bars and extracts differences directly.
For stacked charts, only the bottom segment rests on the baseline. Segments above it float, with both their start and end points determined by the cumulative sum of the segments below. To read such a segment, a viewer must locate its top and bottom edges, mentally subtract one from the other, and hold both endpoints in working memory. Each additional layer compounds this effort, particularly in middle segments where neither edge aligns with anything familiar.
Research on graphical perception shows that position along a common scale is decoded more accurately than length or area judgments without such a scale. The stacked layout removes the shared scale for all but the first segment, pushing readers toward the more error-prone operation of estimating lengths between floating endpoints. This burden multiplies when viewers try to compare a single segment across multiple stacked bars, since each instance occupies a different vertical band depending on the values beneath it. Grouped charts sidestep this by placing corresponding segments on the same baseline, trading horizontal space for straightforward decoding.
Visual Clutter
Visual clutter becomes a central design concern when a grouped bar chart carries many series or sub-categories. Each additional series adds another bar to every group along the category axis. As the number of series climbs, the chart begins to resemble a dense thicket of vertical rectangles, and the viewer struggles to trace a single series across the groups or to isolate the tallest and shortest bars within a cluster. The result is a chart that technically contains the data yet practically resists reading.
Several strategies help reduce clutter:
- Limit series count: When a dataset contains a dozen sub-categories, select the most important handful for the chart and move the remainder into a table, an appendix, or a separate view.
- Order consistently: Ordering series from largest to smallest within each group, or maintaining a consistent order across all groups, gives the eye a predictable scanning pattern.
- Use restrained color and spacing: Assign distinct but harmonious hues to each series without turning the chart into a rainbow. Maintain consistent gaps between bars within a group, and slightly wider gaps between groups, to reinforce the clustering logic.
- Label directly: Direct labels on the bars can replace a crowded legend, and annotations can draw attention to the few values that matter most.
When the number of series remains high, alternative layouts deserve consideration. Small multiples, where each series receives its own compact panel, preserve the comparison across categories while removing the visual competition inside a single chart. A stacked bar chart offers another route, trading side-by-side comparison for a clearer sense of the whole.
Segment Readability
The perceptual challenges of stacked charts directly affect how reliably viewers can read individual segments. Because a segment that floats mid-column offers no common anchor, its apparent size depends on the cumulative total beneath it. Consequently, two segments with identical values can look different simply because their supporting stacks differ in height. Conversely, segments of clearly different magnitudes can appear similar when their offsets happen to align.
Cumulative totals compound the difficulty. The top edge of each bar represents a sum, and readers often conflate that outer boundary with the value of the uppermost segment. Distinguishing the top segment’s own height from the overall column height requires careful tracing of two edges, and small gaps or gradients between segments only add to the ambiguity.
These limitations grow with the number of segments and the similarity of their magnitudes. When several mid-stack segments are close in value, the floating edges become hard to rank by eye. The result is a chart that conveys overall totals reasonably well while making internal composition comparisons unreliable.
Color and Axis Choices
Color and axis choices carry much of the interpretive weight in any bar chart. In stacked charts, the palette needs to separate sub-category segments distinctly while still reading as a coherent family of colors. A common approach is to assign a single hue family to one top-level category and vary lightness or saturation across its sub-categories, which helps the eye group related segments and distinguish them at the same time.
Grouped charts place bars side by side, shifting the priority toward strong differentiation between adjacent bars, since easy confusion between neighboring colors undermines the comparison. Across both chart types, colors should remain distinguishable for viewers with color vision deficiencies. Avoid pairings such as red and green as the sole differentiator, and test palettes against grayscale or simulation tools. Ordering the legend to match the visual stacking or grouping order reinforces the link between color and category.
For the axes, consistent tick intervals and clearly labeled units prevent readers from misjudging scale. When a stacked chart represents parts of a whole, axis limits should accommodate the largest total without clipping. Equally important is the choice between absolute values and percentages: because percentage stacking normalizes every bar to the same height, the axis label must clearly state which convention applies. Subtle gridlines and legible axis labels round out the design.
Use Cases
Grouped and stacked bar charts serve distinct purposes across common business and research scenarios:
- Survey results: When respondents answer questions with a fixed set of choices, a grouped bar chart lets an analyst line up each option across demographic segments so differences in preference become immediately visible. A stacked bar chart shows how each segment’s answers combine into a total response profile, helping researchers see the overall distribution of opinion at a glance.
- Financial reporting: Quarterly revenue can be broken into product lines, regions, or operating segments. A stacked bar chart displays how each stream contributes to the total while preserving the shape of the whole across periods. Analysts comparing actual figures against budget or prior-year results often favor grouped bars because the parallel columns make the gap between plan and outcome easy to read.
- Sales breakdowns: A regional sales manager tracking product performance across territories can use grouped bars to compare individual products within each territory, or stacked bars to show how each product’s contribution builds the territory total.
- Marketing campaigns: Teams watching how spend or conversions divide between email, paid search, and social channels use grouped bars to compare channel performance directly or stacked bars to track total campaign volume and channel mix.
Common Mistakes
Several common mistakes can distort bar chart data and mislead viewers:
- Truncated Y-axis: Starting the scale at a value other than zero exaggerates differences between bars. For example, starting a sales chart’s Y-axis at 90 instead of 0 can cause a 5% difference to look like a 50% gap. Always start the Y-axis at zero unless there is a compelling reason not to, and clearly label any truncation.
- Inconsistent scaling across charts: When comparing multiple charts, using different scales can lead to incorrect conclusions about relative magnitudes—such as showing revenue in thousands on one chart and in millions on another without clear labeling. Ensure all charts in a comparison use the same scale, or explicitly state the differences.
- Overly complex visual hierarchies: Using 3D effects, excessive colors, or cluttered labels distracts from the data. 3D bars, in particular, make values harder to read accurately because of perspective distortion. Use solid colors and avoid unnecessary embellishments.
- Inconsistent bar widths or spacing: Varying geometry creates visual confusion. Bars should be uniform in width and spaced evenly.
- Inappropriate chart type: Stacking bars when the total is not meaningful obscures individual category comparisons.
- Missing context: Always include units, data sources, and clear titles so viewers can make informed interpretations.
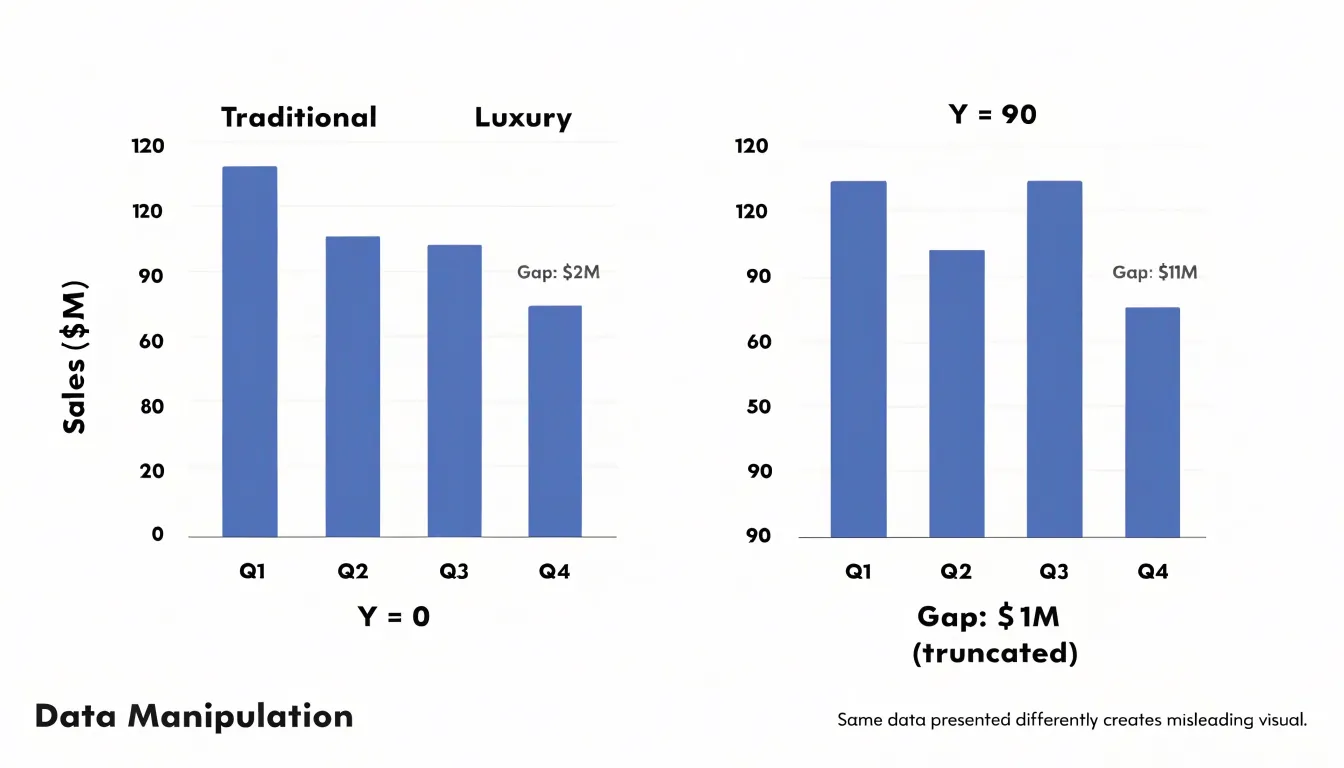
Chart Selection Framework
Before you open a charting tool, a short round of structured questions will save considerable rework later.
- Identify the audience and medium: Who will read this chart, and what is their familiarity with the data? A leadership review, a technical team, and a public audience each bring different expectations about density, labeling, and self-sufficiency. Ask also how the chart will be consumed—projected in a meeting, embedded in a report, or skimmed on a dashboard—since that shapes sizing, annotation, and color choices.
- Clarify the primary message: Every chart should answer one question clearly. Write that question down in a sentence: is it a comparison of totals across categories, a breakdown of parts within each category, or a trend over time? Naming the message first lets you test candidate layouts against it. If two messages compete, consider splitting them into two charts rather than overloading one.
- Examine the data structure: Count the categories and subgroups, check whether values are absolute or proportional, and note whether the subgroups are the same across all categories. Beyond three or four segments, stacked bars become hard to read and grouping grows cluttered.
Run these questions in order—audience, message, data—and record the answers. The framework turns chart selection from a matter of taste into a defensible decision you can explain to reviewers.
Summary Guidelines
Use these concise rules to guide your final selection between stacked and grouped bar charts:
- Primary message: Choose a stacked bar chart to emphasize totals and composition across primary categories. Choose a grouped bar chart for precise, side-by-side comparisons of subcategory values.
- Number of subcategories: Keep subcategories to three or four at most. With more, stacked segments become too thin to read and grouped clusters become wide and unwieldy; consider small multiples instead.
- Part-to-whole relationships: Use a 100% stacked bar chart when relative proportions matter more than absolute totals. Grouped bars do not show part-to-whole relationships clearly.
- Subcategory patterns: Use grouped bars to spot which subcategory is largest within each group and to track a specific subcategory across groups. Stacked bars emphasize larger segments and can hide smaller ones.
- Audience and testing: For a quick executive summary, stacked bars with clear labels communicate total and composition in one view. For detailed analysis, grouped bars offer higher precision. Always test your chart with a sample audience to ensure the intended takeaway is immediate.
Frequently Asked Questions
When should I use a grouped bar chart instead of a stacked bar chart?
Use grouped bars when the primary message is comparing subgroup values side by side or tracking one subgroup across categories. Choose stacked bars when the total and its internal makeup are the main story.
Can I compare individual segments in a stacked bar chart?
Only the bottom segment shares a common baseline; segments above it start at different heights, making comparisons between those segments across categories harder and sometimes misleading. Stacked bars convey overall totals reasonably well while making internal composition comparisons unreliable.
How many subcategories or segments should a stacked or grouped bar chart have?
Keep subcategories to three or four at most. With more, stacked segments become too thin to read and grouped clusters become wide and unwieldy; consider small multiples instead.
When should I use a 100% stacked bar chart?
Use a 100% stacked bar chart when relative proportions matter more than absolute totals. Because total volume information is removed, clear labeling and a legend are essential to avoid misinterpretation.
Why shouldn’t I truncate the y-axis on a bar chart?
Starting the scale at a value other than zero exaggerates differences between bars. Always start the Y-axis at zero unless there is a compelling reason not to, and clearly label any truncation.
What makes a stacked bar chart harder to read than a grouped one?
In stacked charts, only the bottom segment rests on the baseline; segments above it float, so viewers must locate both edges and mentally subtract one from the other. Grouped charts place corresponding segments on the same baseline, trading horizontal space for straightforward decoding.
Tony Astor
Tony writes about data visualization and the tools people use to build charts and dashboards. More about Data Illustrator