Stacked Bar Chart: Uses, Examples and Common Pitfalls
 By Tony Astor ·

Stacked Bar Chart
A stacked bar chart is a visualization that displays totals as full bar heights while dividing each bar into colored segments that show how the total breaks down into its parts. The bar height communicates the aggregate value, and the stacked segments reveal each component’s contribution, letting viewers read totals and composition together in one compact chart.
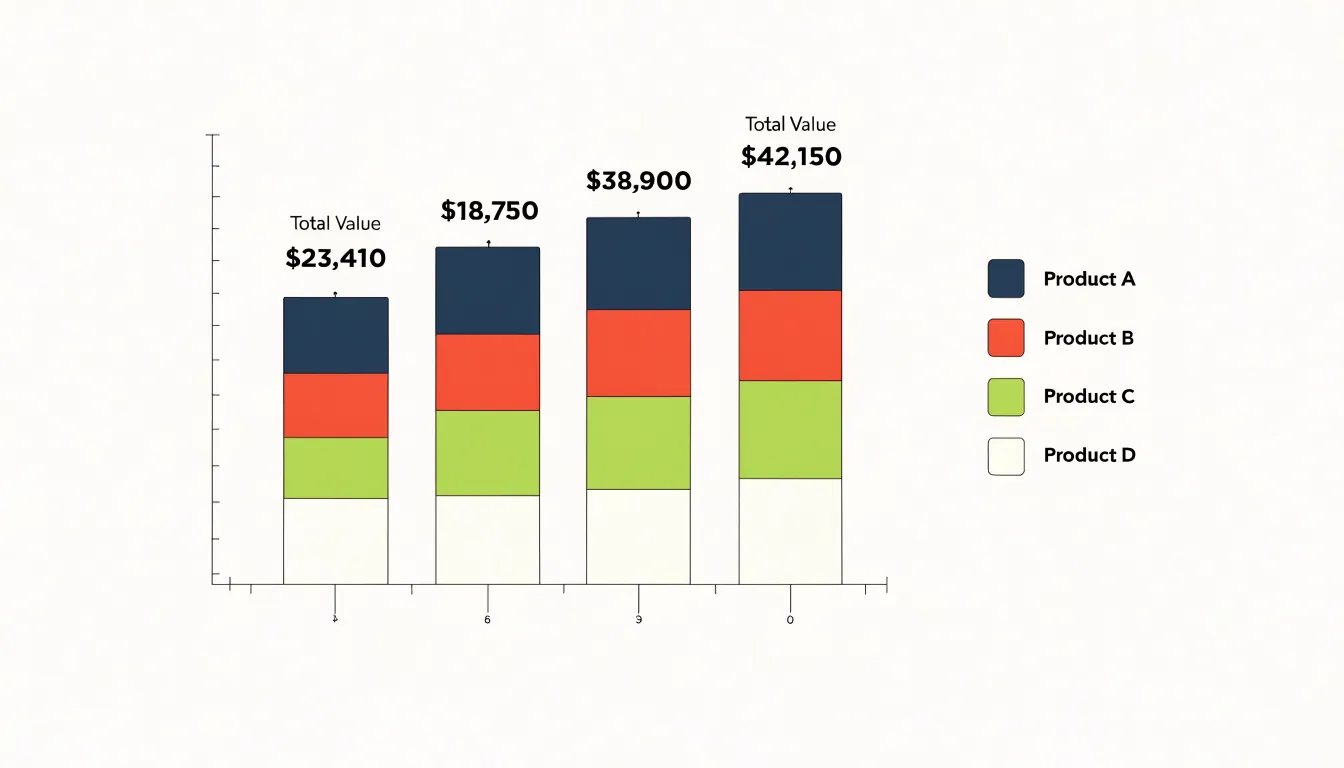
Table of Contents
- Understanding Data Visualization
- The Core Anatomy
- Standard Stacked Charts
- Percentage Stacked Charts
- Business Sales Tracking
- Survey Result Analysis
- Budget and Expense Breakdown
- Website Traffic Monitoring
- Comparing Two Chart Types
- Interactive Chart Features
- Choosing the Right Software
- Quick Design Checklist
Understanding Data Visualization
Stacked bar charts earn their place on any dashboard through a simple act of compression. Rather than dedicating a separate chart to every segment of a category, a single stacked bar carries the whole story: the total height of the bar communicates the aggregate figure, while the colored divisions inside it show how that total divides into its parts. The result is a compact visual that packs two layers of information into one footprint.
This economy matters most in dashboard design, where screen real estate is finite and every additional chart competes for the viewer’s attention. A team tracking revenue across regions, for instance, could devote one chart to totals by region and another to product breakdowns within each region. A stacked bar chart folds both into one display, freeing space for other metrics while keeping related information physically close together. The viewer’s eye travels only a short distance between a total and its components, which makes comparisons faster and interpretation more intuitive.
The dual reading happens at a glance. Scanning across the tops of the bars reveals the macro-level trend, highlighting which categories are largest and how they change across the axis. Dropping attention into the individual bands reveals the micro-level composition, showing which segments contribute most to each total and how that mix shifts from bar to bar. A category whose total stays flat while its internal proportions change tells a story that neither a total-only chart nor a segment-only chart could convey on its own.
For analysts communicating to mixed audiences, this layered structure is especially practical. Executives can read the overall pattern from the bar heights, while specialists can examine the segments for supporting detail, both engaging with the same chart without needing separate views. That shared reference point reduces miscommunication and keeps discussion anchored to a single, coherent picture of the data.
The Core Anatomy
A stacked bar chart organizes data along two primary axes that work together to give the visualization its meaning. The categorical axis, usually horizontal, identifies the main groups being compared, while the value axis, usually vertical, establishes the measurement scale against which every segment is sized. Each bar on the chart represents one category, and within that bar, sub-segments are stacked end to end to show how component parts combine into a total.
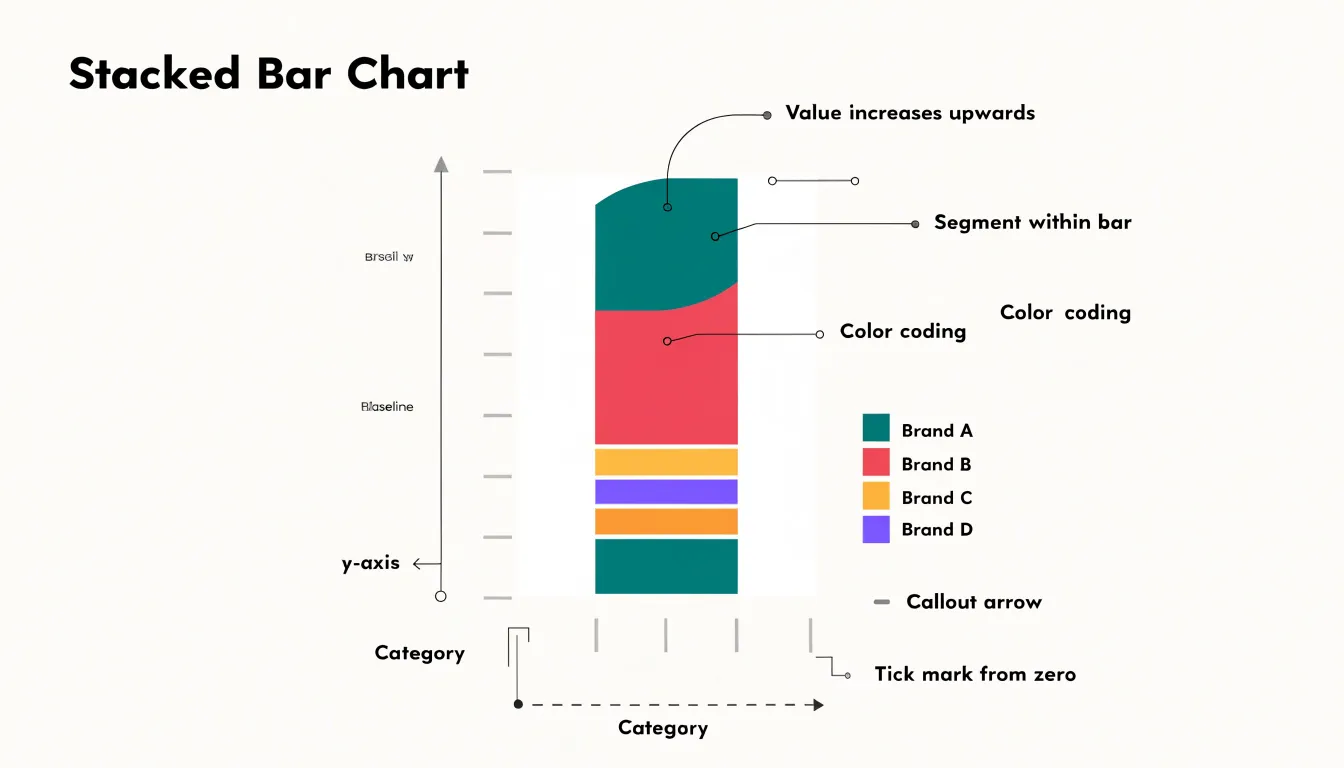
Color coding is the mechanism that connects sub-segments across all the bars. A consistent palette maps each component to a specific hue, so the eye can track that component from bar to bar and compare its contribution across categories. The legend provides the key to this mapping, listing each color alongside its component name. Legend placement matters for readability; it conventionally sits above or beside the plot area where it can be scanned without obscuring the data. Ordering the legend to match the stacking order reinforces the correspondence between label and segment.
Baseline alignment gives the chart its interpretive foundation. Every bar begins at the same zero line, which anchors the total lengths and makes bar-to-bar comparison of overall magnitude valid. Within each bar, segments stack upward from the baseline in a defined sequence, so the position of a segment reflects the cumulative sum of everything beneath it. A consistent stacking order across bars preserves this logic and lets viewers compare individual segments at matching positions. When the chart includes multiple series or grouped categories, alignment rules extend to keeping stacks parallel and evenly spaced along the categorical axis. These structural components—axes, color-coded segments, legend, and baseline—form the skeleton on which the chart’s message hangs, and each one supports the others in communicating part-to-whole relationships.
Standard Stacked Charts
Standard stacked charts use absolute values to display cumulative totals while simultaneously revealing how each total divides into its component segments. Each bar in the chart represents a distinct category or group, and the full height of that bar corresponds to the overall total for that group. Within the bar, individual segments are stacked end to end, with each segment sized in proportion to the absolute value it contributes. This dual reading makes the standard stacked chart effective when an audience needs to see both the size of each group’s total and the composition of that total at the same time. A regional sales chart, for instance, can show each region’s overall revenue as the bar height while the segments reveal how much of that revenue came from each product line. Because the segments are measured from a common baseline, readers can trace the growth of any individual segment across groups by following a consistent vertical band from bar to bar, so long as segment order remains fixed. The cumulative total at the top of each bar gives a direct visual comparison of group sizes, and differences in bar heights translate immediately into differences in overall magnitude. This makes the format well suited to reports where totals are the headline figure and the internal split is supporting context, such as budget breakdowns by department, shipment volumes by carrier, or population counts by age bracket across countries. Design choices matter here: consistent segment ordering, a clear legend, and readable labels help viewers decode the internal distribution without losing sight of the totals the chart is primarily built to compare.
Percentage Stacked Charts
Percentage stacked charts begin with a simple transformation: every bar in the dataset is rescaled so that its components sum to 100%. This normalization converts raw counts, dollars, or units into proportions, allowing readers to compare the internal composition of different categories directly. A bar representing ten thousand units and a bar representing two hundred units occupy the same vertical space once both are expressed as percentages, which means the eye is drawn to the shape of each stack rather than its height. The segments within each bar then communicate the share of the whole held by each subcategory, whether those are product lines, survey responses, or time allocations.
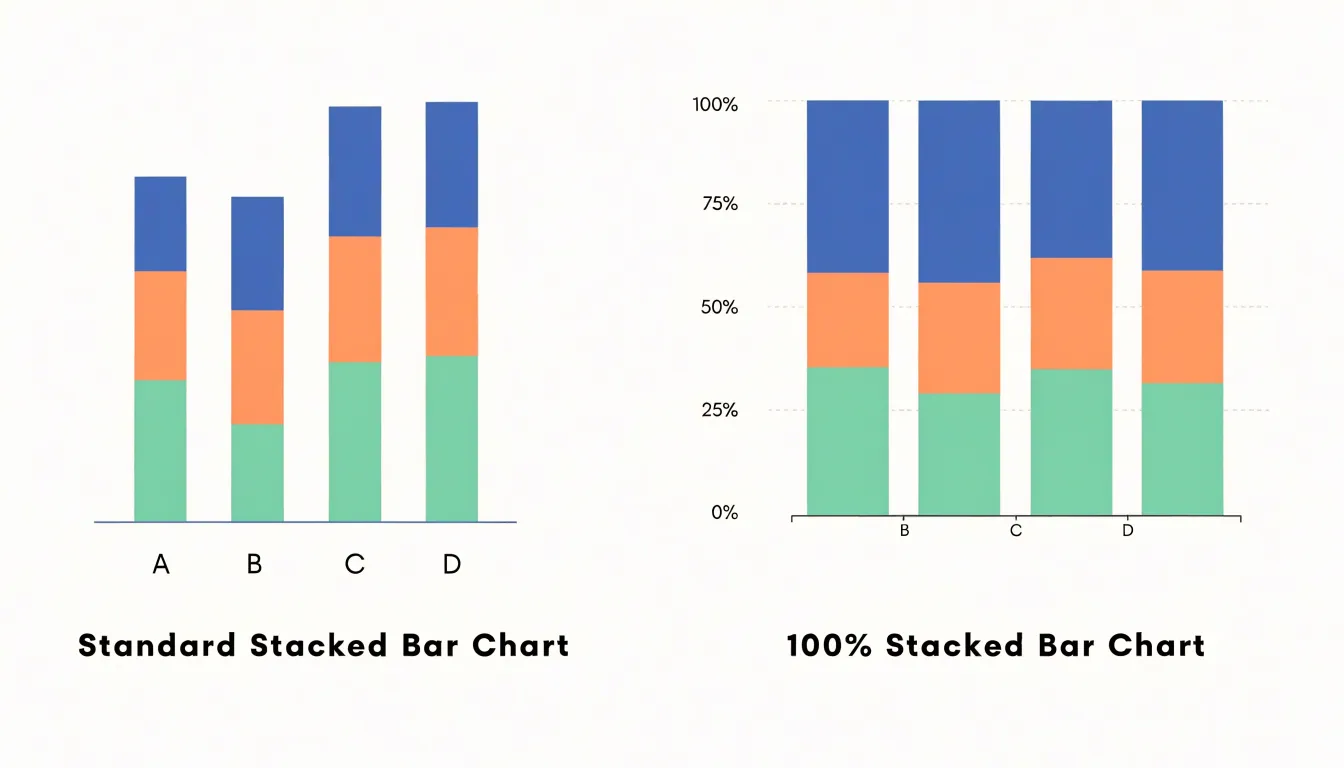
This emphasis on relative proportion makes the percentage stacked chart particularly useful when the underlying totals vary widely and the question of interest concerns composition rather than volume. Analysts tracking market share across competitors of different sizes, for example, can display each company as a bar and each brand as a segment, revealing how the mix of offerings differs even when revenues are wildly unequal. Similarly, demographic breakdowns across regions, budget allocations across departments, and response distributions across survey waves all benefit from the 100% scale, because the chart foregrounds the balance among parts.
The normalization also introduces trade-offs worth noting. Because all bars reach the same top edge, the chart hides absolute magnitude, so a reader cannot tell from the visual alone whether a segment represents millions or dozens. Segment comparisons across bars become harder when the segments occupy narrow slices, and the position of interior segments shifts depending on the stacking order. Designers often address these limitations with direct percentage labels, consistent color assignments, and thoughtful ordering that places the largest or most stable category at the base. Used with these supports, the percentage stacked chart offers a compact and readable way to show how wholes divide into their constituent parts.
Business Sales Tracking
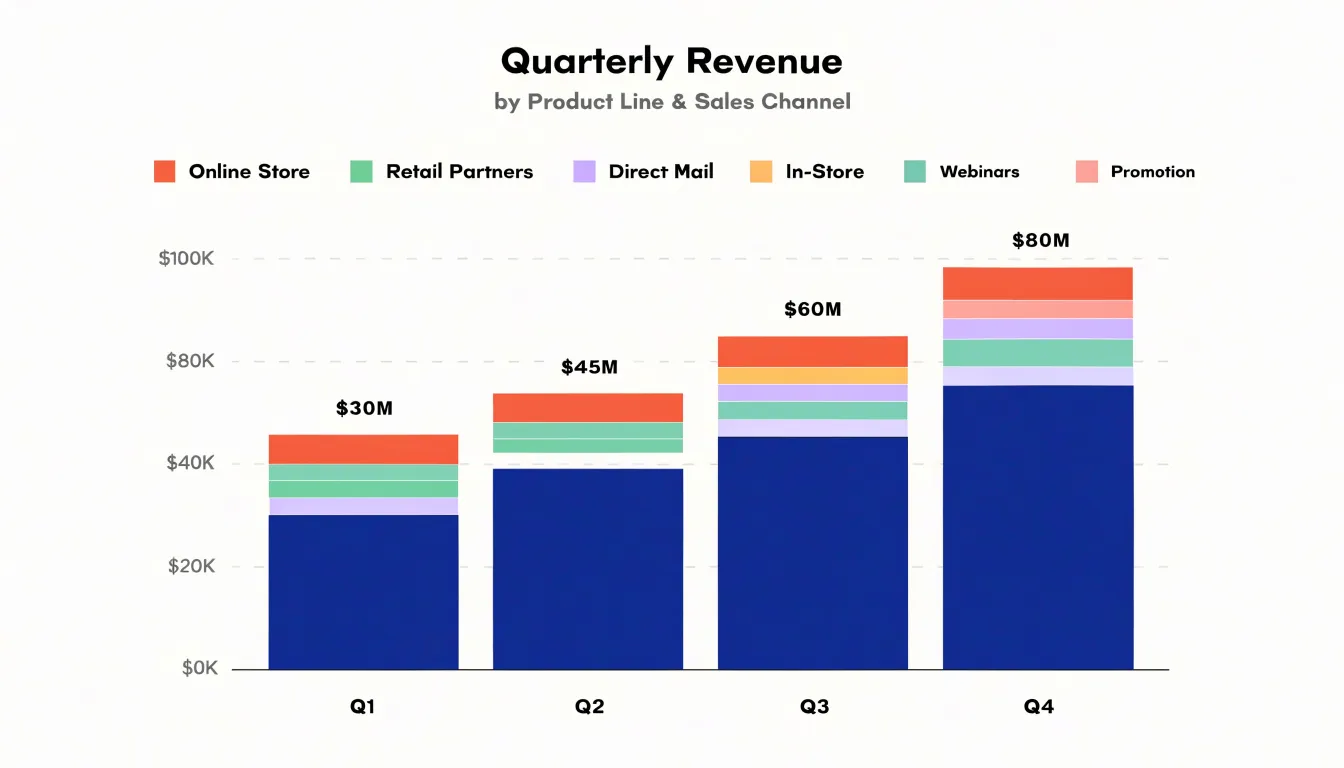
Quarterly revenue tracking across multiple product lines gives a business a clear view of how each category contributes to overall performance. A stacked bar chart suits this task because each bar represents a quarter’s total revenue, while the individual segments within the bar show how much each product category contributes. Viewing several quarters side by side reveals trends that a simple total would hide. A category with steady segment growth may be quietly becoming a primary revenue driver, while another that looks healthy in isolation may be losing share within a rising total.
The stacked structure also makes channel comparisons straightforward. When each segment corresponds to a product line or sales channel, decision-makers can compare the relative height of segments across quarters and spot which channels are expanding or contracting. A segment that widens from one quarter to the next signals growing customer demand, and a narrowing segment points to a channel that may need attention, whether through pricing changes, marketing investment, or inventory adjustments. Grouping segments by category color or position keeps the chart readable as the number of product lines grows.
Beyond channel performance, the chart captures shifting customer preferences. If a segment for a newer product line steadily occupies more of each bar, the business can infer that customers are migrating toward that offering. These visual signals support practical decisions such as reallocating budget toward high-performing categories, planning production capacity around growing segments, or retiring products that consistently shrink.
Tracking quarterly through the year adds a seasonal dimension, since stacked bars make it easy to compare the same quarter across years and separate genuine growth from recurring seasonal peaks. When the chart is annotated with totals above each bar, revenue magnitude and category mix can be read together, giving teams a single reference for both overall sales performance and the composition behind it.
Survey Result Analysis
Survey results often arrive as a complex web of responses gathered from multiple demographic groups, and a stacked bar chart provides a clear way to bring that structure into view. Each bar can represent a single demographic category, such as an age bracket, income tier, or regional segment, while the segments within the bar correspond to the response options on a Likert scale. This arrangement lets readers see the full distribution of answers for every group side by side, so the proportion of respondents who strongly agree, agree, are neutral, disagree, or strongly disagree remains visible within each bar rather than being reduced to a single average score. When the segments are ordered consistently from one bar to the next, patterns in satisfaction or agreement levels begin to emerge naturally. A demographic group whose bar carries a wide band of positive responses stands out clearly against one where neutral or negative segments dominate. Analysts can compare the relative weight of favorable responses across groups at a glance and identify which segments report higher satisfaction or stronger agreement. The same structure supports spotting trends over ordered categories, such as age bands or tenure levels, where a gradual shift in segment proportions from one bar to the next signals a directional trend in opinion. Stacked bars also make it easy to include group totals, since the overall height of each bar can reflect the number of respondents in that group, giving context to the proportions shown inside. With consistent color coding and a clear legend, the chart communicates a large volume of survey data in a compact, readable form, helping stakeholders locate the demographic differences that matter most for interpreting satisfaction and agreement across the respondent base.
Budget and Expense Breakdown
A stacked bar chart provides a clear and effective way to visualize how each department’s operational expenditures contribute to the overall corporate budget. By stacking individual expense categories—such as salaries, supplies, travel, and utilities—for each department, the chart shows both the composition of spending within a department and the total spent by that department. When a horizontal line or marker indicates the total corporate budget limit, viewers can immediately see which departments are approaching or exceeding their allocated funds. This visual comparison supports financial oversight by highlighting areas of overspending or underutilization at a glance.
The stacked format is particularly useful for tracking spending across multiple periods. For example, monthly stacked bars for each department allow finance teams to monitor trends and identify seasonal fluctuations in operational costs. The cumulative height of each bar represents the department’s total expenditure for that month, while the segments reveal which cost categories are driving changes. This granularity helps managers make informed decisions about reallocating resources or implementing cost-saving measures.
In addition to internal departmental comparisons, the chart can incorporate the total corporate budget as a reference. By aggregating all departmental spending into a single stacked bar or by adding a separate bar for the overall budget, stakeholders can assess whether the organization as a whole is on track. The visual nature of the chart makes it easy to communicate financial status to non-financial audiences, such as board members or department heads, fostering transparency and accountability.
Overall, the stacked bar chart serves as a powerful tool for budget and expense breakdown, enabling organizations to maintain financial discipline while providing insights into spending patterns across departments.
Website Traffic Monitoring
Monitoring website traffic by source over time gives teams a clear view of how different acquisition channels contribute to overall visitor volume. A stacked bar chart is well suited to this task because each monthly bar represents total traffic while its segments show the relative share of organic, direct, referral, and paid visitors. Placing consecutive months side by side reveals trends that a single snapshot cannot capture, such as a gradual rise in organic search or a sudden spike in referral traffic after a partnership announcement.
When marketing campaigns launch, the paid segment typically expands, and the chart makes that change immediately visible against the baseline of other sources. Teams can compare the size of the paid segment before, during, and after a campaign to judge how much additional traffic the spend generated and whether those visitors arrived alongside growth in other channels. Direct traffic often reflects brand awareness, so an increase following a campaign can suggest that audiences are seeking the site out by name. Referral traffic shows which external sites and publications are sending visitors, and shifts in this segment can point to new coverage or the loss of a valuable link.
The stacked format also supports proportional analysis. Comparing the height of each segment against the full bar shows how the channel mix evolves, which helps when the goal is diversification rather than raw volume growth. A month where paid traffic dominates may indicate heavy reliance on advertising, while a month with a larger organic share suggests stronger earned visibility.
Practical implementation involves consistent color coding across months, a clear legend, tooltips or labels for exact values, and a time axis that makes seasonal patterns easy to spot. Annotating campaign launch dates directly on the chart connects marketing activity to observed traffic changes and turns the visualization into an ongoing record of channel performance.
Comparing Two Chart Types
Choosing between stacked and grouped bar charts depends on the question your visualization needs to answer. Stacked bars excel when the primary goal is to show the total across categories and how each segment contributes to that whole. For example, if you want to display total monthly sales by region and see the share each product line contributes, a stacked bar chart makes the overall height immediately visible while the segments reveal composition. This works well when the number of segments is small (typically no more than five) and when the emphasis is on the aggregate rather than on precise comparisons between individual segments. However, stacked bars can make it difficult to compare segments across different bars, especially when segments are not aligned at a common baseline. The middle segments in particular become hard to compare accurately because their starting points vary.
Grouped bars, in contrast, place each segment side by side within each category, giving every segment its own baseline. This layout is ideal when the main task is to compare segment values across categories—for instance, comparing the sales of each product line across regions. Grouped bars allow for precise segment-to-segment comparisons because each bar starts from zero, making differences in height easy to judge. The trade-off is that grouped bars do not directly show the total for each category; viewers must mentally sum the bars if they need the overall total.
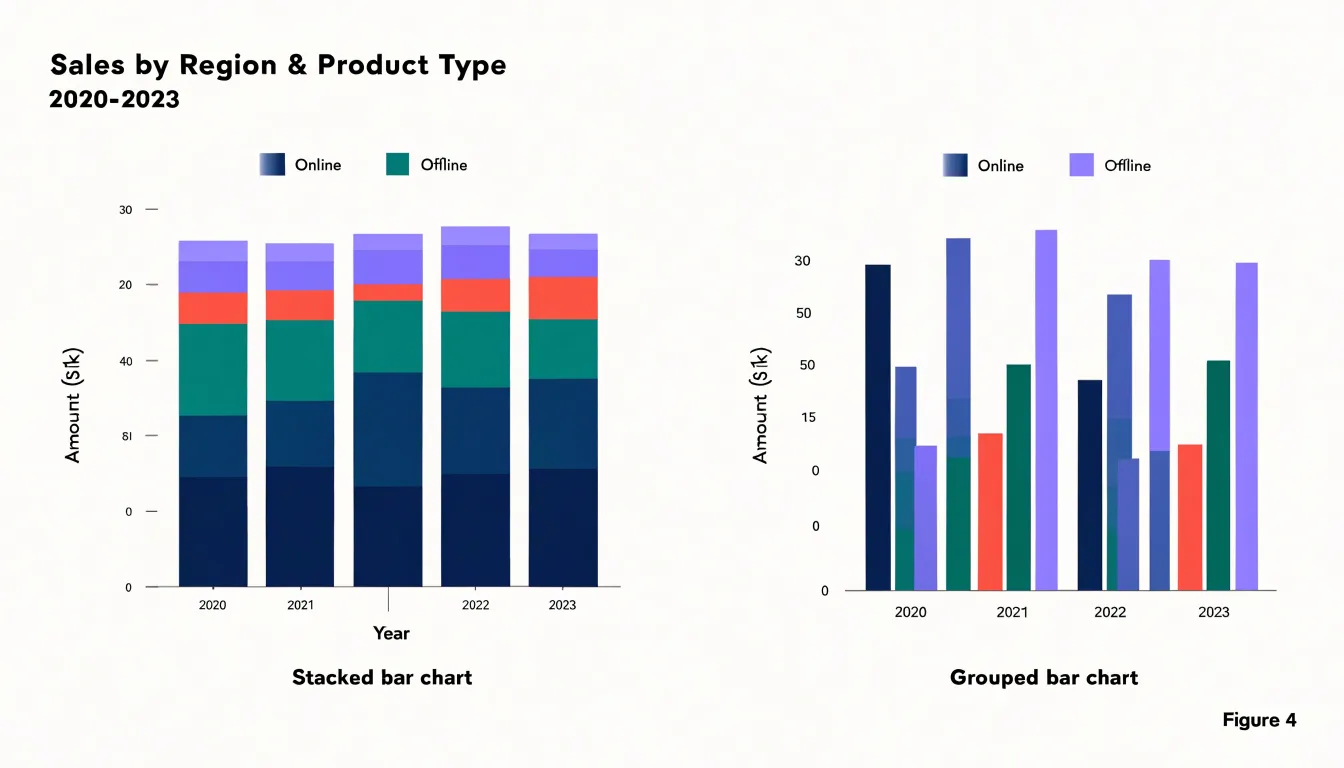
When deciding between the two, consider the number of segments and the importance of totals versus individual comparisons. If the message is about the whole and its parts, and the segments are few, stacked bars are effective. If the message is about comparing specific segments across categories, grouped bars are more suitable. In practice, the choice should align with the analytical task: use stacked bars to highlight composition and totals, and grouped bars to facilitate precise comparisons between segments.
Interactive Chart Features
Interactive features transform a stacked bar chart from a static image into an exploratory instrument. Tooltips form the first layer of this engagement. When a viewer hovers over a segment, a tooltip should surface the category name, the segment value, its share of the bar total, and, where relevant, the absolute and percentage change from a comparison period. Good tooltip design keeps this information compact, positions the panel so it never obscures the hovered segment, and responds within a few milliseconds so the interaction feels immediate. Highlighting the hovered segment while dimming the rest of the chart reinforces the connection between cursor position and data point.
Dynamic legends extend this logic to the whole dataset. Instead of a fixed key, the legend becomes a control panel: clicking a series toggles its visibility, hovering a legend entry emphasizes the matching segments across every bar, and the legend can reorder itself to reflect current totals. This lets viewers reduce visual clutter when a chart carries many series, focusing attention on the categories that matter to their question.
Segment isolation controls push the idea further by letting users drill into a single category. A click on one segment can expand that bar into its own detailed view, filter the remaining chart to matching records, or trigger a coordinated update in linked charts on the same dashboard. Combined with brushing and cross-filtering, isolation controls support a natural analytical flow: overview first, then zoom and filter, then details on demand.
Together, hover states, dynamic legends, and isolation controls shorten the distance between a question and an answer. They reward curiosity with instant feedback, encourage exploration without requiring technical skill, and keep the chart legible as complexity grows. The result is a visualization that invites users to dig deeper rather than simply read a summary.
Choosing the Right Software
Selecting software for stacked bar charts begins with an honest assessment of your data skills, publishing workflow, and the level of customization the chart demands. Spreadsheet tools remain the most accessible entry point. Excel and Google Sheets offer built-in stacked column and bar types, quick formatting through the chart design ribbon, and straightforward links to existing worksheets. They suit routine reporting, internal dashboards, and situations where a colleague must update figures without touching code. Their limits appear with large datasets, complex labeling, or repeated production, where manual formatting becomes tedious.
Business intelligence platforms such as Tableau and Power BI occupy the next tier. Both handle stacked bars natively, connect to live data sources, and support interactive filtering that lets viewers isolate segments. Tableau’s drag-and-drop shelf model makes it easy to test alternative stackings, while Power BI integrates tightly with Microsoft ecosystems. These tools reward teams that need recurring, shared dashboards and are comfortable with licensing costs and a learning curve.
For analysts who write code, Python libraries like Matplotlib and Seaborn provide precise control over stacking order, colors, annotations, and export formats. A few lines of pandas can aggregate categories, and Matplotlib renders publication-quality output suitable for papers or automated reports. Plotly adds interactivity and hover details for web embedding. The tradeoff is setup time and the need to maintain scripts. R users find comparable capability in ggplot2, whose grammar of graphics handles grouped and stacked bars elegantly.
Matching the tool to the task matters more than chasing trends. A one-off summary may need only Excel; a live dashboard calls for Tableau or Power BI; a reproducible pipeline favors Python or R. Consider team skills, budget, data volume, and how often the chart will be regenerated before committing.
Quick Design Checklist
A quick design checklist helps you turn a stacked bar chart from a rough draft into a clear and accurate visual. Start with color selection. Choose a palette that separates segments reliably, favoring hues that differ in both lightness and saturation so that adjacent categories remain distinguishable. Limit the palette to a manageable number of colors, and reuse the same color for the same category across every chart in a report. Check that the palette holds up for viewers with color vision deficiencies, and add texture or direct labels where two segments sit close in tone. Next, address sorting order. Order segments within each bar so that the largest or most important category sits at the baseline, giving readers a stable reference point. Keep that order consistent across every bar in the chart, and arrange the bars themselves in a sequence that supports comparison, such as by total size or by a meaningful category order. Clear labeling comes next. Label each segment where space allows, or provide a legend tied directly to the colors and place it near the chart. Include the value and the total for each bar, give the axes descriptive titles with units, and state the time period or scope explicitly. Finally, guard against cognitive overload. Limit the number of segments per bar to a handful, group minor categories into an Other category, and remove gridlines, borders, and decorative elements that do not help the reader compare values. Use a single consistent scale, avoid three-dimensional effects, and leave generous whitespace around the chart. Run through this checklist before publishing, and the chart will communicate its data quickly and accurately.
Frequently Asked Questions
What is a stacked bar chart used for?
A stacked bar chart uses one bar per category, with the total height showing the aggregate figure and the colored segments showing how that total divides into parts. It is useful for part-to-whole comparisons in a compact dashboard visual.
What is the difference between a standard stacked bar chart and a percentage stacked bar chart?
A standard stacked chart uses absolute values, so the full bar height represents the total and each segment is sized by its absolute contribution. A percentage stacked chart rescales every bar so its components sum to 100%, emphasizing proportion and hiding absolute magnitude.
When should I use a stacked bar chart instead of a grouped bar chart?
Use a stacked bar chart when the goal is to show the total across categories and how each segment contributes to that whole, especially when there are few segments. Use grouped bars when the main task is comparing segment values across categories.
How can a stacked bar chart help with quarterly sales tracking?
Each bar can represent a quarter’s total revenue while the segments show how much each product category contributes. Viewing several quarters side by side can reveal segment growth, channel changes, and shifting customer preferences.
How are stacked bar charts used in survey result analysis?
Each bar can represent a demographic category, and the segments correspond to response options on a Likert scale. This lets readers see the distribution of answers for each group side by side rather than relying on a single average score.
What should I keep in mind when designing a stacked bar chart?
Choose a palette that separates segments reliably and reuse the same color for the same category across charts. Put the largest or most important category at the baseline, keep segment order consistent, and label segments or use a nearby legend. Limit the number of segments per bar, group minor categories into an Other category, and remove nonessential gridlines, borders, and decoration.
Tony Astor
Tony writes about data visualization and the tools people use to build charts and dashboards. More about Data Illustrator