Stacked Area Chart: Uses, Examples and Limitations
 By Tony Astor ·

Stacked Area Chart
A stacked area chart plots multiple data series as filled bands stacked on top of one another, so the combined height at any point shows the total while each band’s thickness shows its individual contribution. It suits part-to-whole trends over time, best limited to about five series, with the most stable series placed at the bottom for a readable baseline.
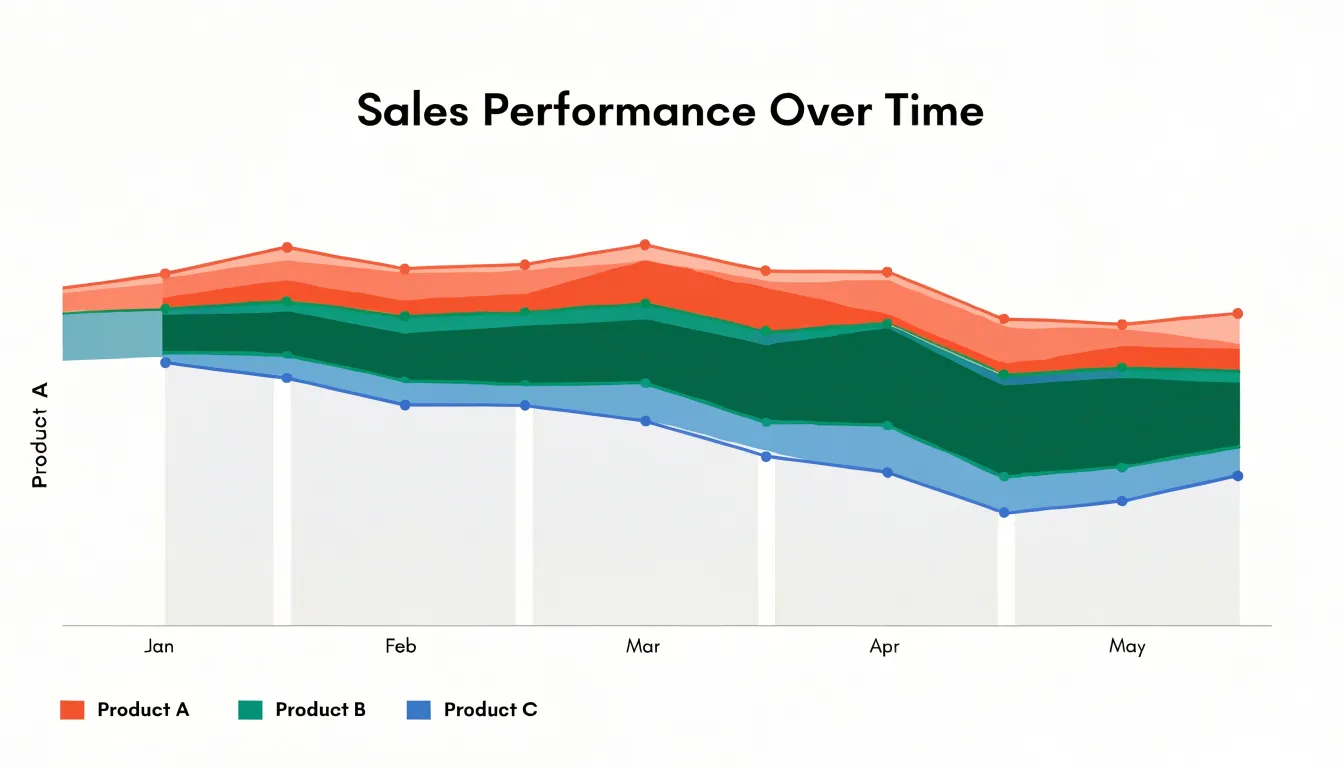
Table of Contents
- Stacked Area Chart
- Stacked Area Chart
- Stacked Area Chart
- Stacked Area Chart
- Stacked Area Chart vs. Line Graph
- Stacked Area Chart vs. Bar Graph
- Stacked Area Chart
- Stacked Area Chart
- Stacked Area Chart
- Stacked Area Chart
- Stacked Area Chart
- Stacked Area Chart
- Stacked Area Chart
- Stacked Area Chart
- Stacked Area Chart
- Stacked Area Chart
Stacked Area Chart
A stacked area chart plots several data series on top of one another so that the combined height of the bands at any point on the horizontal axis represents the total for that moment. Each series occupies its own colored layer, with the bottom layer anchored to the baseline and every subsequent layer resting on the one beneath it. This arrangement makes the chart a dual-purpose instrument: the overall silhouette of the stack communicates the cumulative total, while the internal boundaries trace the contribution of each subgroup across the timeline.
The horizontal axis typically carries time, such as months, quarters, or years, which lets readers follow how the total and its components evolve together. When the top edge of the stack rises, the aggregate is growing. When a particular band widens, that subgroup is gaining share or volume within the whole. Readers can therefore answer two questions in a single glance: how large is the total, and which parts are driving it.
Reading individual values requires attention, since only the lowest series sits directly against a constant baseline. The magnitude of an upper series is the vertical distance between its own top and bottom boundaries, and that distance shifts position as the layers below change. For this reason, stacked area charts work best when the emphasis falls on the overall total and the relative composition rather than on precise readings of any single band. Designers often add a light grid, a clear legend, and consistent color ordering to help viewers track each layer as the stack rises and falls over time.
Stacked Area Chart
Each dataset is plotted as an area, and instead of starting from the baseline independently, every successive layer rests on the accumulated height of the layers beneath it. The first series sits directly on the x-axis. The second series is drawn on top of the first, so its vertical position at any given x-value equals the first series’ value plus its own. The third rests on the sum of the first two, and this sequential accumulation continues through the final layer. The topmost edge of the chart therefore traces the total across all categories, giving the overall trend a single continuous silhouette across the horizontal axis.
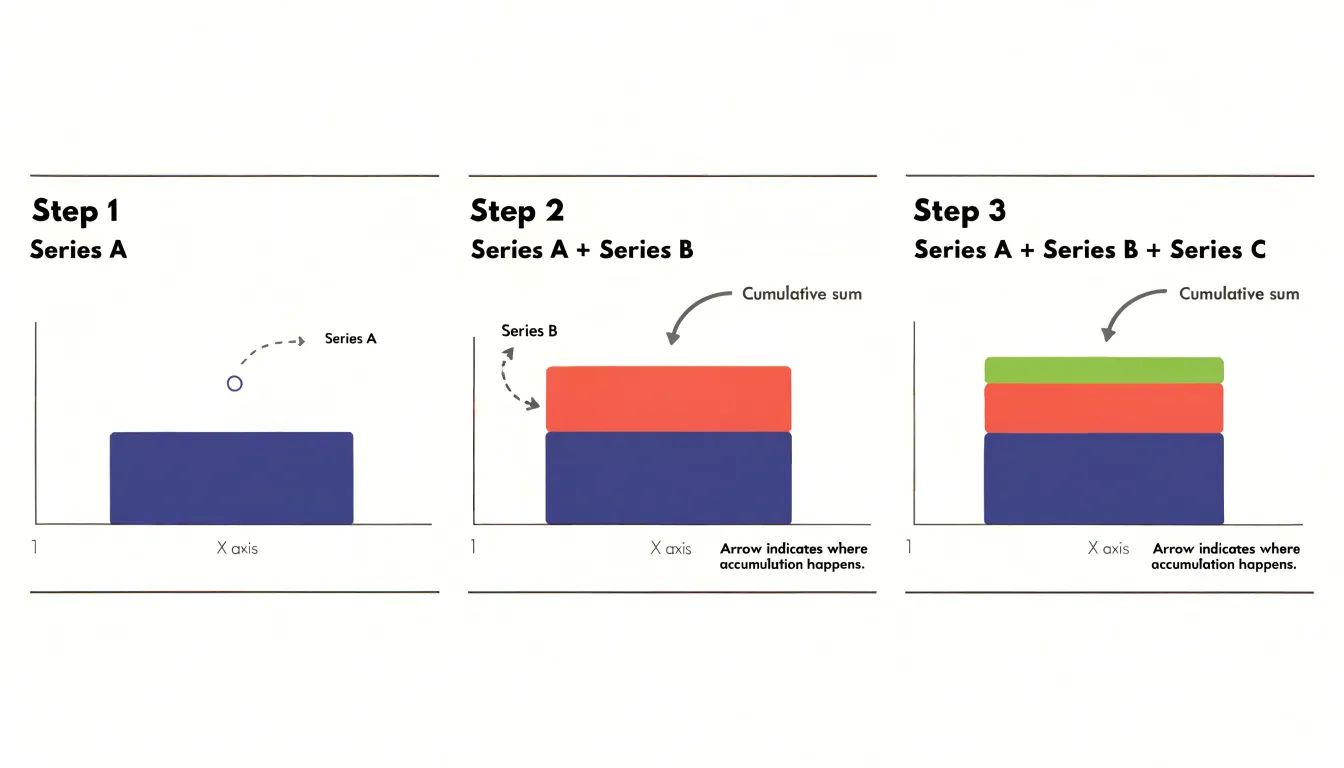
Because each layer inherits the elevation of everything below it, an upward slope near the top of the chart reflects expansion across the whole composition, while the individual bands retain their own contour. A widening band reveals that one constituent is gaining share of the total; a narrowing band shows a component holding steady or losing ground relative to the rest. The thickness of each ribbon, measured between its upper and lower boundary, encodes that series’ own value at every point.
The ordering of layers matters to the reading experience. The series placed at the base is easiest to compare against the axis, while layers near the summit are read mostly through their thickness rather than their absolute position. Designers often place the largest or most stable series at the bottom to give the chart a firm foundation, letting smaller or more volatile categories ride higher up.
Stacked Area Chart
Reading a stacked area chart begins with the two axes. The horizontal x-axis typically represents a continuous dimension such as time, and its tick marks and labels show the intervals at which values are recorded. Check whether those intervals are evenly spaced or irregular, because uneven spacing can make growth or decline look faster or slower than it really is. The vertical y-axis represents the accumulated total of all series at each x-position. Pay attention to whether the y-axis starts at zero, since truncated axes can exaggerate differences between bands.
Color carries the identity of each series, with each shaded band assigned a distinct hue or shade. Because only the bottom series shares a boundary with the zero line, when comparing upper series, look at how band thickness changes along the chart rather than the absolute vertical position of a band’s edges.
The legend links colors to category names and provides the key for identifying each series. Place it close to the chart and order entries to match the stacking order, from bottom to top, so readers can follow the bands without hunting. Interactive legends that allow toggling individual series help readers isolate a single category when the chart becomes crowded. With many series, group minor categories into an ‘other’ band and use a neutral color, reserving distinct hues for the series that matter most. Keep color palettes limited and colorblind-friendly so that every reader can distinguish the bands reliably.
Stacked Area Chart
When several continuous time-series run in parallel, a stacked area chart lets a reader follow both the individual contributions and the aggregate trend at the same moment. This is valuable when the streams are related parts of one larger system, such as product lines within a company’s revenue or energy sources feeding a regional grid.
Clarity depends on a few practical strategies:
- Order the bands deliberately, placing the most stable or least volatile series at the bottom so the baseline stays calm and the remaining bands are easier to compare.
- Keep the number of visible streams modest; beyond five or six, thin bands become hard to distinguish, and grouping small categories into an ‘other’ band preserves readability.
- Choose a sequential palette that reinforces the stacking order, so adjacent bands remain visually distinct even for readers with color vision deficiencies.
- Limit annotation to the events that matter, since labels crowded across a moving timeline quickly overwhelm the plot.
Interactivity adds another layer of control. Tooltips that reveal exact values at a hovered position, toggles that isolate or hide individual streams, and a consistent y-axis scale all help viewers move between the overview and the detail they need. When precise comparison between middle bands matters more than the total, consider pairing the chart with a small multiple or line view.
Stacked Area Chart vs. Line Graph
A stacked area chart excels when you want to communicate both the total magnitude of a combined quantity and the relative contribution of each component over time. Because the areas are filled and layered, the eye naturally reads the cumulative height as the whole, making it well suited for part-to-whole trend analysis, such as tracking total revenue broken down by product line, or energy consumption split by source across several years.
An overlapping line graph, by contrast, places each series on the same baseline without cumulative stacking. This design makes it easier to compare the absolute values of individual series directly, since every line is measured against the same axis starting point. If your priority is understanding which category is growing fastest or where two series cross and diverge, plain lines often read more clearly. Stacked areas can obscure such comparisons because the upper bands float on the accumulated layers beneath them, shifting position whenever lower components change.
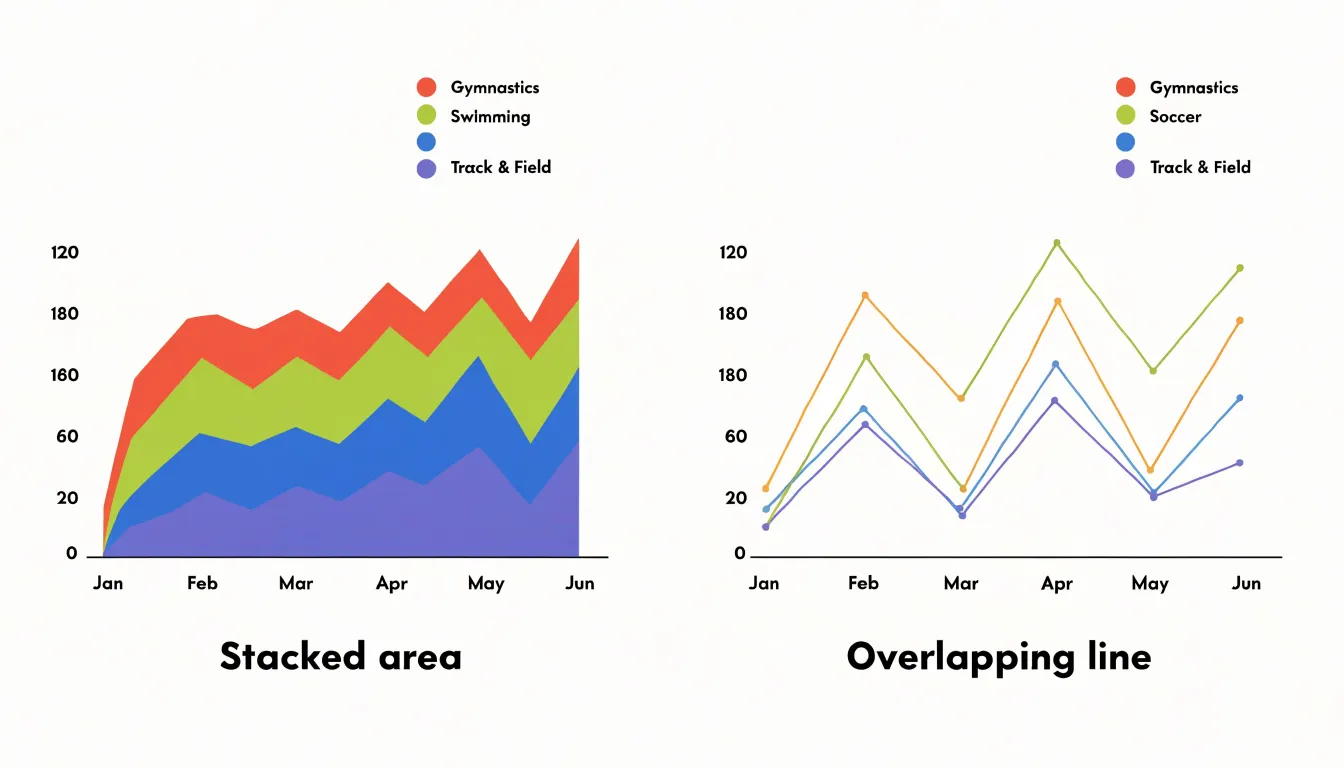
The number of categories also matters. Stacked areas work best with a small handful of components, typically three to five. Line graphs can accommodate more series, though readability still declines as lines multiply. Finally, consider whether cumulative totals are meaningful in your context. When the sum itself is a quantity worth tracking, stacking reinforces that message. When the total is incidental and only the individual trends matter, lines provide a cleaner view of each series on its own terms.
Stacked Area Chart vs. Bar Graph
Stacked bar graphs and stacked area charts both display part-to-whole relationships across categories, yet they communicate different things about the underlying data. In a stacked bar graph, each category occupies a discrete column, and the gaps between bars signal that the categories are separate and independent. This works well for comparisons across a small number of distinct groups, such as quarterly sales by region or survey responses by age bracket. The bar format emphasizes the size of each individual segment and invites precise reading of heights against an axis.
A stacked area chart connects the top boundary of each stacked segment across a continuous x-axis. Because the segments flow into one another without gaps, the chart treats the categories as parts of an ongoing process rather than isolated snapshots. This continuity matters when the question involves trends, accumulation, or the rhythm of change over a period. That dual reading of overall magnitude and internal proportion is difficult to achieve with separate bars.
The area format also conveys volume more directly. Filled bands occupy space in a way that reads as mass or quantity, which suits data such as cumulative users, energy consumption by source, or revenue streams over months. When the exact value of a middle segment matters less than its relative weight within a flowing whole, the area chart provides the better context. Bars remain superior when categories are unordered or when precise segment-level comparison is the priority.
Stacked Area Chart
A stacked area chart offers a clear way to track how revenue streams evolve across product lines over successive fiscal quarters. Imagine a company with three main product categories: hardware, software, and services. Each quarter, the total revenue is the sum of these three streams, and the chart stacks them vertically so the overall height of the shaded band represents total company revenue. The bottom layer typically belongs to the most established stream, such as hardware, while newer or faster-growing streams like software and services sit above it.
If hardware revenue stays relatively flat but software revenue expands quarter after quarter, the software band visibly thickens, gradually taking up a larger share of the total area. A business analyst can trace such shifts without needing to mentally add separate line charts together. The chart also highlights seasonal patterns, since fiscal quarters often bring predictable spikes or dips within particular categories. When one stream declines while another grows, the stacked format keeps the overall revenue picture intact while revealing the underlying substitution. This makes the chart useful for executive reporting, where decision-makers can identify which product lines are driving growth and which are maturing or contracting, supporting more informed planning for the coming fiscal year.
Stacked Area Chart
A digital marketing team can use a stacked area chart to track how four major traffic sources—organic search, paid advertising, direct visits, and referrals—evolve across consecutive months. Each source occupies its own vertical band so the total height represents combined monthly website traffic, letting the team see both overall visitor volume and each channel’s proportion without switching between separate graphs.
For example, a marketer might observe that organic traffic grows steadily through the spring while paid traffic spikes during a promotional campaign in March, with the stacked bands making both movements visible in a single view. The chart also reveals shifts in channel mix: if the referral band widens noticeably in the fourth quarter, the team can quickly connect that growth to a partnership or content syndication effort.
Because the bands are ordered consistently, viewers can identify seasonal patterns, such as direct traffic climbing during holiday periods, or diagnose sudden drops in paid performance after a budget adjustment. Stakeholders can see whether total traffic growth is driven by a single channel or spread evenly across several, supporting clearer conversations about resource allocation, campaign effectiveness, and long-term channel strategy.
Stacked Area Chart
Energy providers rely on stacked area charts to track how different power sources contribute to the grid across the calendar year. In a typical visualization, the horizontal axis represents months from January through December, while the vertical axis shows total electricity generated in gigawatt-hours. Each power source occupies its own colored band: coal, natural gas, nuclear, hydroelectric, wind, and solar.
Seasonal patterns become immediately visible:
- Winter: Natural gas and coal bands widen as heating demand rises and solar output drops with shorter daylight hours.
- Spring: Hydroelectric bands often expand with snowmelt and increased rainfall, while wind generation shows its own distinctive peaks.
- Summer: The solar band thickens dramatically, particularly in regions with strong sun exposure, alongside spikes in gas-fired generation to meet air conditioning load.
- Autumn: The chart settles into a transitional profile as demand moderates and renewable contributions shift again.
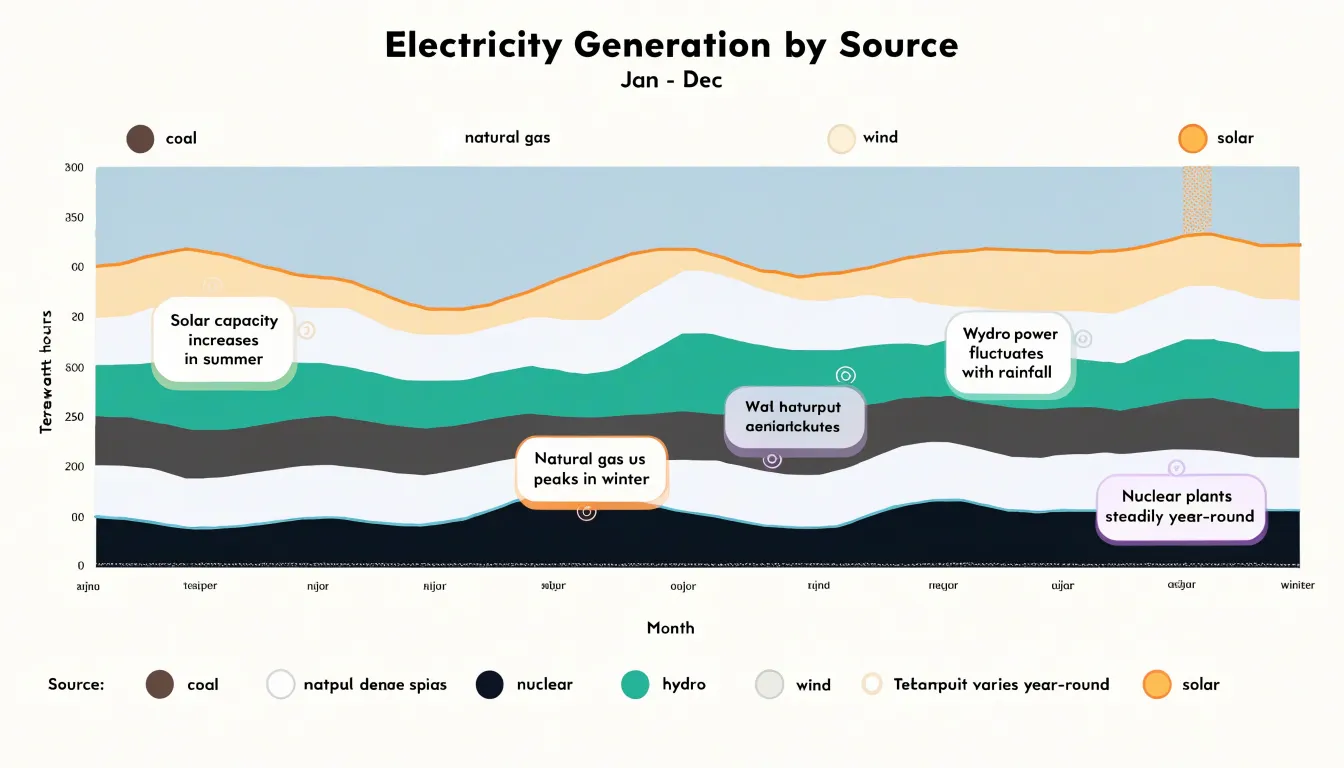
Placing intermittent renewables at the bottom of the stack anchors them to a stable baseline, making their seasonal expansion and contraction easy to compare against the more constant nuclear band. Analysts can trace how the renewable share grows during favorable months and shrinks during peak demand periods, revealing the grid’s reliance on dispatchable sources as a balancing mechanism. Overlaying multiple years on the same chart exposes longer-term trends, such as gradual solar growth or declining coal contributions, giving planners evidence for capacity decisions and infrastructure investment.
Stacked Area Chart
Because the bottom layer is the only one that rests directly on the x-axis, it has a constant, flat baseline. The vertical position of any point on the bottom layer directly represents its actual value, making trends in that layer immediately interpretable. Viewers can easily see rises and falls because the shape of the bottom layer is not distorted by other data; it is simply the raw series plotted against zero.
For upper layers, their vertical position is determined by the sum of all layers beneath them, which can fluctuate significantly. This creates a visual coupling: the apparent trend of an upper layer is a combination of its own variation and the variation of everything below it. Disentangling these effects requires mental subtraction, which increases cognitive load and makes it harder to discern the true pattern of the upper series.
Moreover, the bottom layer’s thickness—the vertical distance between its top and the x-axis—is always equal to its value. For upper layers, thickness represents the value only if you measure between the top of the layer and the top of the layer directly below it. This requires comparing two moving boundaries, which is more error-prone than reading a single boundary against a fixed baseline. The human eye is adept at judging positions relative to a stable reference, so the bottom layer benefits from this perceptual advantage.
Stacked Area Chart
The displacement of upper layers creates a subtle but serious distortion: the eye follows the top edge of a band, and that edge is a composite of the band’s own value plus all the layers below. A middle layer can appear to swell or taper purely because a neighboring layer beneath it grew or shrank, which makes the visual slope of that band a misleading indicator of its own trend. This effect is most pronounced in the middle of the stack, where a layer has substantial cumulative movement both below and above it.
To mitigate misinterpretation:
- Provide an alternative view, such as a small multiples layout or a separate line chart, that plots each series against a common flat baseline so individual trends can be read in isolation.
- Place the series whose trend matters most at the bottom where its baseline is stable.
- Use annotations and direct labeling of individual layers to help readers trace a single band’s trajectory.
- Include interactive toggling that highlights one layer while dimming the rest so viewers can inspect a middle series against its true shape.
- Keep the number of layers small, use clear color separation, and pair the chart with a summary of the underlying values to give readers a numerical anchor for judging change.
Stacked Area Chart
When deciding between a standard stacked area chart and a 100% stacked area chart, the primary consideration is whether the message concerns absolute magnitudes or relative proportions. A standard stacked area chart displays the actual values of each category, with the total height of the stack representing the sum across all categories at each point along the x-axis. This format is ideal when the total volume matters—for example, showing total revenue over time broken down by product line, where both the overall growth and the contribution of each product are important.
In contrast, a 100% stacked area chart normalizes each stack to 100%, so the vertical axis represents the percentage share of each category relative to the total. This variant is most effective when the focus is on composition and how the mix of categories evolves, regardless of changes in the total. For instance, if you want to highlight that the share of renewable energy in a country’s electricity mix has grown from 10% to 30% over a decade, a 100% stacked area chart makes that trend clear even if total electricity generation has also increased.
Use a standard stacked area chart when absolute differences and total magnitudes are central to the story. Use a 100% stacked area chart when the relative composition is the key insight and the total is either secondary or varies in a way that would obscure the proportional changes.
Stacked Area Chart
Every additional layer in a stacked area chart adds another boundary line, another fill color, and another chance for the eye to lose track of which band belongs to which series. Five to seven layers is usually the practical ceiling; beyond that, adjacent bands become too thin to read and the chart turns into a striped gradient. When the underlying data contains many small categories, aggregating them into a single catch-all band labeled “Other” preserves legibility. Place that aggregated band at the top or bottom of the stack so it does not interrupt the visual flow of the major series.
Gridlines deserve similar discipline. A stacked area chart already carries strong horizontal structure in its band boundaries, so dense gridlines compete with the data for attention and produce a busy crosshatched field. Reducing gridlines to a few light reference levels, or removing them entirely in favor of labeled axis ticks, lets the shapes of the bands carry the quantitative message. Thin, subtle strokes between bands define edges without heaviness, while annotations should mark only the events or inflection points that genuinely explain a change in the trend.
Stacked Area Chart
A palette that looks striking in a design tool can collapse into an indistinguishable smear once several translucent bands overlap, so start with hues that remain distinct for viewers with common forms of color vision deficiency. Avoid relying on red-green contrasts, which are the most frequent source of confusion, and instead lean on palettes built around blue, orange, purple, and yellow. Tools such as ColorBrewer and dedicated colorblind simulators let you preview a candidate palette under deuteranopia, protanopia, and tritanopia before committing to it.
Place the largest and least volatile series at the bottom of the stack. Conversely, a small, highly fluctuating series at the bottom forces every layer above it to shift up and down in sympathy, which makes the whole chart look busier and obscures the actual trends. Keep the ordering consistent across related charts so readers can compare figures without re-learning the legend each time.
Finally, add a subtle border or slight opacity adjustment to each band so adjacent layers remain separable where colors are similar, and label series directly in the chart where space permits to reduce the burden on the legend.
Stacked Area Chart
Several scenarios call for alternative chart types because stacked area charts can obscure patterns or mislead viewers:
- Negative values: The stacking logic assumes that areas accumulate from a baseline, and negative values disrupt this visual flow. A component with a negative value will appear to subtract from the total, making the area representation confusing when showing both positive and negative contributions. A line chart with separate lines for each series, or a diverging stacked bar chart, provides a clearer picture.
- Discrete categories: Stacked areas imply continuity over time. When categories are discrete, such as survey responses or product types, a bar chart or a pie chart is more appropriate because it allows direct comparison of category sizes without implying continuous change.
- Overlapping series: Stacked areas show cumulative totals rather than overlap. If the goal is to compare individual series magnitudes, especially when they cross or have similar values, a line chart with multiple lines is superior so each line can be traced independently.
Stacked Area Chart
To maximize the effectiveness of a stacked area chart, follow this checklist:
- Use stacking only when the part-to-whole relationship over time is the primary story; choose a line chart when individual series values matter more than their sum.
- Ensure the y-axis baseline starts at zero to avoid distorting proportions.
- Limit categories to five or fewer (or up to seven at most), grouping minor streams into an “Other” band.
- Order stacks meaningfully by magnitude or stability so the most important or stable series sits at the bottom.
- Use a consistent, colorblind-safe palette with distinct hues, and add direct labels or a legend placed close to the data.
- Keep scales identical when comparing multiple stacked area charts.
- Add interactive features like tooltips and series toggles to reveal exact values without cluttering the static view.
- Test the chart with a sample audience to ensure the message is immediately clear.
Frequently Asked Questions
What is a stacked area chart used for?
A stacked area chart plots several data series on top of one another so the combined height shows the total at each point, while the bands show each subgroup’s contribution over time. It is especially useful for part-to-whole trend analysis when both overall magnitude and relative composition matter.
How do you read the value of an upper series in a stacked area chart?
For an upper series, the value is the vertical distance or thickness between its own top and bottom boundaries, not its absolute vertical position. That distance shifts as the layers below change, so stacked area charts work best when the emphasis is on the total and relative composition rather than precise readings of any single band.
How many categories should a stacked area chart have?
Stacked area charts work best with a small handful of components, typically three to five, and five to seven layers is usually the practical ceiling. Beyond that, adjacent bands can become too thin to read, so small categories should be grouped into an “Other” band.
When should you use a stacked area chart instead of a line graph?
Use a stacked area chart when you want to communicate both the total magnitude of a combined quantity and each component’s relative contribution over time. A line graph is often clearer when you need to compare individual series’ absolute values directly or see where two series cross and diverge.
What is the difference between a standard and a 100% stacked area chart?
A standard stacked area chart displays actual values, with the total height representing the sum across categories at each x-axis point. A 100% stacked area chart normalizes each stack to 100%, so the vertical axis represents each category’s percentage share of the total.
Can you use a stacked area chart with negative values?
No—negative values disrupt the stacking logic, because a component with a negative value appears to subtract from the total and makes the area representation confusing. A line chart with separate lines for each series, or a diverging stacked bar chart, provides a clearer picture.
Tony Astor
Tony writes about data visualization and the tools people use to build charts and dashboards. More about Data Illustrator