Sparkline vs Line Chart: When to Go Small
 By Tony Astor ·

Sparkline vs Line Chart
A sparkline is a compact, word-sized chart without axes, labels, or gridlines that shows only the shape and direction of a data trend, while a line chart includes labeled axes, gridlines, and markers to support precise, detailed analysis. Sparklines suit dashboards and tables for fast scanning; line charts suit exact value reading.
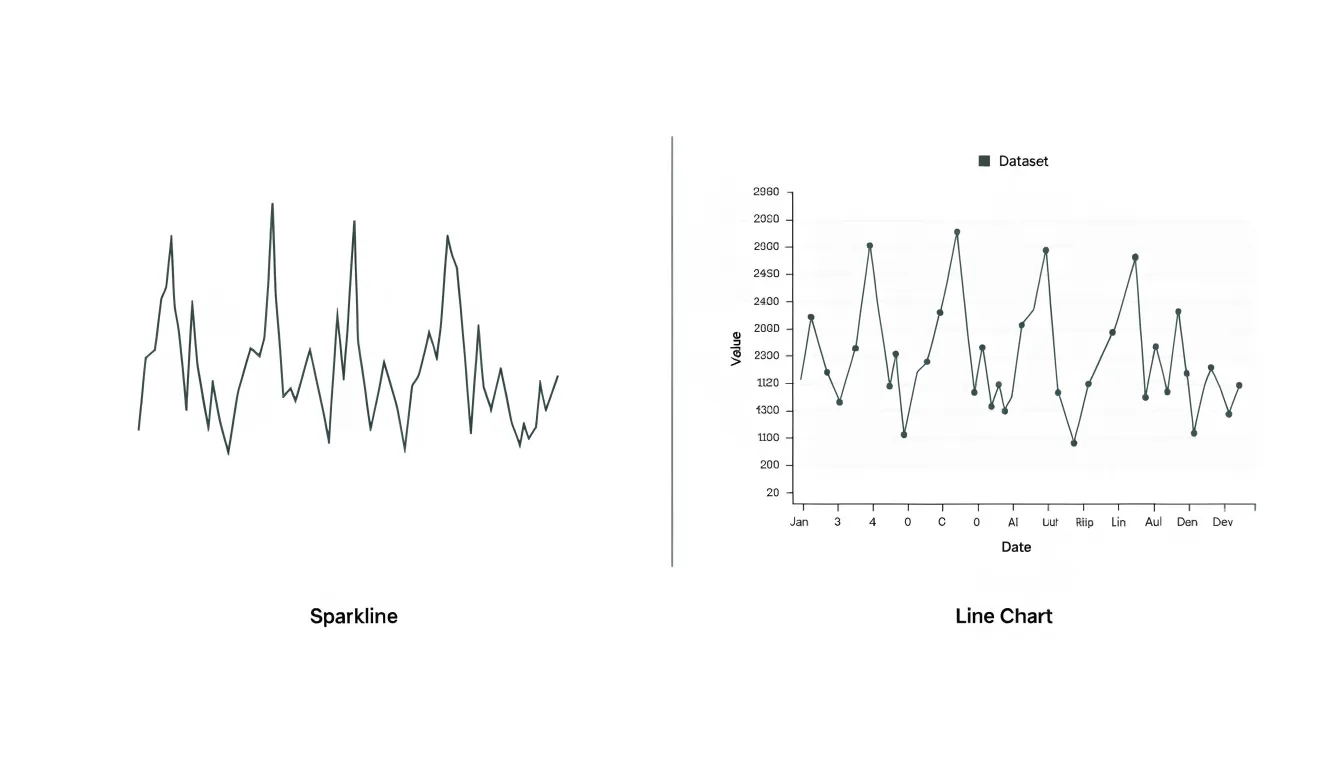
Table of Contents
Sparkline
Sparklines are compact, word-sized graphics that display a series of data points as a simple line or bar, designed to sit directly within text, tables, or dashboard cells. Their defining characteristic is the deliberate removal of standard chart elements: there are no axes, gridlines, labels, or legends. This stripping away of clutter allows the sparkline to communicate high-level directional movement in a space barely larger than a few characters. The viewer gains an immediate sense of whether values are rising, falling, fluctuating, or holding steady, without needing to read precise numbers or interpret a coordinate system. Because sparklines are embedded next to the data they describe, they eliminate the cognitive step of cross-referencing a separate chart, keeping context and trend side by side.
In tables, a column of sparklines can instantly reveal which rows are improving and which are declining, turning a dense grid of figures into a scannable overview. In dashboards, they work as compact trend indicators beside key metrics, offering a glanceable history that supports faster decision-making. The lack of axes means sparklines are not intended for precise value reading; their strength lies in pattern recognition and relative comparison. Designers often add a final data point marker or a shaded band to indicate thresholds, but the core visual stays minimal.
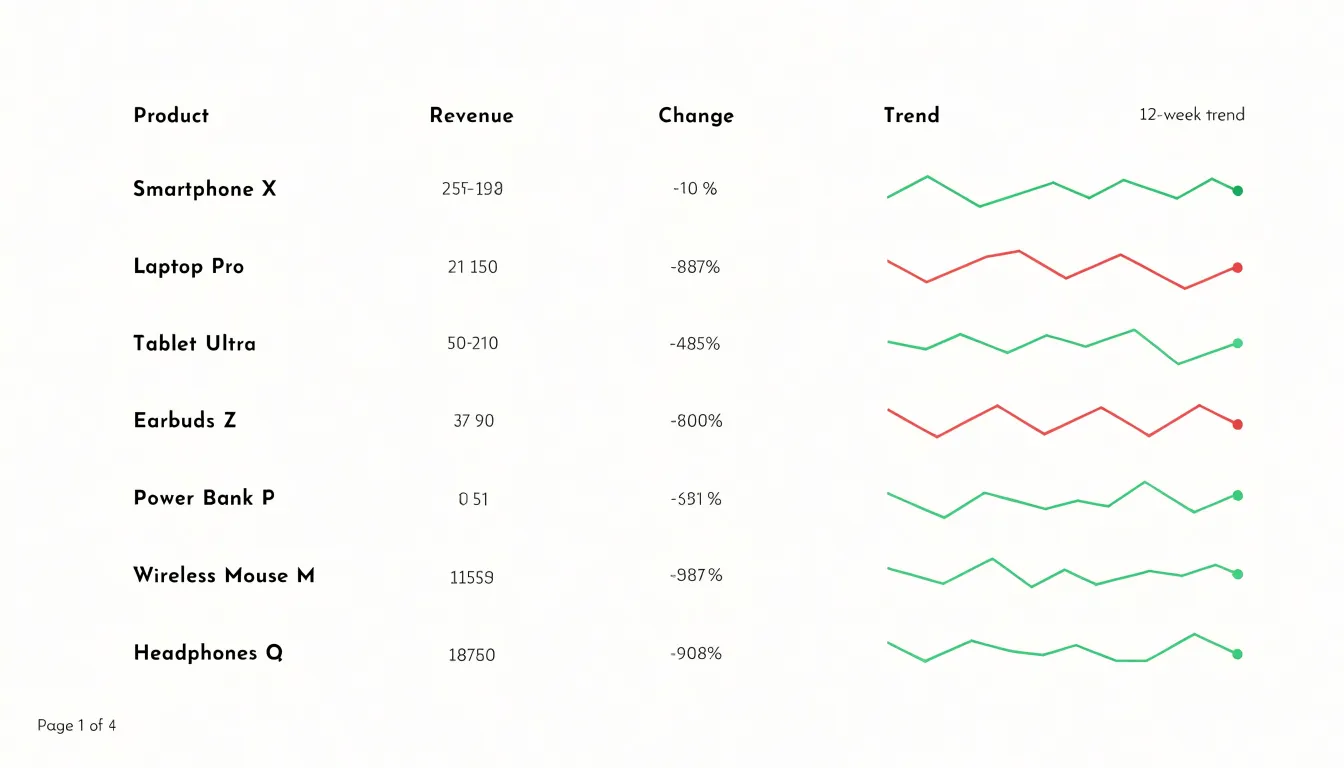
Sparklines suit tight spaces where a full line chart would overwhelm the layout or distract from primary content. They excel in reports, financial summaries, and performance monitoring, where the question is simply whether a metric is heading in the right direction.
Line Chart
Full-sized line charts are built around a structured visual framework that supports detailed trend analysis. At the foundation of every line chart sits a precise quantitative scale, typically anchored by a horizontal axis representing time or another ordered variable and a vertical axis representing measured values. These axes carry tick marks and numeric labels at regular intervals, allowing a reader to map any point on the plotted line back to an exact value. The presence of labeled axes turns the chart from a rough visual impression into a measurable instrument, where the distance between gridlines corresponds to a known unit and comparisons between data points can be made with confidence.
The line itself is drawn by connecting individual data points in sequence, and in full-sized charts those points are often marked explicitly so that each observation remains visible. Gridlines run across the plotting area to guide the eye horizontally and vertically, reducing the effort needed to estimate intermediate values. Legends identify multiple series when more than one line appears, and titles, subtitles, and axis captions supply the context required to interpret the data correctly.
This structural richness exists to support deep data exploration. A full-sized line chart gives the reader room to trace a series across many periods, spot inflection points, compare the slopes of different segments, and examine how values fluctuate around a baseline. Analysts can study seasonality, isolate anomalies, and compare several series side by side without losing precision. Because the chart occupies substantial space, labels remain legible and dense data sets can be plotted without cramping. The result is a graphic designed for sustained reading and investigation, where every element from the scale to the axis labels contributes to an accurate understanding of how values change over time.
Axes and Labels
While line charts include standard scales and labels by default, sparklines omit them to save space—a trade-off that can lead to misreading. Without knowing the scale, a reader might assume an upward trend represents a significant increase when the change is actually negligible.
When a sparkline includes explicit calibration—such as minimum and maximum values, or reference lines—readers can accurately gauge the magnitude of change alongside its direction. Conversely, removing all reference points simplifies the visual but strips away the context needed to judge significance. The decision to include minimal labels or reference lines on a sparkline should be deliberate, balancing the need for a compact footprint against the risk of ambiguity.
Dashboard Space
Executive dashboards often carry an enormous load. A single screen may need to accommodate revenue trends, customer acquisition figures, operational metrics, and financial summaries, all competing for the same limited canvas. Compact sparklines address this constraint by conveying the shape and direction of a data series within roughly the footprint of a single number.
The practical strategy begins with pairing each sparkline directly with its corresponding key performance indicator (KPI). When a revenue figure sits beside a small trend line covering the past twelve weeks, the viewer absorbs both the current value and its trajectory in a single glance, without needing to switch views or scan a separate chart panel.
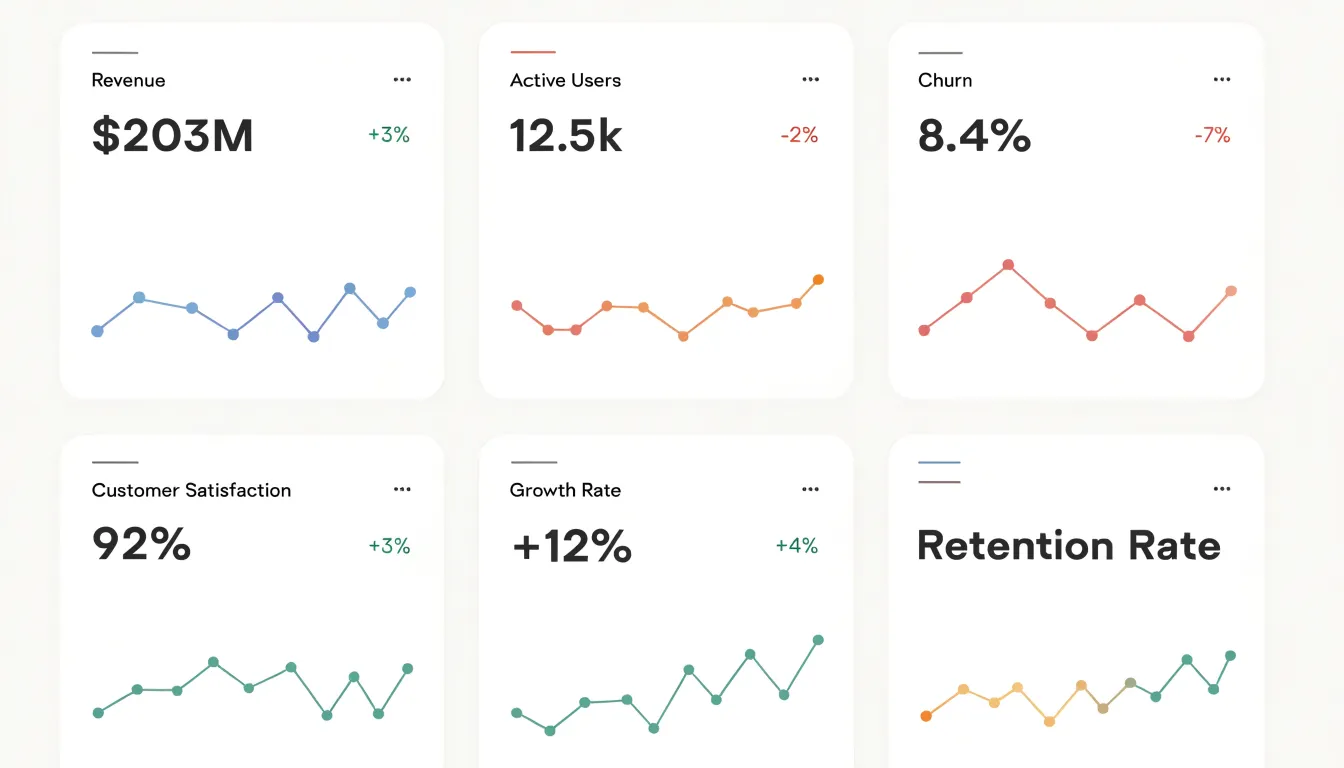
Laying out these pairings in a grid or column structure allows a dashboard to display a dozen or more distinct indicators without visual clutter. Each row becomes a self-contained unit of information: a label, a current value, a delta, and a trend line. Because sparklines omit axes and gridlines, they avoid the visual noise that full charts introduce, leaving the surrounding layout calm and legible even when densely populated.
Maintaining a consistent sparkline size across the dashboard creates a predictable rhythm that helps executives scan quickly. Reserving a fixed column width for the trend visuals means the eye can move down the page comparing shapes and directions without reorienting at each row. This discipline also makes dashboards easier to extend over time, since new metrics slot naturally into an established pattern.
Fast Scanning
Sparklines and line charts both rely on the human visual system’s capacity for rapid pattern recognition, but the speed of that recognition depends heavily on how much cognitive work the viewer must do. When a user scans a simplified visual signal like a sparkline, the eye and brain can process the overall shape almost instantly. This is because the visual cortex is tuned to detect changes in direction, slope, and abrupt deviations without needing conscious analysis. With only the essential contour of the data visible, fewer elements compete for attention, and the viewer can spot a spike, a drop, or an anomaly in a fraction of a second.
Line charts carry more contextual information—scales, tick marks, and multiple series—which supports precise reading but slows down the initial scan. Parsing and integrating these elements draws on working memory and delays the reflexive recognition of trends. In fast scanning scenarios, such as monitoring a dashboard with dozens of metrics, this delay compounds. Users need to identify which signals warrant closer inspection before they can afford to study any single chart in detail.
Simplified visual signals accelerate this triage by exploiting preattentive processing. The brain automatically detects salient features like sharp peaks or sudden valleys, allowing users to rapidly compare multiple sparklines side by side and flag the ones that deviate from expected patterns. This speed is not about dumbing down the data; it is about matching the visual encoding to the task of quick anomaly detection, freeing up attention for the deeper analysis that follows.
Detailed Analysis
When exact numbers and dates carry real weight, a full line chart becomes the appropriate instrument. Consider a context where analysts need to know the precise value recorded at a specific moment: a revenue figure on a particular closing date, a patient’s temperature reading at a given hour, or a server’s response time during a defined incident window. A line chart’s labeled axes let readers trace a data marker back to the exact figure and timestamp behind it, whereas an unlabeled sparkline leaves readers unable to resolve what a given peak actually represents.
Scenarios that demand exact figures include:
- Financial reporting, where a single closing price anchors a decision.
- Clinical monitoring, where a precise reading informs treatment.
- Performance tracking, where a specific latency measurement defines whether a threshold was breached.
- Granular metric comparisons, where analysis depends on individual observations and their position along the time axis rather than aggregate shape.
- Auditing and compliance, where records must show exactly when a value changed and what the value was before and after.
In each scenario, the reader’s task is to extract a specific figure or match a moment to a value. Summaries that compress the data into a shape lose the resolution required for these tasks. Detailed analysis therefore turns to the full line chart whenever the question being asked is what exactly happened at a specific point, rather than how the pattern looked overall.
Inline Charts
Inline charts work best when they sit directly beside the words they illustrate, so the reader absorbs the number and the shape in a single glance. The most common technique is the inline sparkline: a tiny, axis-free line drawn at roughly the x-height of the surrounding text and set on the same baseline. Because it carries no labels, it must be anchored by the sentence around it—for example, a phrase like revenue rose steadily before flattening, followed immediately by the micro line that shows the trajectory. Keep the drawing simple: one line, no gridlines, no tick marks, and a stroke weight that matches the text weight so the chart reads as part of the paragraph rather than an interruption.
When placing sparklines in tabular rows, align them consistently, give every row the same time window, and scale each series against a shared baseline; otherwise, a small value can appear as dramatic as a large one. A faint end dot or final-value marker helps readers locate the most recent point without adding clutter.
Sizing and spacing matter more than people expect. Reserve a fixed width for the inline element so text wrapping stays predictable, and set vertical alignment so the line sits optically centered with the sentence. Muted colors keep the micro chart subordinate to the prose, while a single accent hue can highlight the current period. On narrow screens, allow inline sparklines to shrink or move to their own line rather than squeezing the text.
Multiple Series
When a dashboard needs to show more than one trend at a time, the choice between a multi-line chart and a collection of sparklines shapes how readable the result will be. A multi-line chart places several series on shared axes, which allows direct comparison of values at any given moment. The trade-off appears as series counts grow: lines cross repeatedly, colors multiply, and legends lengthen, so a viewer spends effort disentangling strands rather than reading the trends themselves. Distinguishing a dozen similar hues becomes difficult, and a single dominant series can obscure the others entirely.
Small multiples offer a different way to compare several data streams. Each sparkline gets its own compact frame, so every series has its own space and either its own scale or a shared one, depending on the comparison you want to support. The eye scans a row of miniature trends and picks up patterns quickly: which stream is rising, which is flattening, which is volatile. Visual clutter largely disappears because no lines overlap. The trade-off is that precise cross-series comparison of values at a single instant becomes harder, since each frame is small and separated from the others.
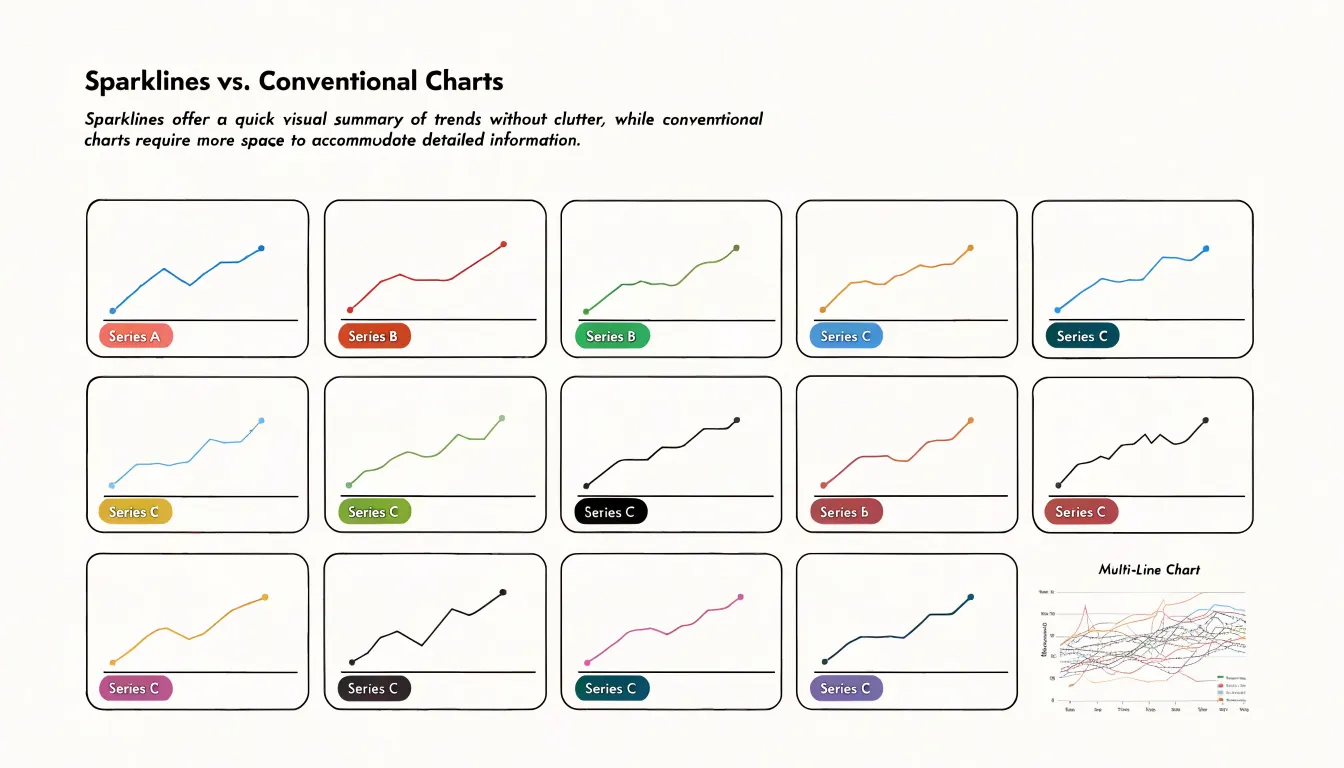
In practice, the decision often comes down to the question the reader needs answered. When the goal is tracking the shape and direction of many trends side by side, small multiples of sparklines scale gracefully from three series to thirty without becoming unreadable. When the goal is pinpointing exact intersections, gaps, or crossings between a small number of series, a conventional multi-line chart remains the clearer tool.
Misinterpretation Risk
Because sparklines compress trend information into a word-sized space without axes or tick marks, viewers see the shape of a trend while remaining blind to its actual magnitude. A line that swings dramatically upward might represent a change of fifty percent or of half a percent, and the graphic alone offers no way to tell the difference. Readers bring their own assumptions to the image, often inflating small fluctuations into dramatic stories.
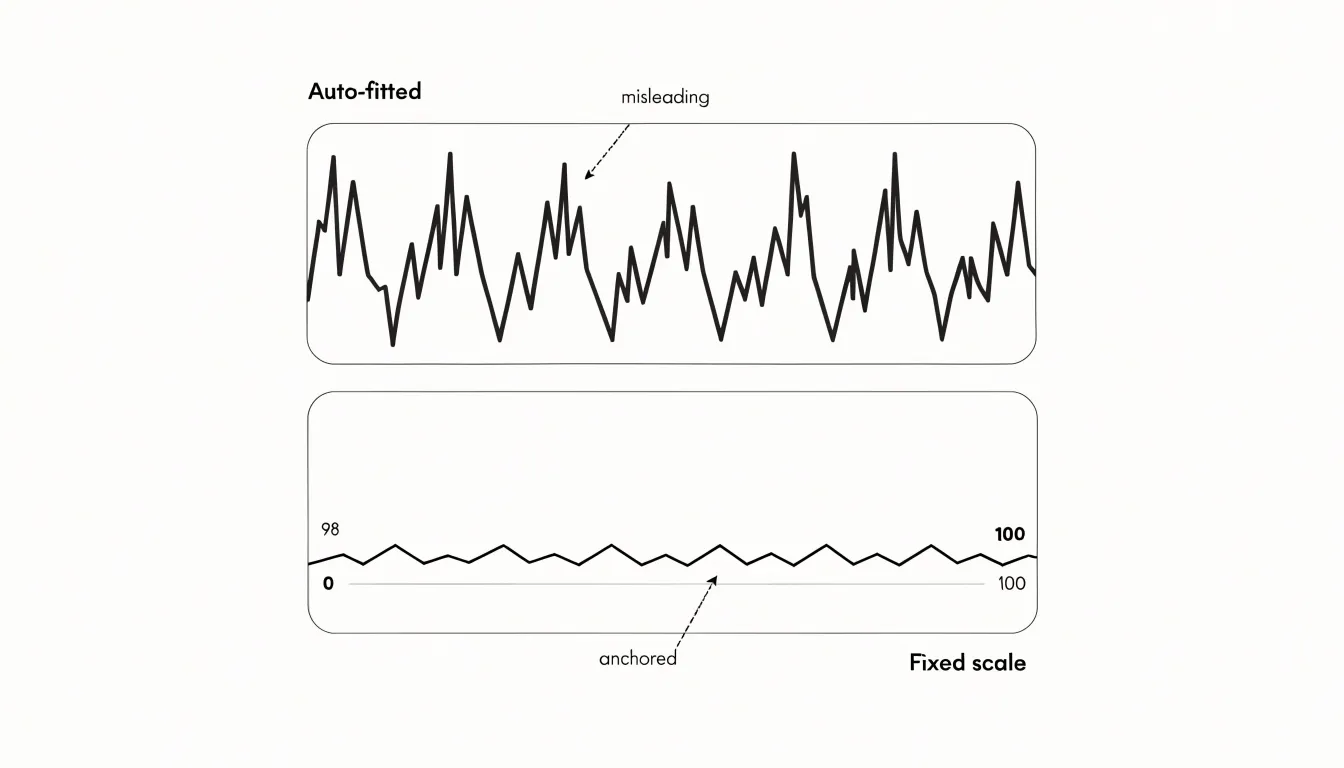
Scale distortion compounds this problem. Because sparklines automatically fit their data into a tiny frame, the vertical range is frequently set to the minimum and maximum of the visible data rather than to a meaningful reference such as zero. A series that hovers between 98 and 100 can therefore appear as volatile as one ranging from 0 to 100. Without a baseline or context marker, the eye reads every peak and trough as significant, when many are simply noise at the edges of a narrow band. Misleading baselines create a related hazard: truncating the axis to emphasize variation makes a stable metric look unstable, and a truncated sparkline embedded next to a headline can imply a crisis that the underlying numbers do not support.
Best practices to prevent misinterpretation follow directly from these risks:
- Anchor the vertical scale to a fixed, documented range—ideally including zero when the metric has a meaningful zero point—and keep that range consistent across compared charts.
- Label endpoints with their values so readers can gauge magnitude at a glance.
- Flag truncated axes visually or note them in surrounding text.
- Pair sparklines with key numbers, such as the current value or the change since a reference period.
- Reserve sparklines for showing shape over time, never for making precise comparisons.
Common Use Cases
Sparklines and line charts find their most natural applications in domains where rapid triage and deep investigation work together, such as finance, fitness, and web analytics.
In finance, stock trackers often use sparklines to give a quick sense of price movement beside a ticker symbol, letting users scan dozens of holdings at a glance without leaving the list view. A detailed line chart then takes over on the individual stock page, where axes, gridlines, and labeled data points help investors examine volatility, compare periods, and study volume alongside price.
Fitness applications follow a similar division of labor. Activity monitors embed sparklines in dashboards to show the last seven days of step counts, heart rate, or sleep duration in a narrow strip, so users absorb their recent trajectory in a second or two. When someone taps into a specific metric, a line chart presents the full history with time labels, target thresholds, and annotations for workouts or rest days. The sparkline answers whether things are trending up or down; the line chart answers why and by how much.
Web analytics dashboards lean on both forms as well. A traffic overview might place a sparkline next to each page or campaign to indicate session growth over the past month, keeping the table compact and scannable. The main traffic chart uses a line format to plot visitors, bounce rate, or conversion over selectable date ranges, complete with hover tooltips and comparison overlays. Product teams use the sparklines to spot pages worth investigating, then switch to the line chart to diagnose the pattern.
Mobile Design
Small screens impose a hard constraint on how much visual information a design can carry. On a phone, a full line chart with axes, gridlines, a legend, and a title can easily consume half the viewport, pushing surrounding content out of sight and forcing users to scroll to make sense of a single metric. Responsive design addresses this by rethinking what each element contributes. In many mobile contexts, the precise value of every data point matters less than the overall direction of the trend.
A sparkline fits naturally into this constraint, sitting inline beside a number, inside a table cell, or at the edge of a card. A dashboard that would otherwise require a dedicated chart panel on desktop can present a dozen metrics on a phone screen, each paired with its own miniature trend line.
Preserving that trend context matters because raw numbers alone are ambiguous on small screens. A figure like 4,280 tells a mobile user little about momentum; the same figure with a sparkline beside it communicates whether the metric is recovering or declining. Designers can tune sparklines for small viewports by increasing stroke weight slightly, limiting the time window to a meaningful recent period, and using a single accent color to mark the latest point. These adjustments keep the graphic legible at finger-scale without adding chrome.
Design Checklist
A practical checklist gives designers a repeatable way to move from a vague request for “a chart” to a defensible choice.
- Assess the data. Count the number of points the chart must hold and note whether they are time-ordered, categorical, or a single metric tracked over many intervals. A handful of recent values behaves differently from several years of daily readings, and that volume estimate sets a ceiling on how much visual detail the chart can carry before it stops being readable.
- Define the chart’s job. Decide whether the audience needs a precise value at a specific moment, a general sense of direction, or a comparison across categories. Write this down as a single sentence before sketching anything. Analytical contexts require labeled points and visible axes, while broad trend awareness tolerates abstraction and tighter space.
- Evaluate the audience and context. Ask who will view the chart, on what device, and for how long. A dashboard viewer scanning quickly on a laptop has different needs from someone reading a paper report or glancing at a mobile card. Review visual density alongside this: gridlines, labels, markers, and annotations each add noise that may overwhelm small canvases.
- Test with real data. Check how the candidate handles edge cases such as flat periods, sharp spikes, and gaps.
- Document the rationale. Record why one style was selected over another so future team members understand the decision.
Readability
Because sparklines operate at a scale where every design decision carries outsized weight, readability depends on three core details: stroke width, contrast, and accent points.
Stroke width is the first consideration: a line that is too thin vanishes against a busy background or on lower-resolution screens, while an overly thick stroke compresses data variation into an indistinct blob. A uniform stroke of roughly one to two pixels works well for most sparklines—preserving the clarity of peaks and troughs—and can be adjusted upward slightly for dense data or high-DPI displays.
Color and contrast follow closely behind. Because sparklines sit inside tables, dashboards, or text blocks, the line needs enough contrast against its immediate background to remain legible at a glance. High-contrast choices such as a deep blue or charcoal against white, or a light tint against a dark panel, keep the shape readable without demanding attention. Avoid low-saturation pastels that wash out at small sizes, and test the chosen color against the actual surrounding surface rather than an idealized white canvas. Where color carries meaning, such as indicating positive or negative trends, pair hue with position or shape cues so the signal survives for colorblind viewers.
Accent points complete the picture. A single highlighted dot marking the latest value, a subtle fill beneath the line, or a small marker at the minimum and maximum gives readers anchor points for interpretation. These accents should use a stronger color or slightly larger radius than the main stroke, drawing the eye to the most meaningful data while keeping the overall graphic restrained.
Balanced Dashboards
A balanced dashboard architecture pairs sparklines and line charts to support both rapid scanning and in-depth analysis within a single interface.
The key to this balance lies in layout and visual hierarchy. Place sparklines in summary cards, KPI rows, or table cells to provide immediate macro context, and reserve larger panels for exploratory line charts equipped with interactive tools like tooltips, zoom, and series toggles. Positioning sparklines above or alongside line charts creates a natural flow from overview to detail, guiding the user’s eye from the big picture to specific insights.
Consistency in style ties the two tiers together. Sparklines and line charts should share a common color palette, stroke weight, and data update cadence. When a sparkline indicates an upward trend, the corresponding line chart should use the same color encoding for that series, reinforcing the connection between macro and micro views. On smaller screens, responsive rules should keep sparklines legible while allowing full line charts to adapt within scrollable or collapsible panels.
Interactive Features
Interactive features give line charts a second layer of capability that static images cannot match. Hover tooltips form the most common starting point. When a user moves the pointer across a line, a small panel appears showing the precise value at that point, often along with the series name and the corresponding date or category label. This arrangement lets the chart carry a dense set of plotted points while the interface itself stays clean, since individual values remain hidden until the viewer asks for them.
Pan controls extend this idea across long time series. A line chart covering several years of data can compress into a narrow band of visual noise when every point is shown at once. Panning lets the user slide the visible window along the timeline, inspecting one region in detail while keeping the broader context a drag away. Dragging the chart feels natural, and the motion preserves the viewer’s orientation within the dataset.
Zoom toggles work alongside panning. A scroll wheel, pinch gesture, or dedicated zoom control lets the viewer expand a cluster of points for closer inspection and then pull back to the full picture. Combined with pan, zoom turns a single chart into a browsable surface where the user chooses the level of detail.
These elements support a layered reading experience: casual viewers glance at the overall trend, while analysts drill into exact values and narrow time ranges. Careful implementation keeps the interactions responsive and the visual feedback immediate, so the chart remains a tool for exploration rather than a puzzle to solve.
Frequently Asked Questions
What is a sparkline and what does it show?
Sparklines are compact, word-sized graphics that display a series of data points as a simple line or bar and communicate high-level directional movement. They omit axes, gridlines, labels, and legends, so they are not intended for precise value reading.
When should I use a full line chart instead of a sparkline?
Use a full line chart when exact numbers and dates carry real weight or the reader needs a precise value at a specific moment. Its labeled axes let readers trace a data marker back to the exact figure and timestamp, whereas an unlabeled sparkline leaves readers unable to resolve what a given peak represents.
How do sparklines fit into executive dashboards?
Pair each sparkline directly with its corresponding key performance indicator so the viewer absorbs both the current value and its trajectory in a single glance. Laying out these pairings in a grid or column structure allows a dashboard to display a dozen or more distinct indicators without visual clutter.
Can sparklines be misleading because they lack axes?
Yes; without knowing the scale, a reader might assume an upward trend represents a significant increase when the change is actually negligible. The article recommends anchoring the vertical scale, labeling endpoints, flagging truncated axes, pairing sparklines with key numbers, and reserving sparklines for showing shape over time rather than making precise comparisons.
How do sparklines compare with multi-line charts for showing multiple series?
Small multiples of sparklines give each series its own compact frame, so visual clutter largely disappears because no lines overlap, and they scale from three series to thirty without becoming unreadable. When the goal is pinpointing exact intersections, gaps, or crossings between a small number of series, a conventional multi-line chart remains the clearer tool.
How can I keep sparklines readable on mobile screens?
A sparkline can sit inline beside a number, inside a table cell, or at the edge of a card, and designers can tune it by increasing stroke weight slightly, limiting the time window to a meaningful recent period, and using a single accent color to mark the latest point. On narrow screens, allow inline sparklines to shrink or move to their own line rather than squeezing the text.
Tony Astor
Tony writes about data visualization and the tools people use to build charts and dashboards. More about Data Illustrator