Sparkline: Tiny Charts That Show Trends in Context
 By Tony Astor ·

Sparkline
A sparkline is a compact, word-sized chart that shows a data trend without axes, labels, or gridlines, letting readers grasp direction at a glance. Typically 15–20 pixels tall and drawn as a thin line or bar sequence, it sits inline with text or in tables, using color sparingly and marking endpoints to highlight key values.
Table of Contents
Sparkline
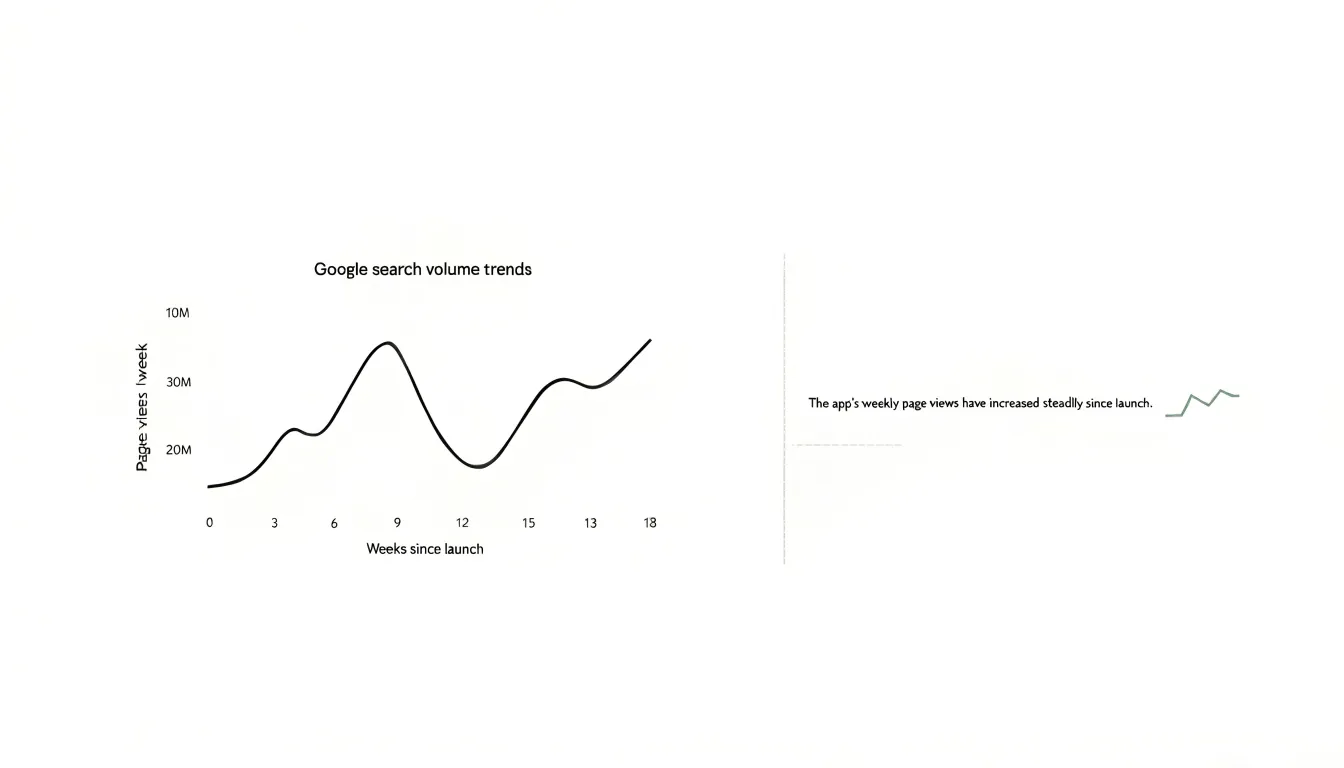
A sparkline earns its name from the way it compresses an entire time series into a footprint no larger than a word. The compact design begins with scale discipline: the chart occupies roughly the height of a line of text, often fifteen to twenty pixels, which forces every element to justify its presence. Axes, labels, gridlines, and legends are stripped away because the surrounding prose supplies the context. What remains is a bare polyline or bar sequence whose shape does the work of communicating the trend. Because the data is drawn at such small dimensions, the resolution of the line itself matters. Stroke weights stay thin and uniform so that turning points register clearly, and the horizontal scale is stretched to fill the available width, giving each data point enough horizontal room to avoid visual crowding. Aspect ratio is deliberately wide and shallow, since the human eye reads slope more readily than absolute height; a dramatic rise should look dramatic even within a few vertical pixels. The reference value, often the first point, the mean, or a target, is anchored so viewers can judge whether the series sits above or below it at a glance. Color is used sparingly and functionally, commonly to distinguish the final point, flag an outlier, or signal direction, with muted tones for the line and a single accent for emphasis. Data density is balanced against legibility: a sparkline may hold dozens of points, but they are sampled or binned so the silhouette stays clean. Typography integration completes the principle, since the graphic must sit inline with text, aligned to the baseline and sized to the x-height, letting a reader absorb a trend in the same eye movement used to read the sentence around it.
Sparkline
Sparklines and standard charts serve fundamentally different purposes, and their designs reflect these divergent goals. A sparkline is a minimalist, inline graphic typically embedded within text, a table, or a dashboard. Its primary purpose is to provide a quick, at-a-glance sense of a trend or pattern—such as a rise or fall over time—without demanding the viewer’s focused attention. To achieve this, sparklines are stripped of non-essential elements: they lack axes, labels, gridlines, and often even a legend. The data is presented in a compact, word-sized space, using a simple line or bar format. This minimalism allows sparklines to be integrated seamlessly into flowing text or dense data displays, offering context without disruption.
In contrast, standard charts—such as bar graphs, line graphs, or pie charts—are designed for detailed analysis and precise communication. They are typically larger, standalone visuals that include comprehensive labeling: axes with scales, titles, legends, and data markers. These elements enable viewers to read exact values, compare specific data points, and understand the full context of the data. Standard charts are intended for presentations, reports, or exploratory analysis where the audience needs to grasp nuances, identify outliers, or draw conclusions based on quantitative details. The design prioritizes clarity and accuracy over brevity.
The key difference in purpose shapes every design choice. Sparklines sacrifice detail for immediacy and integration; they answer the question “What is the general trend?” at a glance. Standard charts sacrifice brevity for precision; they answer “What exactly are the values, and how do they compare?” with thoroughness. Sparklines are ideal for dashboards, tables, and narrative text where space is limited and the goal is to highlight patterns. Standard charts are essential for in-depth analysis, presentations, and any context where exact numbers and comparisons matter. Understanding these differences helps in selecting the right tool: sparklines for quick trend perception, standard charts for detailed data exploration.
Sparkline
Placing sparklines alongside large financial or analytical tables addresses a fundamental challenge in data presentation: the difficulty of perceiving directional patterns within dense columns of numbers. When a reader scans a table containing dozens or hundreds of rows of quarterly revenues, daily visitor counts, or rolling averages, each individual figure competes for attention, and the overall trajectory of any single row remains invisible until someone mentally graphs it. A sparkline solves this by compressing an entire series into a small inline graphic that sits directly beside the numbers it summarizes, allowing the eye to register shape and direction without diverting attention from the row’s other values.
The practical technique begins with column placement. The sparkline typically occupies the final column of the table, following the raw values it represents, so the reader’s gaze moves from precise figures to a compact visual summary in a single sweep. Sizing matters as well: a sparkline a few characters wide and roughly one line tall preserves the table’s vertical rhythm while remaining legible. Consistent scaling across all rows is essential, since a sparkline that normalizes per row can make a declining series appear identical to a growing one; aligning each sparkline to a shared baseline or shared axis ensures that relative magnitudes remain comparable down the column.
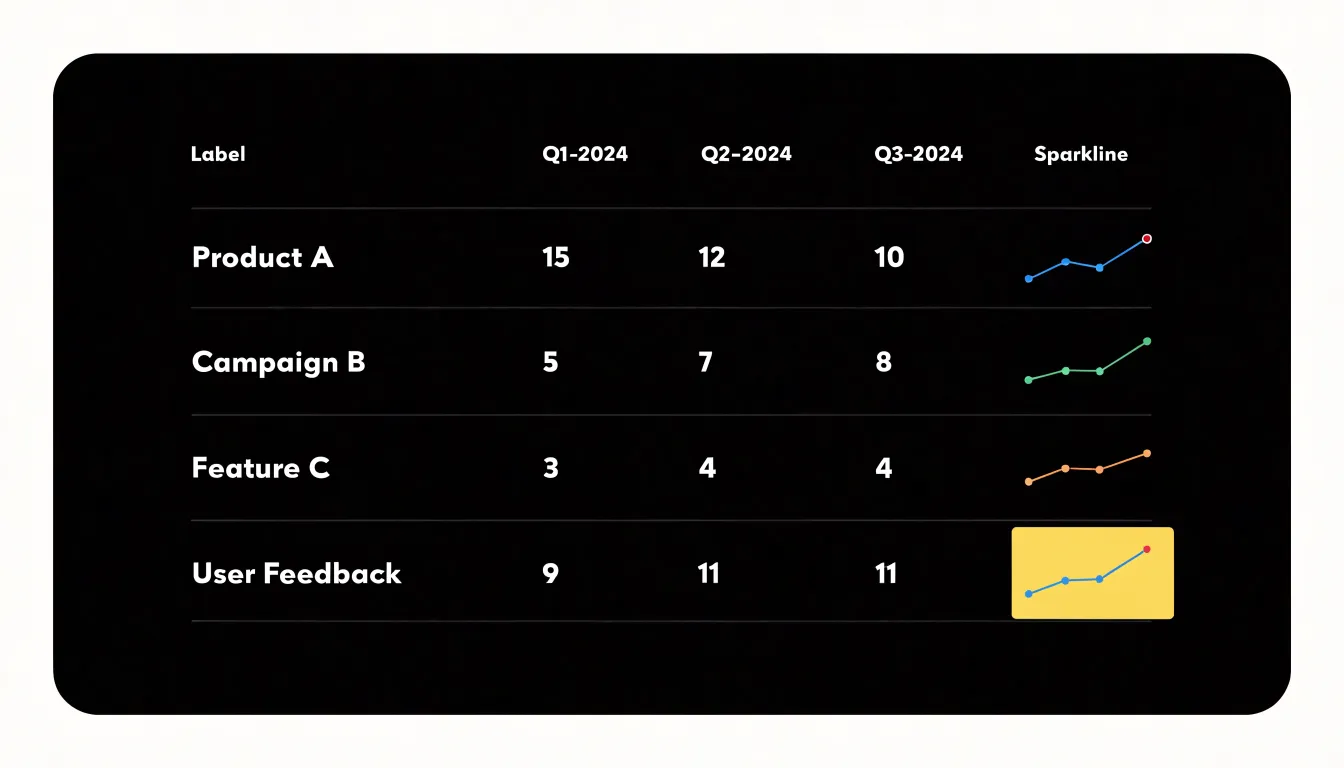
Color and marking can extend the technique’s usefulness. A subtle highlight on the final data point, or a faint band indicating a target range, gives the reader an anchor for interpreting whether the current value sits high or low within its own history. Referencing the first and last values in the sparkline’s tooltip or adjacent text reinforces the direction without cluttering the visual itself.
The cognitive benefit is substantial. Readers absorb trend direction preattentively, spotting rows that rise steadily or wobble unexpectedly, and then use the numeric columns to confirm the magnitude of what the eye has already noticed. This division of labor between visual scanning and precise reading reduces the mental effort required to interpret a large table and surfaces patterns that raw figures tend to conceal.
Sparkline
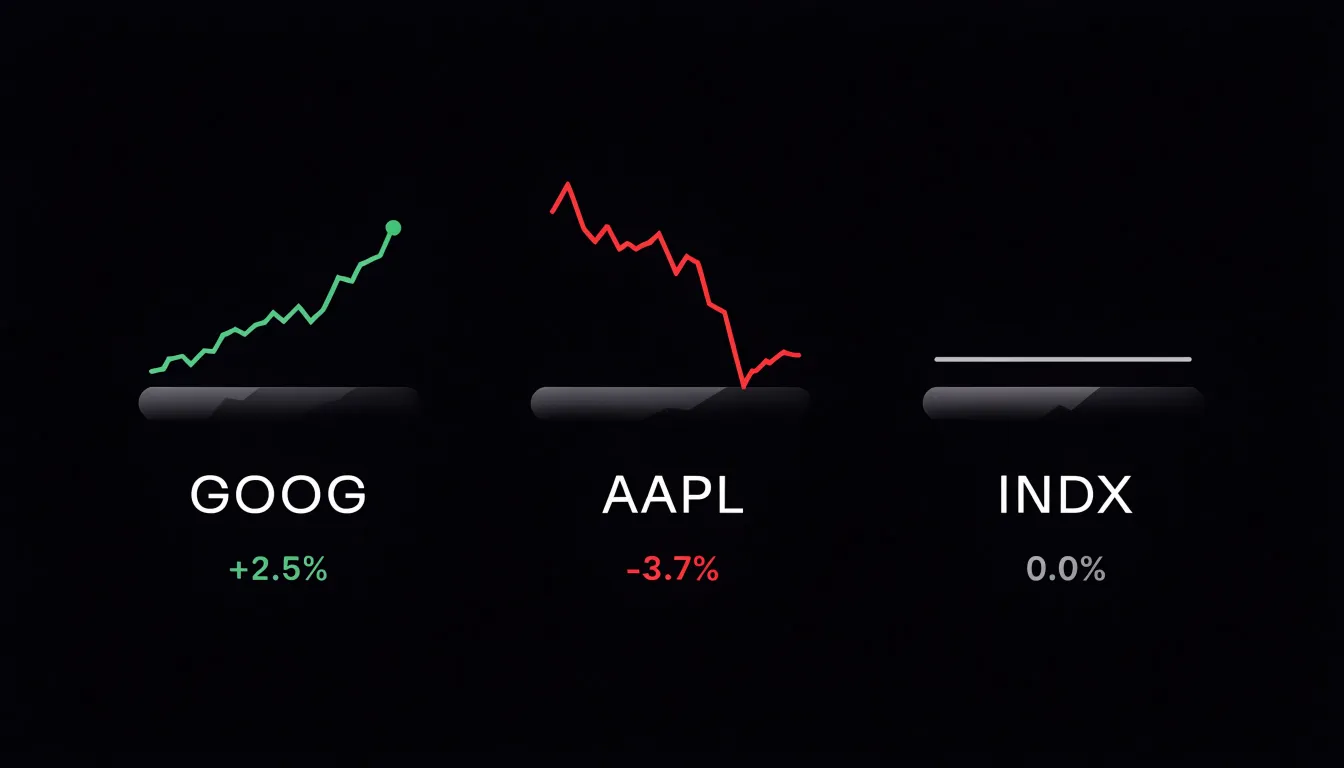
Sparklines earn their place in financial dashboards because they compress a large volume of price data into a footprint small enough to sit beside a ticker symbol, a percentage change, or a portfolio line item. An intraday sparkline renders the session’s opening, high, low, and current price as a continuous shape, letting an analyst absorb the rhythm of the trading day without switching to a full chart. A trader scanning a watchlist of forty instruments can register which names have moved in a tight band and which have swung sharply, simply by comparing the silhouettes of adjacent sparklines. Because the graphic carries no axes or gridlines, it functions as a glanceable signal that prompts a closer look rather than a complete analytical tool in itself.
Historical performance takes a similar form over longer windows. A thirty-day or twelve-month sparkline placed next to a position value shows whether the holding has trended upward, drifted downward, or oscillated within a range. Portfolio managers use these mini-charts to spot deteriorating positions before they appear in aggregate return figures, and client-facing reports use them to illustrate volatility and momentum with minimal visual clutter. The same technique works for volume, moving averages, or spread, so a single dashboard row can stack several sparklines that together tell a compact story about an instrument’s recent behavior.
Design choices matter. Color can encode direction, with green for a closing gain and red for a decline, while a subtle shaded band can mark the previous close as a reference point. Ending markers, such as a small dot at the latest value, anchor the eye and clarify which end of the line represents the present. Keeping each sparkline scaled to its own range avoids misleading comparisons across instruments of different price levels, and consistent time windows across a dashboard prevent viewers from misreading one line as covering a different period than its neighbors.
Sparkline
In modern electronic health records, the sparkline has become a quiet but powerful tool for making patient vitals legible at a glance. A sparkline is a compact, word-sized chart that displays a short series of values without axes or labels, and in clinical dashboards it is typically applied to the continuous streams of data that bedside monitors and nursing assessments generate. Heart rate, blood pressure, and temperature are recorded at regular intervals throughout a patient’s stay, and each of these measurements forms a time series that carries meaning in its shape as much as in its individual values. Placed beside a patient’s name in a ward list or embedded within a flowsheet row, a sparkline condenses twelve or twenty-four hours of readings into a small visual signature that a clinician can absorb in a fraction of a second.
The practical value emerges in how these micro-charts support pattern recognition. A heart rate sparkline that drifts steadily upward over several hours signals a developing trend that a column of discrete numbers might obscure. Blood pressure readings rendered as a sparkline reveal whether a patient is trending toward hypotension or stabilizing after an intervention. Temperature sparklines make the arc of a fever immediately visible, showing when it peaked and whether it is resolving. Because the charts occupy so little space, several vitals can be displayed together, allowing a provider to compare trends across parameters without navigating away from the current view.
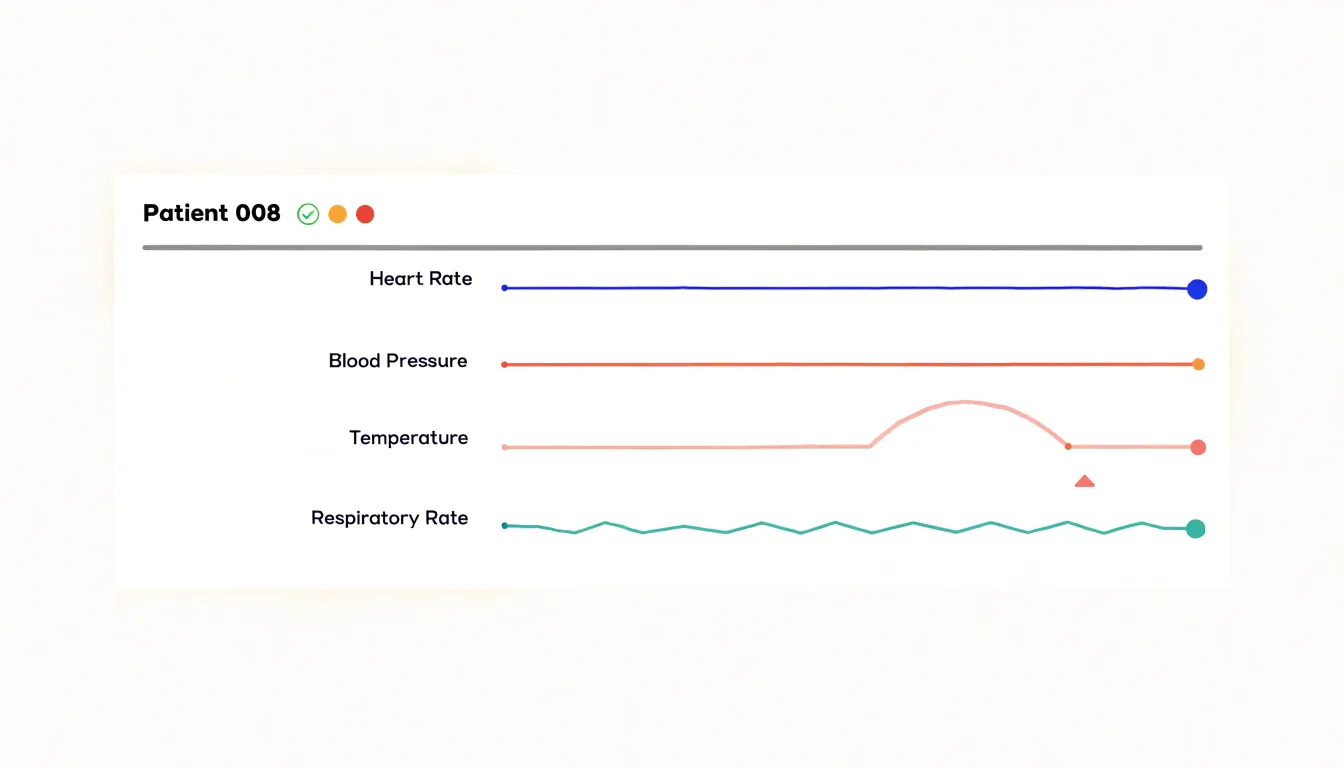
Sparklines also serve as navigational cues within the wider record. When a mini-chart shows an unusual pattern, the clinician knows to open the detailed trend view for closer inspection, while a flat, unremarkable line suggests that deeper review can wait. This layered approach to information keeps attention focused where it is most needed. In fast-paced clinical environments, where providers scan many patients in sequence, the sparkline turns raw measurement data into an immediately interpretable visual summary, supporting timely decisions about escalation, treatment adjustment, and ongoing monitoring.
Sparkline
In a web analytics dashboard, a sparkline offers a compact way to surface the rhythm of a site’s audience without consuming the space a full chart would demand. Placing these small inline graphics next to each metric turns a table of numbers into a readable narrative. A row labeled “Daily Active Users” can carry a tiny line that rises and falls across the past thirty days, letting an analyst spot a sudden spike the moment the report loads. That spike might correspond to a product launch, a mention on social media, or a newsletter send, and the sparkline gives the viewer an immediate visual cue to investigate further. Pageview trends benefit in the same way: a gentle upward slope next to the total tells the reader the site is growing, while a long declining tail signals trouble worth diagnosing. Because sparklines are drawn at the same height as the surrounding text, they integrate into the report as annotations rather than as separate charts demanding their own screen space. The design goal is density with clarity, so the implementation usually strips away axes, gridlines, and legends, keeping only the essential shape of the data. Color can encode direction or volatility, and a subtle shaded area beneath the line can emphasize volume. Interactivity, such as a tooltip on hover that reveals the exact value for a given day, adds precision without cluttering the default view. When multiple sparklines sit in a column, the reader can compare the volatility of one metric against another at a glance. The result is a reporting interface that communicates momentum and anomalies continuously, so stakeholders absorb the story of their traffic even when they only skim.
Sparkline
Choosing the right line style for a sparkline is a small decision with a large impact on how the graphic reads inside a paragraph or table cell. Because sparklines are deliberately compressed, every property of the line carries proportionally more weight. A stroke that would look delicate on a full chart can turn a sparkline into a dark smudge, while a stroke that is too thin may disappear entirely against dense body text or on high-density displays. Selecting an appropriate line weight is therefore the first consideration. A modest weight, typically close to the surrounding type’s stroke width, keeps the data visible while allowing the sparkline to sit quietly beside the words it supports.
The shape of the line matters just as much. Smooth curves can soften a series and make trends feel more organic, which suits data where gradual movement is the story. Step lines, by contrast, preserve the exact timing of changes and suit values that hold steady between updates, such as inventory counts or subscription tiers. Straight segments remain the most neutral option and avoid implying continuity that the data does not possess.
Readability also depends on context. Sparklines often appear at small sizes next to labels, in tables, or within sentences, so the line must remain legible without competing with adjacent text. Limiting decorative elements, keeping the line single-hued, and reserving heavier weights for emphasis or endpoints helps maintain that balance.
Ultimately, the goal is a line that communicates its trend at a glance while blending into the surrounding layout. Testing a few weights and shapes at the actual display size, rather than zoomed in, reveals which option stays clear without overwhelming the text around it.
Sparkline
A sparkline compresses an entire series of data into a space no larger than a word or two, which means the reader’s eye needs help finding the moments that matter most. Subtle visual markers serve this purpose by anchoring attention to the peaks and valleys within the line. A small dot placed at the highest point, another at the lowest, and a marker at the final value give the viewer immediate reference points without requiring them to trace the entire path of the line. These markers function as gentle cues, guiding the eye toward the significant turns in the data while preserving the compact, understated character of the chart.
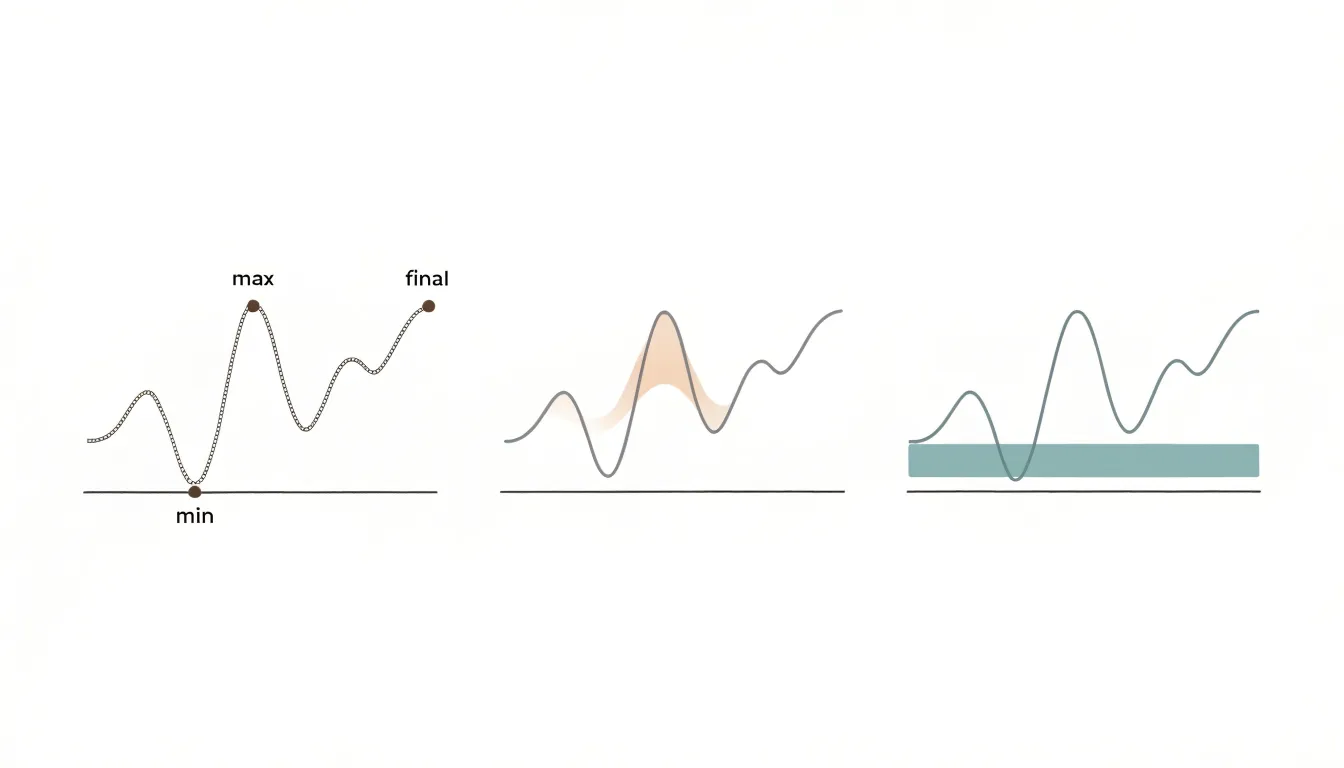
Maxima and minima are often the values that carry the most meaning in a sparkline. The highest point may indicate a record, a surge, or an anomaly worth investigating, while the lowest point can signal a dip, a shortfall, or a turning moment in the trend. Marking these extremes with a dot or a small shaded region makes them findable at a glance. The endpoint deserves similar treatment, since the most recent value frequently represents the state the viewer cares about right now. Highlighting the final point lets the reader connect the historical shape of the line to the current position in a single glance.
The choice of marker style matters for keeping the sparkline readable. Dots work well in tight spaces because they occupy very little room and can be sized slightly larger than the line stroke to stand out without dominating. Shaded regions, applied behind the segment of the line near a maximum or minimum, offer a softer form of emphasis that reads clearly even at small scales. Both approaches should stay muted in color, drawing the eye through contrast rather than through loudness. Used with restraint, these small visual accents transform a simple line into a chart that tells the viewer where to look.
Sparkline
When several sparklines sit side by side, each one carries an implicit invitation to compare. Readers glance across the row and draw conclusions about which metric is rising faster, which is more volatile, or which has recovered best. Those conclusions depend entirely on how each y-axis is scaled, and inconsistent baselines can quietly distort the picture. A sparkline whose vertical range spans a few percentage points will show dramatic peaks and valleys, while an adjacent sparkline covering a much wider range may look almost flat even when its underlying movement is larger in absolute terms. The visual impression contradicts the data.
The most reliable practice is to establish a shared baseline across any group of sparklines meant to be read together. This usually means anchoring the bottom of each y-axis at the same value, often zero for count-based metrics, and allowing the top of the range to be set by the largest value in the whole set rather than by each individual series. When zero is not meaningful, such as with temperature or index values, a common minimum drawn from the full dataset serves the same purpose. The goal is that a given vertical distance represents the same magnitude of change in every chart in the group.
Consistency should also extend over time. If sparklines update as new data arrives, the baseline should not shift every refresh, since a rescaling axis makes historical shapes look different from one viewing to the next. Fixing the range for a defined period, or expanding it only when values genuinely exceed the current bounds, keeps the visual story stable. Annotating extremes and labeling the range explicitly gives readers the context they need to interpret what they see. Applied together, these practices preserve the sparkline’s compactness while keeping cross-chart comparisons honest.
Sparkline
Color in a sparkline carries meaning the moment it appears, so the palette deserves deliberate restraint. A sparkline is a compact line chart that lives inline with text, often no larger than a word or two in height, and its job is to suggest a trend at a glance. When color is added, it should reinforce that single message: whether the measured value is moving in a favorable or unfavorable direction. The most reliable approach is to reserve two distinct hues, one for positive movement and one for negative movement, and to keep both muted enough that they sit comfortably beside body text. A soft green and a warm red, or a calm blue and an understated orange, give readers a directional signal without turning the chart into a focal point. Saturation matters as much as hue; fully saturated colors vibrate against surrounding prose and compete for attention, while desaturated tones read as information rather than decoration. The color should be applied to the line itself, and optionally to a subtle fill beneath it, so the shape of the trend remains the primary visual cue. Redundant encoding helps here: the direction of the line still communicates the trend even for readers who cannot distinguish the two hues. The palette should also stay consistent across every sparkline in a document or dashboard, so a reader learns the convention once and applies it everywhere. Neutral gray remains a sensible choice for lines where direction is neither good nor bad, or where the surrounding text already explains the movement. Limits on the number of colors, the intensity of each, and the contexts in which they appear keep the sparkline quiet, legible, and immediately useful.
Sparkline
Creating a sparkline in a spreadsheet begins with recognizing that both Microsoft Excel and Google Sheets offer native tools for the task, and the process is straightforward once you know where to look. In Excel, select the single cell where you want the sparkline to appear, then navigate to the Insert tab and locate the Sparklines group. You will see three options: Line, Column, and Win/Loss. Choose the type that matches your data story, and a dialog box opens asking for the Data Range, which is the row or column of values the sparkline should summarize. After confirming the range and the destination cell, click OK and the sparkline appears. From there, the Sparkline tab on the ribbon lets you adjust the style, toggle markers for high and low points, change the line color, and set axis options such as plotting the data from right to left.
Google Sheets handles the same task through a dedicated function. The SPARKLINE formula takes the range of cells as its first argument and an options object as its second, so a basic line sparkline looks like =SPARKLINE(B2:B10). The options argument accepts a set of key-value pairs that control the chart type, color, line width, and whether to display min, max, and other points. For instance, you can set the chart type to column or winloss, choose a custom color, and enable markers for the highest and lowest values in a single formula. Because the sparkline is formula-driven, it updates automatically whenever the underlying data changes, and you can copy the formula down a column to generate a compact visual for each row of a table.
Sparkline
Embedding a sparkline directly into web copy begins with choosing a rendering technology, and each option carries its own trade-offs in file size, flexibility, and accessibility. The HTML canvas element offers a drawing surface controlled through JavaScript, making it well suited to compact charts that update frequently. A developer sets a small width and height, retrieves the 2D context, and plots points as a path of line segments. Canvas renders efficiently because the browser treats the result as a single bitmap, though this also means the individual data points are not exposed to assistive technologies or search engines without additional markup.
SVG takes a different approach by describing each line, circle, and path as an element in the document tree. This makes SVG sparklines scalable without pixelation and allows CSS styling, hover effects, and tooltips to be attached to individual data marks. Because the shapes remain part of the DOM, screen readers can be given descriptive labels and the underlying values can be stored in attributes. The cost is a larger markup footprint, which matters when dozens of sparklines appear in a single article.
Specialized JavaScript libraries reduce the implementation work by wrapping either canvas or SVG rendering behind a consistent API. Libraries such as D3, Sparkline.js, and similar micro-libraries accept an array of numbers and a container element, then handle scaling, axis placement, and responsive resizing automatically. Many support options for line, bar, and area variants, along with color thresholds that highlight positive or negative trends. When integrating any of these methods into prose, the chart container should be sized inline so the sparkline flows with the surrounding text, and a text alternative or aria-label should accompany the graphic so the information remains available to every reader.
Sparkline
When an executive control panel must carry dozens of sparkline metrics at once, layout becomes the primary instrument for controlling clutter. A useful starting point is a strict grid: fixed cell dimensions, consistent gutters, and a uniform sparkline height across every tile. Uniformity lets the eye scan the panel as a rhythm rather than a series of unique objects, so a viewer can locate an anomaly without re-learning the visual grammar at each row. Grouping is the second lever. Metrics that answer the same business question belong in the same band or column, ordered by importance or by the decision they inform. Tight visual proximity within a group, combined with slightly larger gaps between groups, produces implied structure without drawing borders or boxes around everything.
Density management matters as much as arrangement. Each tile needs a label, a current value, and the sparkline itself, and the label typically consumes more space than the chart. Abbreviated metric names, aligned value columns, and a single shared time axis per band keep the footprint small. Where space is tightest, small multiples arranged in a matrix of equal cells allow fifty or more metrics to coexist, provided the sparklines share an identical x-range so comparisons remain honest. Alternating row shading or a faint background tint can separate bands without adding chrome.
Visual hierarchy should be built from contrast rather than decoration. Reserve saturated color for the few metrics that warrant attention and render the rest in muted tones. Identical scales within a group prevent misleading amplitude differences, and consistent baseline placement keeps the overall texture calm. Finally, progressive disclosure helps: show a compact overview of every sparkline, and let a click or hover reveal a larger view with annotations. The overview preserves breadth; the detail view supplies depth when a specific signal needs investigation.
Frequently Asked Questions
What is a sparkline?
A sparkline is a compact, word-sized chart that compresses a time series into a small inline graphic without axes, labels, gridlines, or legends, so viewers can grasp a trend at a glance.
How is a sparkline different from a standard chart?
A sparkline is a minimalist, inline graphic designed for quick trend perception, while a standard chart is typically larger and standalone with axes, labels, legends, and data markers for detailed analysis and precise comparison. Sparklines sacrifice detail for immediacy and integration; standard charts sacrifice brevity for precision.
How do you create a sparkline in Excel or Google Sheets?
In Excel, select the destination cell, go to Insert and the Sparklines group, choose Line, Column, or Win/Loss, and set the Data Range. In Google Sheets, use the SPARKLINE formula with a range and options, such as =SPARKLINE(B2:B10), and it updates automatically when the underlying data changes.
Why place sparklines next to table rows?
Sparklines sit beside the numbers they summarize and let the eye register shape and direction without mentally graphing dense columns of figures. They typically occupy the final column after the raw values, and consistent scaling across rows helps keep relative magnitudes comparable.
How should sparklines be scaled when several are compared side by side?
Use a shared baseline across any group of sparklines meant to be read together, often anchoring the bottom of each y-axis at zero for count-based metrics or a common minimum from the full dataset when zero is not meaningful. Avoid per-series rescaling that can make a declining series look identical to a growing one.
How are sparklines used in clinical dashboards?
Sparklines in clinical dashboards condense short series of patient vitals such as heart rate, blood pressure, and temperature into small visual signatures placed beside a patient’s name or within a flowsheet row. They support pattern recognition, such as a heart rate drifting upward over several hours or the arc of a fever becoming immediately visible.
Tony Astor
Tony writes about data visualization and the tools people use to build charts and dashboards. More about Data Illustrator