Slope Chart: Comparing Change Between Two Points
 By Tony Astor ·
Slope Chart
A slope chart is a two-axis visualization that connects each category’s starting value to its ending value with a straight line, showing direction, magnitude, and rank changes between two points in time. It is ideal for before-and-after comparisons across many categories, unlike line graphs, which show interim fluctuations across a full time series.
Table of Contents
Slope Chart
A slope chart is built for one central question: how values moved from a defined starting point to a defined ending point. It uses two parallel vertical axes—one for each time period—with a straight line connecting each entity’s initial value to its final value. The reader sees the starting position, the ending position, and the angle and direction of the connecting line all at once. A steep upward line signals strong growth, a gentle downward line signals mild decline, and crossing lines reveal reversals in ranking. Because the eye naturally follows the line from left to right, the movement registers before any number is read.
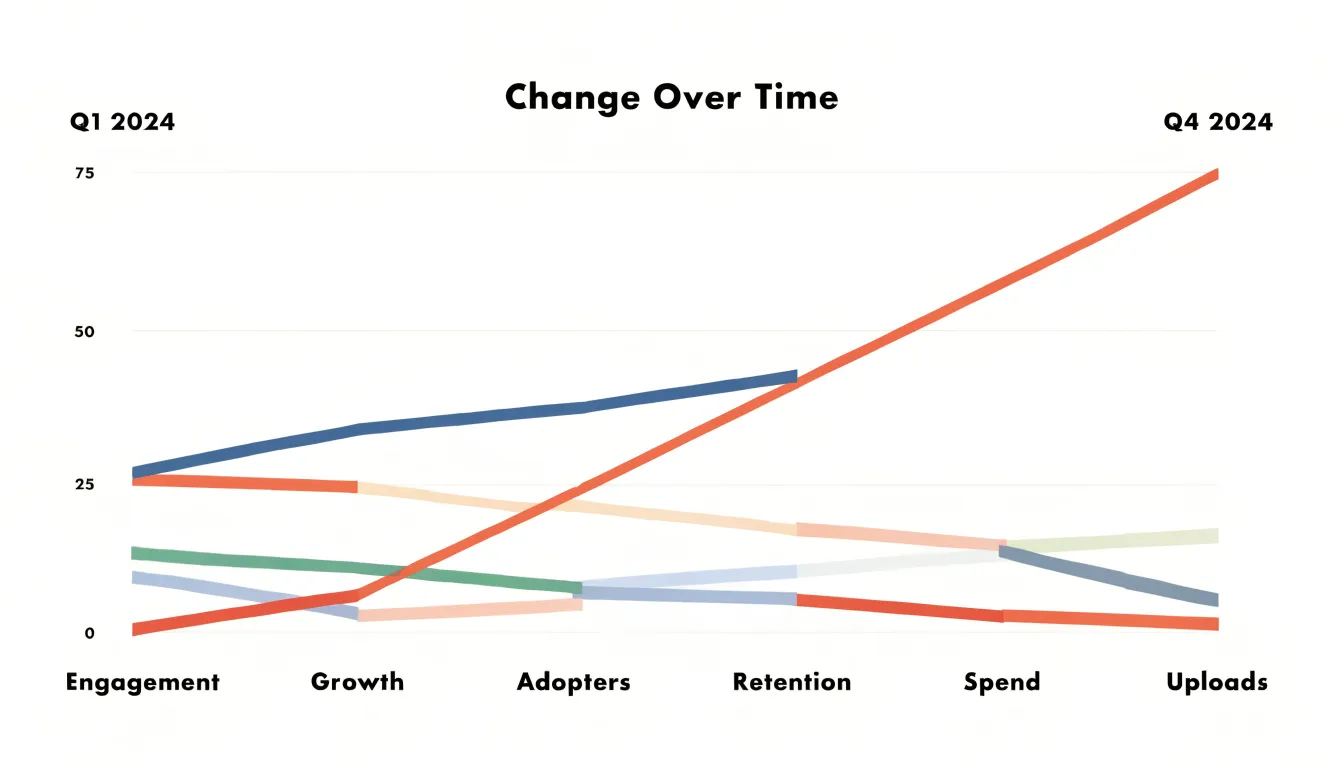
Several scenarios benefit from this focused layout:
- Budget comparisons between two fiscal years show which departments expanded or contracted and by how much.
- Before-and-after evaluations of a program or intervention show each participant or region shifting from baseline to outcome.
- Market share snapshots across two quarters reveal which competitors gained ground at whose expense.
- Year-over-year performance reviews of products, regions, or teams collapse a long story into a single readable transition.
The alternative—a dense multi-period table—carries all the same numbers but forces the reader to compute differences mentally and scan across columns to reconstruct movement. A table with a dozen periods and dozens of rows becomes a wall of figures in which the important transition disappears. The slope chart trades that completeness for clarity on the initial and final values, directing attention to the size and direction of change.
Slope Chart vs. Line Graph
A slope chart and a line graph both track change over time, yet they serve different analytical questions. Because a slope chart connects only two (or occasionally three) time points per category, it stays clean even with a dozen or more series, and labels can sit beside the start and end points without crowding. Parallel lines immediately signal similar trajectories. When a report needs to show which product gained the most share over a year or which region reduced emissions between two reporting periods, the slope chart answers the question directly.
A line graph, by contrast, connects every observation across the full time series. It reveals interim fluctuations—seasonal dips, mid-period surges, plateaus, and reversals—that a two-point summary erases. A line graph encourages the reader to interpret rhythm and volatility, making it the stronger option when the path itself carries meaning, such as tracking daily website traffic through a product launch.
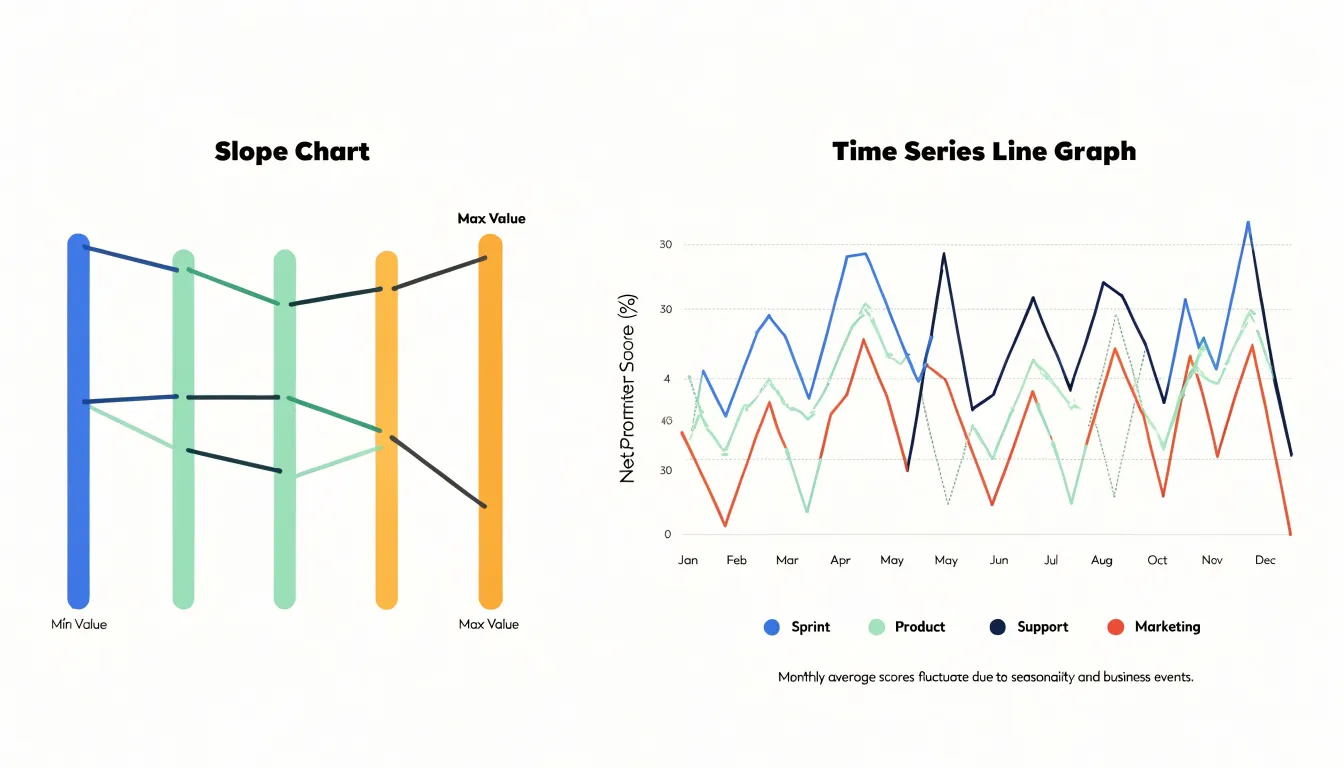
Use a slope chart when the story is about net movement between endpoints and you want to compare many categories at once. Use a line graph when the journey matters as much as the destination, when dense intervals justify a continuous line, or when audiences need to see where a trend turned.
Slope Chart
A slope chart earns its name from the way each line climbs, falls, or holds level between its endpoints:
- Upward lines show growth from the earlier period to the later one; the steeper the rise, the larger the increase.
- Downward lines signal a decline, with steepness reflecting how much ground was lost.
- Horizontal lines mark stability, meaning the value stayed essentially the same across the interval.
Because readers perceive direction and angle almost instantly, the eye can sort a chart into risers, fallers, and steady performers at a glance. Lines that end higher than they began—particularly those with the steepest ascent—stand out as top performers, while downward tilts point to laggards. When endpoints are ordered by value, the line finishing at the top of the right-hand axis marks the leading position regardless of where it started, and a line that begins high but ends low tells a story of lost ground.
A few habits sharpen this reading. Check both the start and end values, because a steep slope from a small base can be less impressive in absolute terms than a gentle slope from a large one. Watch for crossing lines, which reveal changes in rank and often the most interesting shifts in the data. Finally, confirm that the vertical scale is consistent across both axes so that steepness means the same thing throughout.
Slope Chart
A slope chart’s effectiveness diminishes when too many lines clutter the display. Overlapping paths create visual noise, making it hard to trace individual series or spot patterns. Four strategies reduce this clutter:
- Filtering: Limit the chart to a relevant subset of data, such as the top and bottom performers, categories showing significant change, or a specific group of interest.
- Thinning data points and series: In slope charts with more than two time points, showing every interval can create a dense web; display only the start, end, and key milestones. To thin the categories themselves, aggregate minor series into an “Other” group or use sampling.
- Highlighting key paths: Use color, line thickness, or annotations to draw attention to critical lines while de-emphasizing the rest with lighter shades or reduced opacity.
- Interactive features: Add hover tooltips or toggles so users can isolate specific lines on demand without permanent visual overload.
Slope Chart
Color and labeling are the primary tools for establishing visual hierarchy in a slope chart, and they work best with restraint. Because the human eye registers contrast before shape or position, the key decision is which lines receive saturated, distinct color and which recede. A reliable approach is to assign vivid hues to the one or two series whose change matters most, while rendering the remaining lines in a uniform light gray. The reader sees the highlighted trajectory first, then uses the gray lines as context. This contrast should be strong enough to read at a glance on a small screen or in print.
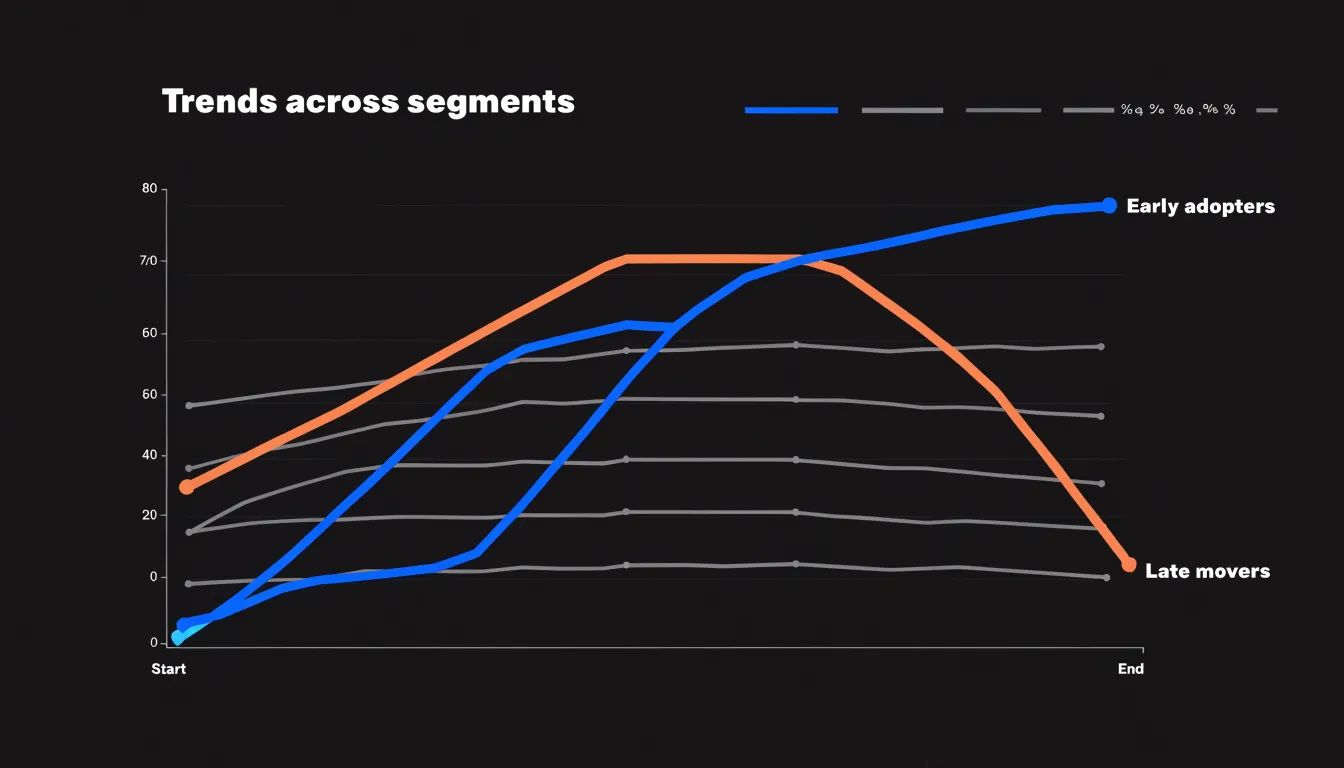
Direct line labeling reinforces this hierarchy by eliminating the need for a separate legend and the back-and-forth eye movement it requires. Placing the series name at the end of each line, aligned with its final value, lets readers identify a trajectory in a single glance. Labels on highlighted lines can carry bolder type or a slightly larger size, while labels on de-emphasized lines stay light and small. Where lines converge or cross near the endpoints, offset the labels slightly or add a small gap between lines to keep the text legible.
Slope Chart
Sorting and grouping the starting values on the left axis turns a tangle of intersecting lines into a structured map of movement. First, decide the sequence logic: alphabetical order suits categorical labels with no natural hierarchy, while ordinal sorting by starting value places the largest or smallest figure at the top for a consistent reading rhythm. Grouping adds another layer by clustering related entities—such as regions, product families, or departments—so the eye can compare within a cohort before comparing across cohorts.
When baseline values are sorted, any line crossing signals a genuine reversal of rank rather than visual noise from arbitrary placement. A reader can trace a line and immediately see whether it overtakes its neighbors or falls behind. Grouping reinforces this by creating visual bands: if one cluster moves upward while another moves downward, the chart communicates a systemic difference across cohorts.
Reinforce this structure with consistent color assignment within groups, generous vertical gaps between clusters, and labels at both ends of each line. The baseline organization does most of the explanatory work before the reader even traces an individual path.
Slope Chart
In an executive summary, a slope chart compresses a before-and-after story into a compact visual proof of accountability. Decision-makers can scan the two axes in seconds to evaluate the outcome of an intervention across regions, product lines, or teams. Visual contrast between endpoints makes outliers obvious, separating programs that delivered exceptional results from those that stagnated or underperformed.
Specific design choices tailor the chart for executive review:
- Use color to distinguish positive from negative movement, or to separate category groups.
- Order lines by ending value or by change magnitude to guide the eye through the hierarchy of results.
- Annotate the intervention point and its expected effect to provide immediate context.
- Write a short headline stating the specific outcome (such as a percentage improvement) to turn the chart into a self-contained argument.
Slope Chart
Sales and revenue data provide natural use cases for slope charts across three common workflows:
- Quarterly territory growth: Plotting each territory’s revenue from the start to the end of the year shows which regions are accelerating and which are slipping. A territory that starts in fourth position and finishes in first will cross three other lines, immediately flagging its breakout growth for sales leaders.
- Product revenue shifts: Plotting product lines across periods shows how the portfolio mix is evolving. A flat line indicates a stable contribution, while a steep rise signals a breakout product. You can also encode a secondary metric, such as profit margin, by varying line thickness or color to add depth without clutter.
- Account churn analysis: Plotting individual customer revenue from the previous quarter to the current one highlights retention risks. Sharp downward slopes indicate churn or downsell, while rising lines show account expansion. Sorting accounts by starting revenue or magnitude of change helps teams prioritize retention efforts—a high-value account with a steep decline stands out as an urgent case.
Slope Chart
Preparing data for a slope chart starts with recognizing the two standard table layouts. Wide format places each time period in its own column with one row per entity (for example, regional sales with side-by-side columns for 2021, 2022, and 2023). This maps directly to a slope chart in many tools, as each row becomes a line. Long format stores each observation on its own row, using separate columns for the entity, the time period, and the value. Databases and analysis tools often export long data, so reshaping (pivoting) it into wide form—or unpivoting wide data to filter and aggregate it—is a routine first step. In either format, verify that entity names match character-for-character across periods; a single typo will split one trajectory into two broken lines.
Missing values require an explicit rule. Because a slope chart connects two points, an absent value at either end leaves nothing to draw. Some tools drop the incomplete pair silently, others plot a broken line, and a few treat blanks as zero—creating a steep, false slope. Decide in advance whether to exclude, interpolate, or flag incomplete pairs, apply that rule across all entities, and document the choice.
When entities start at vastly different magnitudes, small absolute changes on a large base disappear next to large changes on a small base. Standardizing the baseline makes relative movement comparable. You can index every series to a common starting value (typically 100) or plot percentage change instead of raw units. Label the axis clearly so readers know whether they are looking at raw values or an index, and check that the transformation preserves the intended ranking and direction of change.
Slope Chart
To build a slope chart in Excel:
- Arrange the data: Place category names in a leading column, followed by two columns for the start and end values.
- Insert the chart: Select the full range including labels, go to the Insert tab, and choose a standard Line Chart with Markers from the charts gallery. Ensure each category plots as a separate series so every line can be styled and labeled independently (use Switch Row/Column if Excel groups them by time period instead).
- Strip default clutter: Delete the legend, gridlines, and horizontal axis labels. Keep the vertical axis only if the scale aids interpretation. Format the horizontal axis tick mark positions so the two endpoints sit directly on the left and right edges of the plot area.
- Style lines and markers: Adjust line weights and marker styles for legibility, applying color to highlight key movements.
- Add direct data labels: Right-click a series, choose Add Data Labels, and position the labels to the left of the starting markers and the right of the ending markers. Format label colors to match their lines, remove redundant text, and repeat for each series.
- Finalize the layout: Resize the plot area to give labels breathing room, remove the outer chart border, and add a concise title.
Slope Chart
Building a dynamic slope chart in Tableau relies on dual axes, parameters, and calculated fields:
- Set up the dual axis: Place your dimension on the Columns shelf (or Detail) and your two measures on Rows, one above the other. Right-click the second measure, select Dual Axis, and synchronize the axes so both measures share a common scale.
- Add measure-swapping parameters: Create a parameter that lets viewers choose which measures define the start and end points. Build calculated fields that swap the active measures based on the parameter selection, and place these on the Rows shelf so the chart redraws dynamically.
- Filter with a ranking parameter: Create a second parameter paired with a
RANKorINDEXcalculated field to filter the view to the top or bottom N performers, keeping the chart readable when the dataset contains hundreds of categories. - Encode change with calculated fields: Create a calculated field comparing start and end values to assign colors for increases vs. decreases, and another to compute percentage change for endpoint labels.
- Format and test: Hide the vertical axis lines, reduce mark sizes, and add direct end labels showing the category name and value. Test the dashboard across different parameter selections to confirm that labels, colors, and filters update cleanly.
Slope Chart
Three common design mistakes can distort or obscure a slope chart:
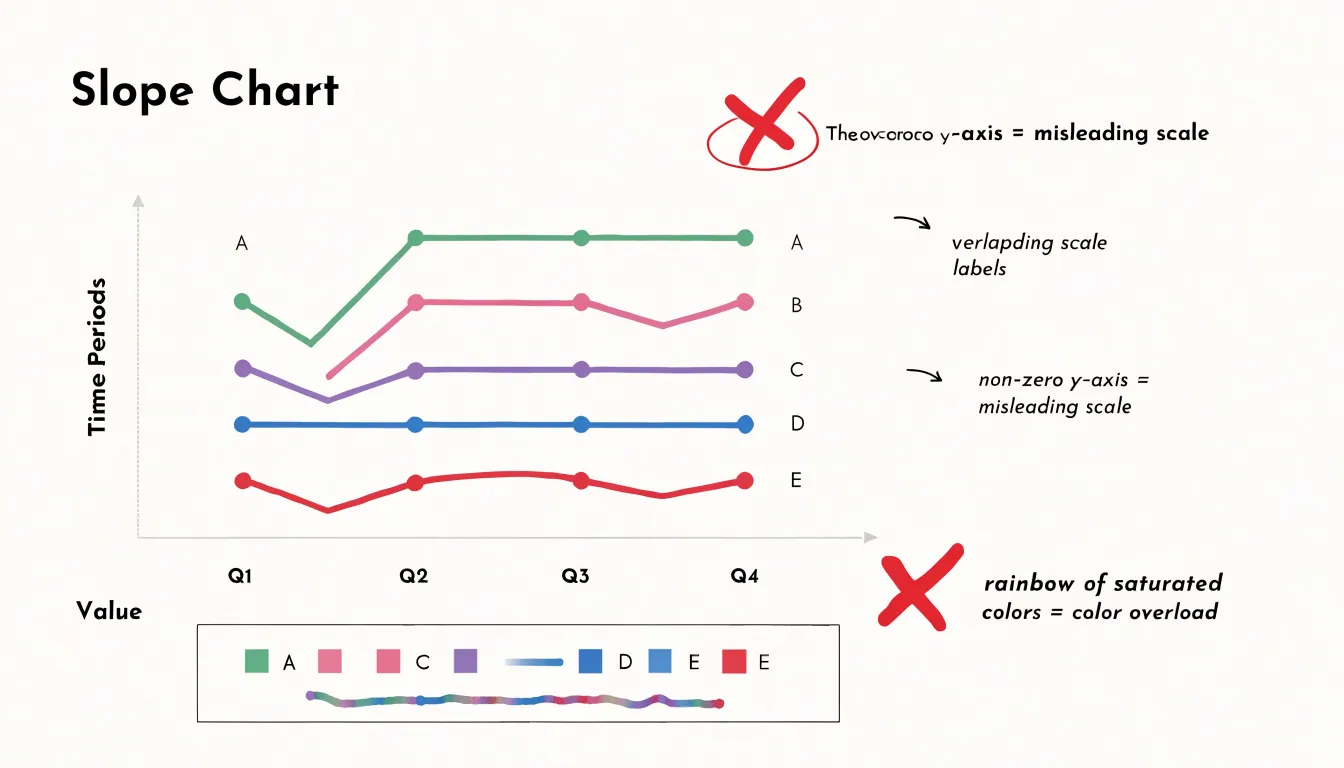
- Overcrowding category labels: Packing too many lines into a tight space causes labels to collide. Limit a static chart to no more than seven to ten categories with direct end labels; if more categories are required, rely on interactive hover tooltips or filtering.
- Misleading scales: Because the line angle encodes change, the y-axis scale must be consistent across both endpoints. Starting the y-axis at a non-zero value can exaggerate small differences, while an overly compressed scale masks meaningful shifts. Use a zero baseline when appropriate, or clearly indicate scale bounds, and never use different scales for the left and right axes.
- Overusing bright colors: A rainbow of saturated hues creates visual fatigue and hides the takeaway. Use a restrained, colorblind-friendly palette that highlights one or two focal categories and keeps the rest in muted tones.
Slope Chart
Designing accessible slope charts requires attention to contrast, redundant encoding, and screen-reader compatibility:
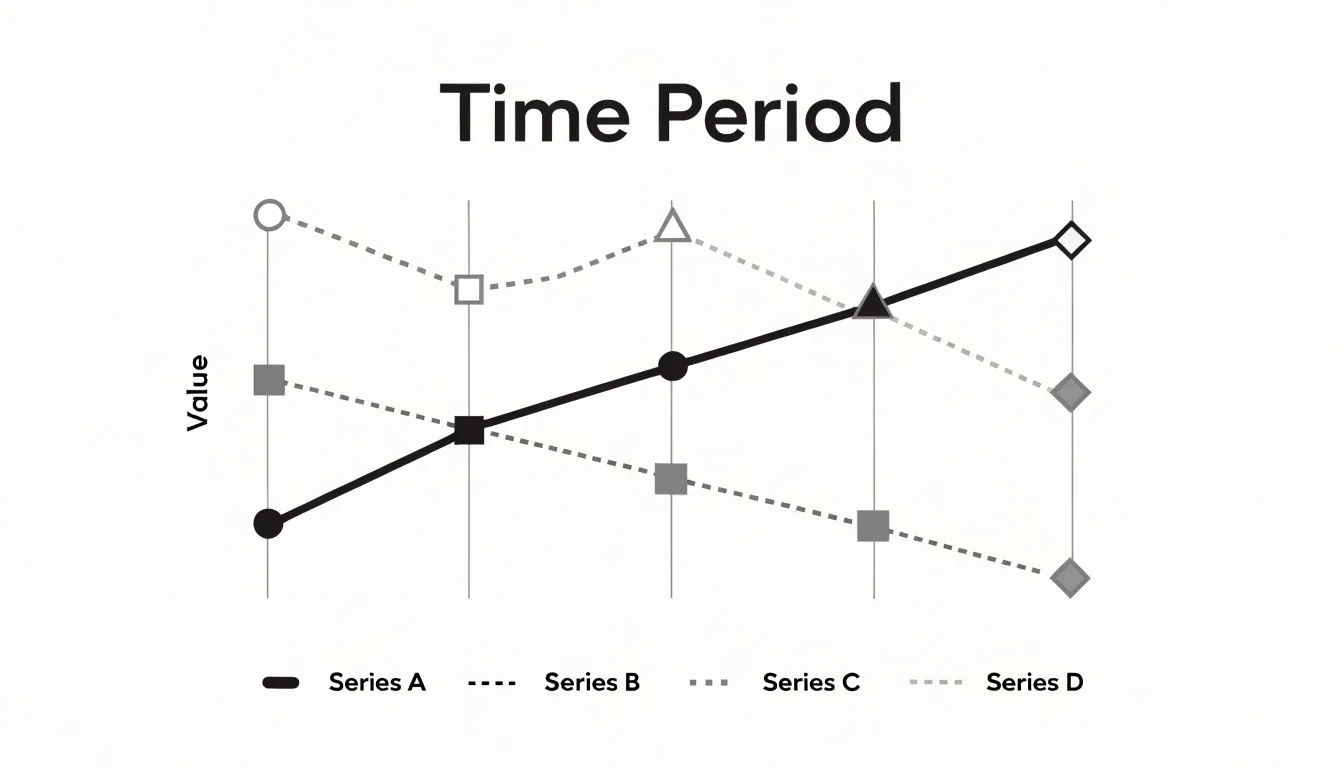
- Color and luminance contrast: Every line and marker must stand out against the background and neighboring lines for readers with low vision or reduced color sensitivity. Rely on strong luminance differences rather than subtle hue shifts alone. Test contrast ratios with standard accessibility checkers, increase line weights, or add a light outline around markers to preserve legibility on busy backgrounds and in print.
- Redundant visual cues: Never rely on color alone to distinguish series. Combine color with line patterns (dashes, dots, or long-and-short strokes) and distinct marker shapes at the endpoints so readers who confuse red and green—or who view the chart on a small screen or in grayscale—can track each path. Pair these patterns and shapes explicitly in a key if direct labels are not enough.
- Screen-reader support and data tables: Provide the underlying data as a properly structured HTML table with clear headers, row and column labels, and a descriptive caption. Place the table nearby or inside a collapsible element so assistive technology users can read exact values and compare changes directly. Pair the chart with concise alt text that summarizes the main trends to complement the table.
Slope Chart
Combining a strong title, targeted annotations, and contextual callouts turns a slope chart from a passive display into a tool for decision-making:
- Action-oriented titles: Frame the data’s significance immediately with a headline that states the core finding, such as “Customer Satisfaction Jumped 20% After Service Redesign.”
- Direct annotations: Highlight the steepest increase, flag an unexpected rank reversal, or call out specific start and end values directly on the canvas to guide the viewer’s eye.
- Contextual callouts: Explain the why behind the numbers. A note reading “New onboarding process introduced in Q2” next to a rising slope, or a marker noting that a competitor’s decline coincided with a price increase, links cause and effect directly on the visual.
Together, these narrative cues reduce cognitive load so stakeholders can grasp what happened, why it matters, and where to act—whether that means funding a successful initiative or intervening in a declining trend.
Frequently Asked Questions
What is a slope chart used for?
A slope chart is built to show how values moved from a defined starting point to a defined ending point using two parallel vertical axes and a line connecting each entity’s initial and final values. It helps readers see starting position, ending position, and the direction and angle of change at once.
What is the difference between a slope chart and a line graph?
A slope chart connects only two or occasionally three time points per category and works well for comparing net movement between endpoints across many categories. A line graph connects every observation across the full time series and is stronger when the journey, interim fluctuations, or volatility matter.
How do you read a slope chart?
Upward lines show growth from the earlier period to the later one, downward lines signal decline, and horizontal lines mark stability. Steeper lines reflect larger increases or declines, and crossing lines reveal changes in rank.
How can I reduce clutter in a slope chart?
Limit the chart to a relevant subset of data, thin data points and series, highlight key paths with color, line thickness, or annotations, and use interactive features such as hover tooltips or toggles to isolate specific lines on demand.
How many categories should a static slope chart show?
Limit a static slope chart to no more than seven to ten categories with direct end labels. If more categories are required, rely on interactive hover tooltips or filtering.
How do you make a slope chart accessible?
Every line and marker should stand out against the background and neighboring lines with strong luminance contrast, and color should not be the only cue—combine it with line patterns and distinct marker shapes. Also provide the underlying data as a structured HTML table and pair the chart with concise alt text summarizing the main trends.
Tony Astor
Tony writes about data visualization and the tools people use to build charts and dashboards. More about Data Illustrator