Should the Y-Axis Start at Zero? When It Matters
 By Tony Astor ·

Should the Y-Axis Start at Zero? When It Matters
Bar charts must always start at zero because their length encodes magnitude, and truncation exaggerates differences. Line charts may use a non-zero baseline when tracking continuous change, rates, or values far from zero, provided the truncated axis is clearly labeled. Zero is optional only on interval scales, like Celsius, where zero is arbitrary.
Table of Contents
Bar Charts
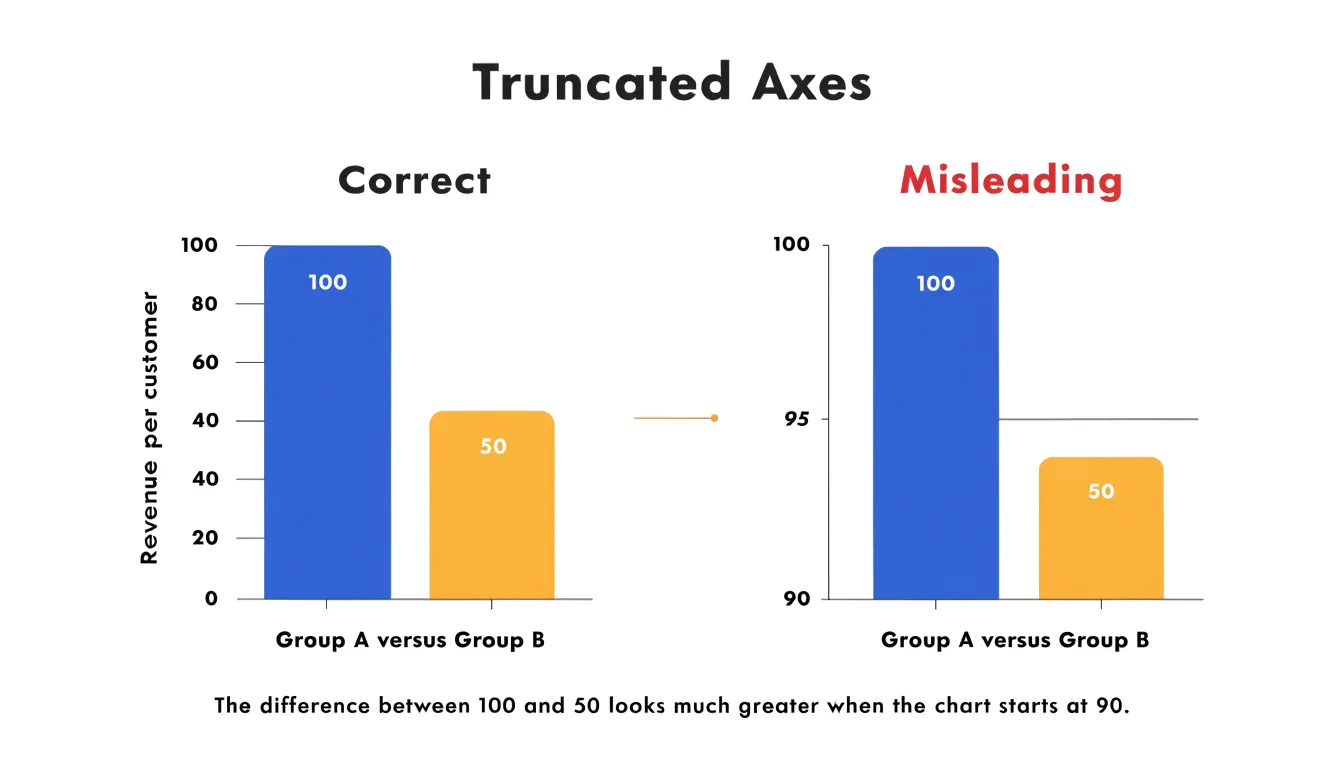
Bar charts encode data through the total visual area and height of each bar, making a zero baseline a requirement for honest representation. The human eye interprets the length of each bar as a direct indicator of magnitude. When a bar chart starts at a non-zero value, the bar lengths no longer correspond proportionally to the data values they represent.
For example, if a bar representing 100 units is compared to one representing 50 units, starting the axis at 90 makes the first bar appear ten times taller than the second, even though the actual difference is only a factor of two. Because bar charts compare discrete categories through length and area, truncating the bars breaks this proportional relationship and exaggerates differences. Best practices therefore require that bar charts always include zero on the value axis.
Line Charts
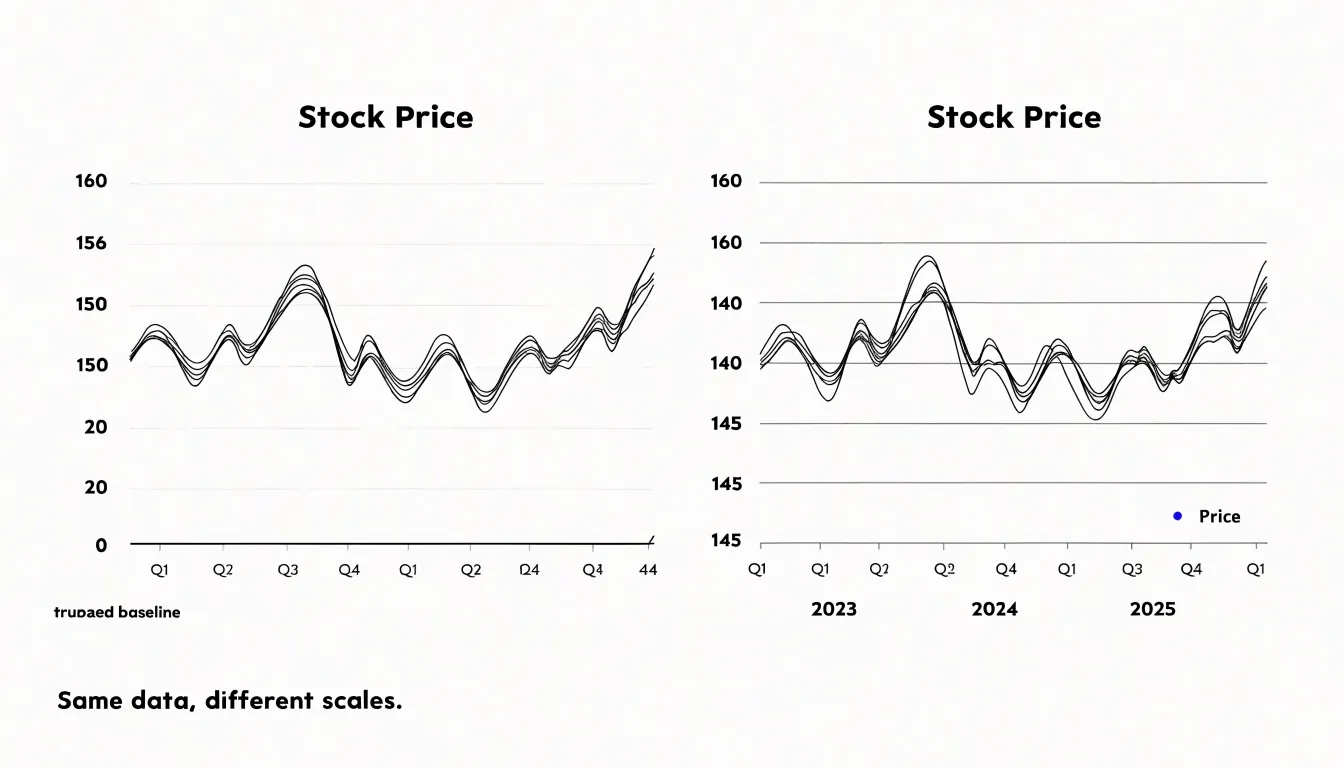
Line charts are suited to continuous data, where the focus is on how values evolve across time or another ordered dimension. Often, the reader’s primary interest lies in the direction and pace of change rather than total magnitude. A stock price moving between 148 and 156 over a quarter, or a temperature reading oscillating within a narrow band, tells its story through the shape of its movement. Narrowing the axis to bracket that range makes the slope legible and reveals subtle turning points. Stretching the range down to zero would compress those fluctuations into a shallow ribbon.
Scenarios that favor a shifted axis tend to share three features:
- The data are measured on an interval scale where the zero point holds no particular significance, such as temperatures in Celsius or index values.
- The series tracks a rate of change, such as monthly percentage growth or daily price movement, where relative shifts matter more than absolute totals.
- The values never approach zero, making the baseline largely irrelevant to interpretation.
When narrowing the vertical range to magnify the signal, the truncated baseline must be obvious. Clear axis labels, visible tick marks, and a note or caption indicating the adjusted scale allow readers to interpret the slopes correctly.
Truncated Axes
Truncated axes appear frequently in reporting on finance, health, and public policy, and their effects are easy to demonstrate:
- Finance: Consider a line chart of quarterly revenue rising from 100 million dollars to 108 million dollars. On a vertical axis from zero to 120 million, the line climbs at a gentle angle, communicating modest improvement. Redrawn with the axis starting at 95 million, the identical numbers sweep upward across the full height of the frame, manufacturing a sense of steep, accelerating growth.
- Political coverage: A poll showing one candidate at 46 percent and another at 44 percent shows two nearly indistinguishable bars on a zero-based axis. On a truncated axis beginning at 40 percent, the two-point gap dominates the graphic and looks like a landslide.
- Health and education: A school district whose graduation rate moves from 81 to 84 percent looks stagnant on a full scale and transformed on a scale running from 80 to 85. A disease rate shifting from 4.1 to 4.4 per hundred thousand can be made to look like an alarming spike.
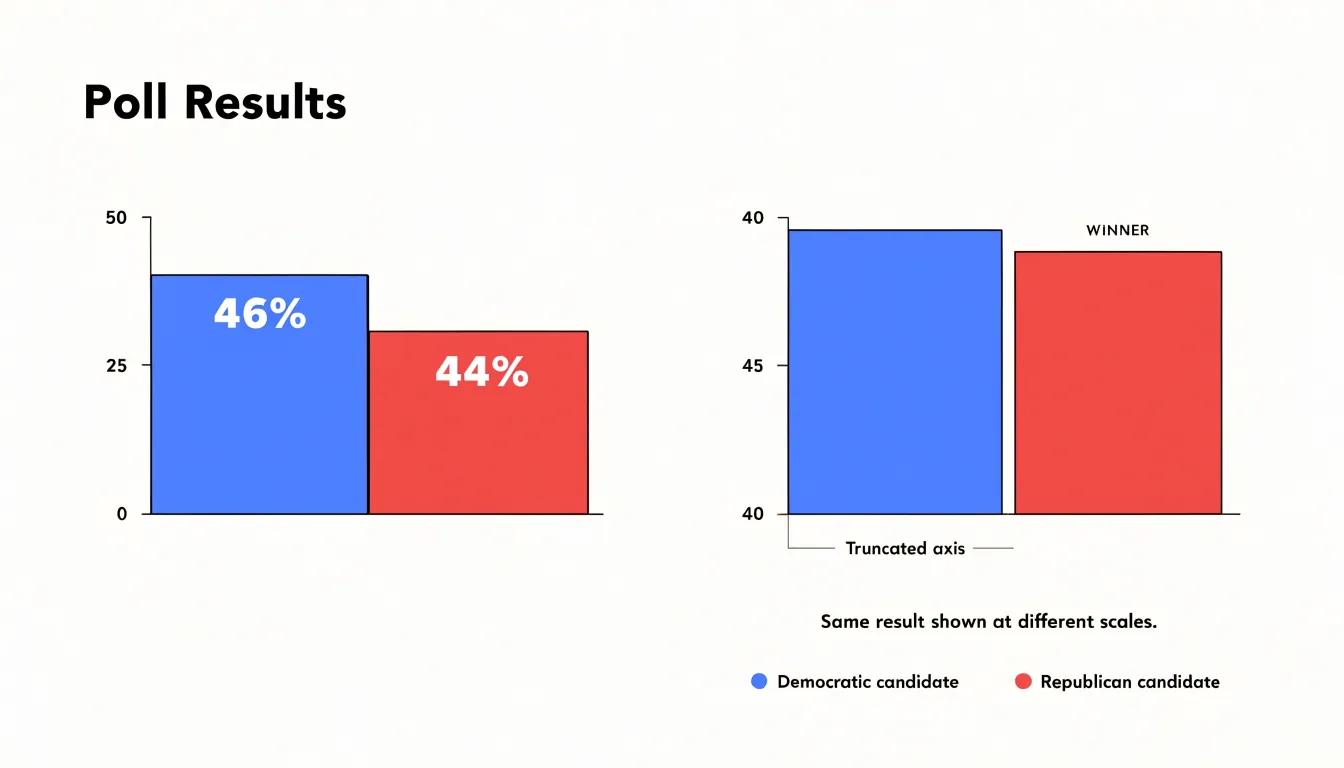
In each case, truncation compresses the baseline and stretches the visible variation. Small absolute changes occupy a large share of the vertical space, so the eye reads them as large relative changes. This effect intensifies when paired with a dramatic headline or a colored trend line. Because readers remember the shape of a line more vividly than the numbers printed beside it, a truncated axis can leave a lasting impression of a trend that the data only weakly supports.
Zoomed Axes
Viewers judge magnitude by the proportion of the chart a change consumes, so narrowing the vertical axis to span only the data range inflates perceived significance. A shift in approval ratings from 51 to 52 percent looks like a surge on an axis running from 50 to 53, whereas a zero-anchored axis shows it as the barely perceptible sliver it actually is.
This effect matters most when the underlying data contains ordinary statistical noise. Survey results, daily stock prices, and temperature readings all wobble naturally from one period to the next. A zoomed axis magnifies that wobble into a jagged narrative of rises and plunges, inviting readers to interpret random variation as a meaningful trend or a looming crisis. Newsrooms and advocacy groups have long exploited this tendency, deliberately or not, because a steep-looking line commands attention and audiences rarely pause to check the tick marks before reacting.
The distortion compounds when zoomed axes are used selectively. If a chart zooms in during one period and out during another, or magnifies unwelcome movements while flattening favorable ones, readers comparing two charts may draw unsupported conclusions about relative volatility. Even an innocent decision to maximize resolution for a specialist audience can mislead a general one, since most viewers bring no mental calibration for how much vertical space a given change ought to occupy.
When to Truncate
Certain domains operate within narrow, specified ranges where a zero baseline would hide every meaningful variation.
- Manufacturing tolerances: A process that must hold a temperature between 68 and 72 degrees Celsius becomes a flat sliver near the top of a zero-based chart. Starting the axis near the lower bound of the specification reveals the wobble, the trend, and the precise moment a reading approaches the tolerance limit, directly answering whether the process stays inside its band.
- High-precision scientific monitoring: Instruments such as seismographs, electrocardiograms, and laboratory sensors record small deviations around a reference value. A seismogram centered on the ambient noise floor shows a faint tremor that a zero baseline would bury. Similarly, analysts reading a heart trace care about waveform shape and timing relative to the resting line, where the distance from zero is physically meaningless.
- Indexes and normalized measures: A price index rebased to 100, a performance score hovering between 40 and 60, a ratio that cannot fall below a threshold, and financial spreads or returns expressed in basis points all carry an established reference point that serves as the meaningful floor.
In these situations, the audience already knows the reference value and the purpose is comparison within a known range. Truncation is legitimate when the axis is clearly labeled, the reference point is stated, and the visual story concerns variation rather than total magnitude.
Small Changes in Large Totals
When a macro indicator sits at a large total—such as national GDP, total employment, or aggregate revenue—operationally important movements can be tiny relative to the base. A quarterly shift of 0.2 percent on a trillion-dollar figure is statistically meaningful and may drive real decisions, yet it is invisible against a zero baseline.
To make small fluctuations legible without implying false volatility, choose the axis based on the analytical question. If the goal is to show rate of change or compare consecutive periods, use a truncated axis with round, interpretable increments. The visible band should comfortably contain normal seasonal and reporting variation so routine noise does not look like a dramatic swing.
Labeling and visual cues keep the context clear:
- State the baseline in the axis title, annotate the percentage change in the chart area, and include absolute figures alongside relative ones.
- Add a short note explaining why the axis is truncated to protect stakeholders who encounter the chart without surrounding narrative.
- Use reference lines for the long-run average, shaded bands for typical variation, and consistent scaling across related charts.
Where a series is genuinely flat, showing the full range with clear percentage annotations can communicate stability more faithfully than a zoomed view.
Relative and Special Scales
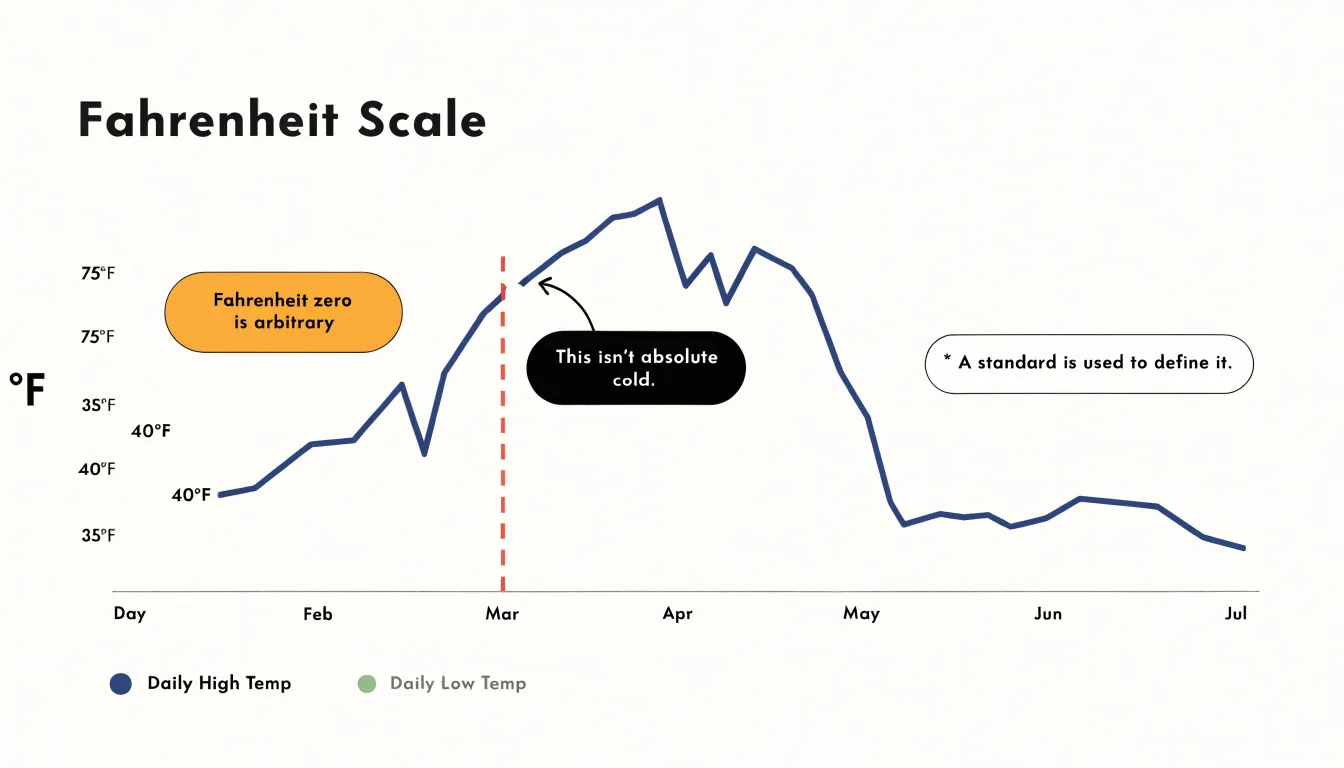
Scales with arbitrary zero points complicate rules about where an axis should begin because zero carries no physical meaning. In Celsius and Fahrenheit, zero was chosen by convention—the freezing point of water in one case, a brine mixture in the other—and neither marks an absence of thermal energy. A reading of 0°F sits inside the range of ordinary weather. A chart of daily temperatures spanning 40°F to 75°F can start at 35°F without distorting the underlying quantity, because there is no true baseline to omit.
Absolute scales behave differently. Kelvin begins at absolute zero, the point at which molecular motion reaches its minimum, so a truncated Kelvin axis hides a meaningful reference.
Index-based economic metrics work like Celsius and Fahrenheit. Normalized indices set an arbitrary base period to 100, or shift a series so a chosen year equals zero. Percentage change series, diffusion indices centered on 50, and z-scores share this property: the origin is a convention expressing change relative to an anchor, not an absence of the measured quantity. A price index chart starting at 95 obscures no natural floor. Where zero is arbitrary, axis bounds should be chosen to reveal variation honestly, with labels making the reference point explicit.
Misleading Graphs
Misleading graphs appear regularly in advertising, investor decks, and news reports. Beyond a truncated baseline—frequently used in product claims to stretch small improvements in battery life, speed, or satisfaction scores into apparent breakthroughs—several other red flags indicate manipulation:
- Inconsistent scaling: Side-by-side charts with different scales, unevenly spaced intervals, or mismatched units invite false comparisons between trends or competing products.
- Shifting intervals and sparse data: Switching from monthly to weekly data partway through a series can create an illusion of acceleration, while a smooth line drawn through sparse, irregular measurements implies reliable growth.
- Missing context: Unlabeled axes and absent time frames allow a chart in an ad or quarterly report to be technically accurate while conveying a false impression.
- Cherry-picked dates: Selecting specific start and end dates can frame a temporary spike or dip as a long-term trend.
- Dual-axis manipulation: Adjusting the two scales independently lets a presenter manufacture apparent correlation between unrelated variables.
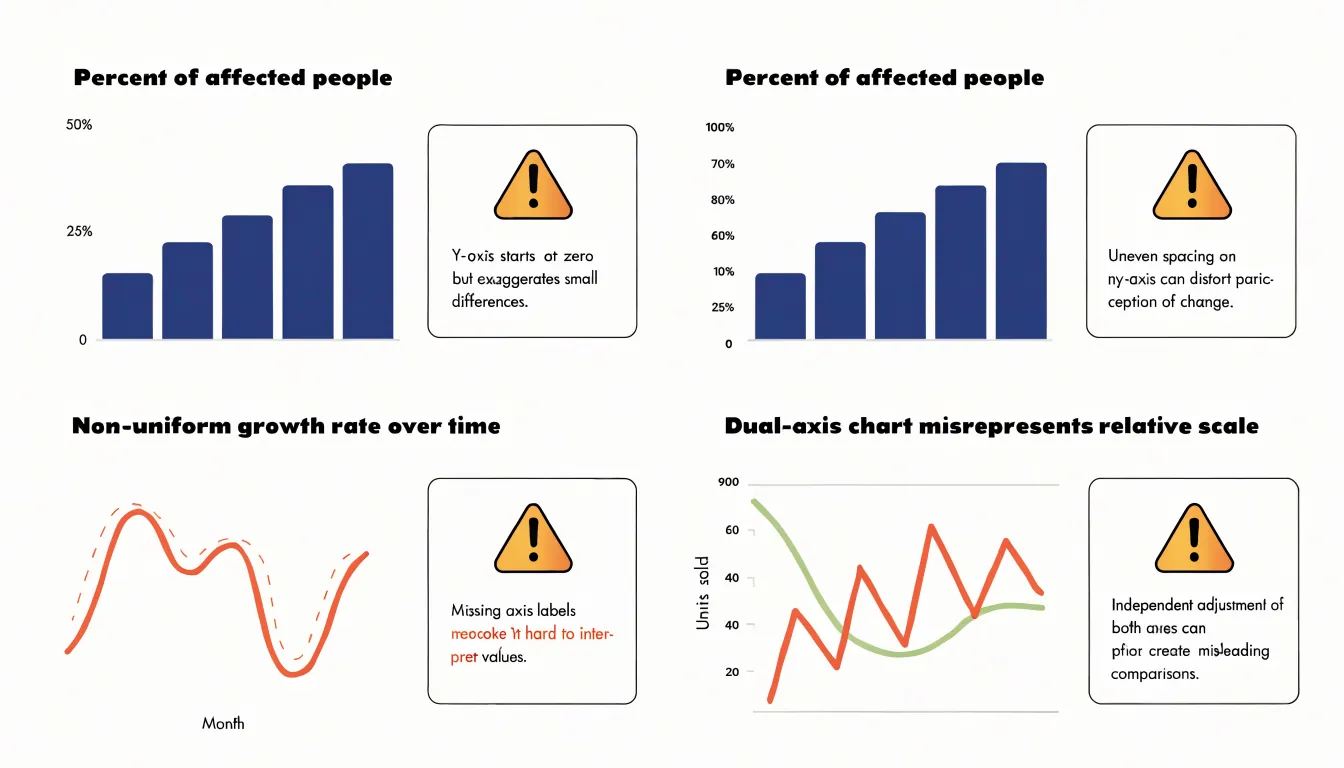
Checking the baseline, intervals, labeling, and time window reveals most of these manipulations.
Consumer Trust
A chart is a public statement of what an organization claims to know. When a visual exaggerates a modest change, readers may not consciously identify the manipulation, yet many sense that something feels off. Transparent practices—starting bar charts at zero, labeling truncated axes on line charts, sourcing data, and explaining methodology in a footnote—protect brand reputation and invite engagement rather than scrutiny.
Long-term trust compounds. An audience accustomed to fair, well-labeled charts from an organization extends the benefit of the doubt when a finding is surprising. Once drained, that goodwill is difficult to rebuild: accusations of deceptive data manipulation spread quickly on social media, and a single screenshot of a misleading axis can define a brand’s reputation for months.
Designing for trust also shapes internal culture. When teams know their charts will be scrutinized by an informed public, they tend to double-check scales, disclose sample sizes, and resist dramatizing marginal results, improving the quality of the underlying analysis.
Axis Labels and Context
Axis labels and context ensure a chart remains readable on its own when shared in screenshots, slide decks, and social feeds where surrounding prose is lost.
- Tick marks: Space ticks at regular, easily readable intervals with consistent decimal precision and units so viewers never have to count gridlines, infer unmarked positions, or mistake 12.5 for 125 or 1,250.
- Scale annotations: State the variable, its units, any transformation applied (such as a logarithmic or indexed scale), and a brief note if the range is truncated.
- Textual callouts: Use a subtitle to name the period covered, population sampled, and data source. Place annotations near notable peaks or troughs to explain a spike as a policy change or a dip as a reporting gap, and use footnotes to flag revisions, provisional estimates, or excluded categories.
Audience Perception
Research on pre-attentive visual processing shows that human vision registers a chart’s silhouette—the relative heights of bars or the steepness of a line—within a fraction of a second, before conscious reading begins. Viewers form an automatic first impression of magnitude from this raw geometry, while axis labels, tick marks, and numeric scales are processed later through deliberate attention.
Because the perceptual system treats drawn sizes as a proportional statement, a truncated axis introduces a distortion that operates below conscious scrutiny. Designers cannot assume readers will adjust their initial impressions once they read the axis labels; first impressions anchor subsequent interpretation, and many readers stop at the visual impression alone.
Accuracy Checklist
A repeatable review routine helps catch scale and context errors before publication:
- Confirm baseline integrity: Open the underlying data and check the axis starting value. Verify that bar chart lengths are proportional to the data table numbers, and record any non-zero line chart minimums in the caption or source note.
- Verify scale proportion: Confirm that equal increments occupy equal physical space, gridlines align with labeled ticks rather than arbitrary pixels, and there are no unmarked broken axes, skipped ranges, or unevenly spaced labels.
- Examine context: Check that the title and axis labels state what is measured, the units, and a complete (un-cropped) time period. Disclose any filters, exclusions, or transformations such as indexing or smoothing, and add a source line with the dataset name and date.
- Conduct a cold review: Ask a colleague unfamiliar with the data to state what the chart shows, compare their reading against the intended message, and keep a short record of the completed checks for future versions.
Dashboard Overview
Executive dashboards must communicate both quickly and truthfully. Designers often favor clean layouts, generous whitespace, and simplified visuals, which can tempt them to truncate axes simply to eliminate empty space at the bottom of a chart.
To keep clean design and accurate proportions aligned, treat the axis scale as a fixed constraint and the styling as the flexible element:
- Set a zero baseline for bar charts as a default and reserve trimmed scales for line charts tracking continuous change.
- When a non-zero axis is appropriate, mark the scale break using small typographic cues, a subtle axis label, or a chart footer note.
- Separate the aesthetic layer from the informational layer by removing decorative gridlines and redundant labels to free up visual space for a properly anchored axis.
Frequently Asked Questions
Should bar charts always start at zero?
Yes. Bar charts encode data through bar length and area, so a zero baseline is required for honest representation; best practices require that bar charts always include zero on the value axis.
When is it acceptable to truncate a line chart’s y-axis?
A line chart can use a shifted axis for continuous data where zero has no particular significance, when tracking a rate of change, or when values never approach zero. When narrowing the range, the truncated baseline must be obvious through clear axis labels, visible tick marks, and a note or caption indicating the adjusted scale.
How can a truncated y-axis mislead people?
It compresses the baseline and stretches the visible variation, so small absolute changes can occupy a large share of the vertical space and look like large relative changes. This can leave readers with a lasting impression of a trend that the data only weakly supports.
How should I label a chart with a truncated axis?
Clearly label the axis, show visible tick marks, and add a note or caption indicating the adjusted scale. You can also state the baseline in the axis title and include absolute figures alongside relative ones.
Do viewers notice when a chart’s axis is truncated?
Human vision registers a chart’s silhouette—such as relative bar heights or line steepness—within a fraction of a second before conscious reading begins. Axis labels and tick marks are processed later, so designers cannot assume readers will adjust their first impression after reading the axis labels.
What are red flags of a misleading graph?
Red flags include inconsistent scaling, shifting intervals or sparse data, missing context, cherry-picked dates, and dual-axis manipulation. Checking the baseline, intervals, labeling, and time window reveals most of these manipulations.
Tony Astor
Tony writes about data visualization and the tools people use to build charts and dashboards. More about Data Illustrator