Sequential vs Diverging Color Scales Explained
 By Tony Astor ·
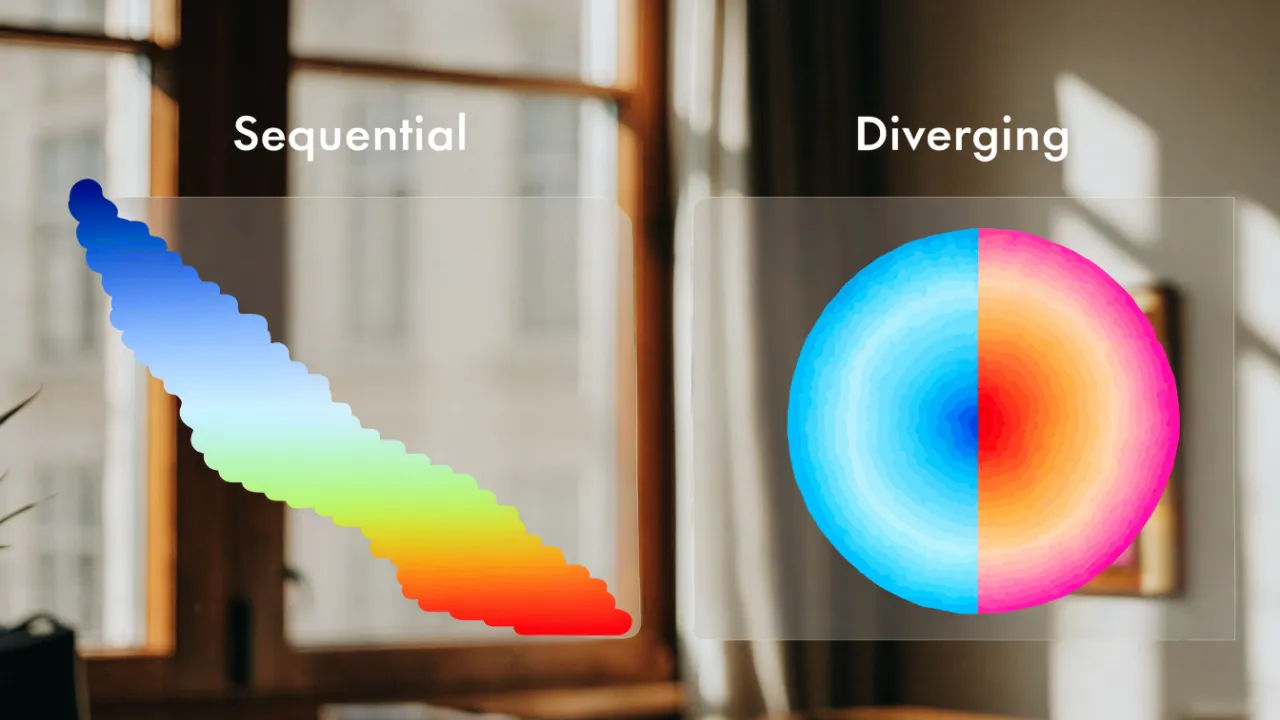
Sequential vs Diverging Color Scales Explained
Sequential color scales encode ordered data from low to high using one hue or closely related hues that vary mainly in lightness, making them ideal for showing magnitude, density, or growth. Diverging scales use two contrasting hues meeting at a neutral midpoint to show polarity around a meaningful baseline, such as zero, a target, or an average.
Table of Contents
- Color Palette Basics
- Sequential Color Scales
- Single Hue Palettes
- Multi Hue Sequential Scales
- Best Uses for Sequential Colors
- Common Sequential Mistakes
- Diverging Color Scales
- The Neutral Midpoint
- Best Uses for Diverging Colors
- Common Diverging Mistakes
- Core Differences Compared
- Accessibility Standards
- Testing Your Visuals
- Final Decision Guide
Color Palette Basics
Color serves as the first layer of interpretation in any chart. A deliberate palette establishes visual hierarchy, guiding the eye toward the values that matter most. When a single metric deserves emphasis, a saturated hue against muted neutrals draws attention without requiring labels or arrows. This directional quality means color selection operates as a form of editorial judgment, deciding what viewers notice first, second, and last.
Readability depends on palettes that respect luminance contrast. Colors that appear distinct on a designer’s monitor may collapse into near-identical gray values when printed or viewed on a dim phone screen. Testing a palette for lightness differences ensures that categories remain separable across devices and for viewers with color vision deficiencies. A palette built on consistent hue spacing and varied lightness carries meaning even when hue perception fails, widening the chart’s audience considerably.
Misinterpretation often begins with color doing unintended work. Implicit conventions, such as red signaling loss or danger and green signaling growth or safety, can inject emotional framing into neutral data. Similarly, gradients that suggest magnitude where none exists may lead viewers to read rank into values that are merely ordered alphabetically. Careful selection keeps color bound to the data dimension it represents, so hue changes track meaningful differences rather than decorative variation.
Attention also depends on restraint. A chart crowded with competing brights forces viewers to scan rather than read, slowing comprehension. Limiting a palette to a dominant accent plus supporting neutrals directs focus efficiently and preserves interpretive clarity.
Sequential Color Scales
Sequential color scales represent ordered quantitative data, where values progress from low to high along a continuous numeric range. These scales use a single hue or a closely related set of hues, varying lightness and saturation in a predictable, stepwise manner. Typically, the lightest and least saturated color corresponds to the lowest value, while the darkest and most saturated color corresponds to the highest value. As the data value increases, the color becomes more intense or darker, allowing viewers to quickly perceive differences in magnitude across a map or chart.
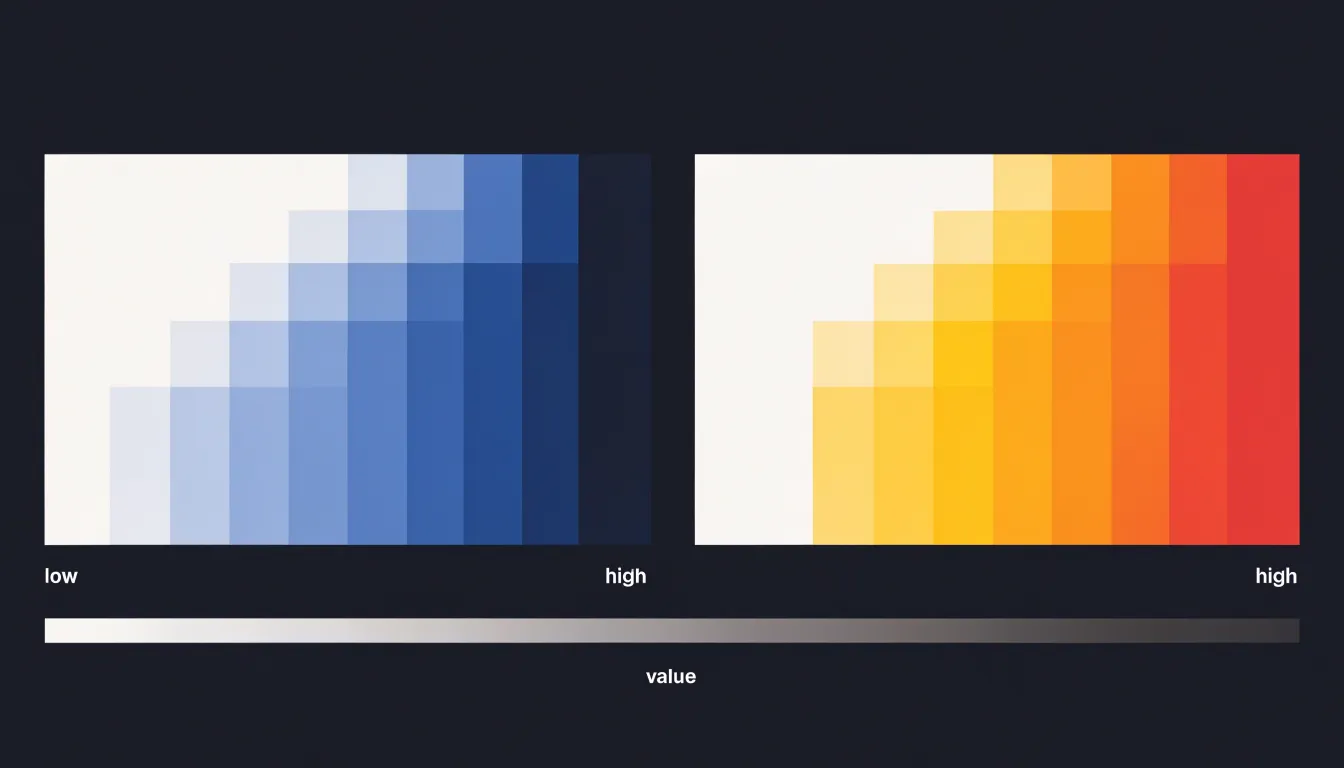
The key characteristic of sequential scales is their monotonic progression. Each step along the scale represents a consistent change in the underlying data, and the visual difference between steps is designed to be perceptually uniform. This means that equal increments in data value produce roughly equal increments in perceived color difference, preventing the visual system from exaggerating or underestimating differences between values. Lightness is the primary channel for encoding data in sequential scales, because the human visual system is highly sensitive to variations in lightness and can reliably order them from light to dark. Saturation is often varied alongside lightness to enhance the distinction between steps, but the dominant cue remains lightness.
Sequential scales can be either single-hue (e.g., light blue to dark blue) or multi-hue (e.g., yellow to orange to dark red). They are widely used in choropleth maps, heatmaps, and any visualization showing how a variable varies across a geographic area or a matrix. By mapping data values to a continuous color ramp, sequential scales enable viewers to perceive patterns, gradients, and outliers at a glance.
Single Hue Palettes
A single hue palette builds an entire scale from variations in lightness and saturation of one base color, moving from pale tints to deep, saturated tones (or the reverse). Because every step shares the same underlying hue, viewers register the scale as a unified whole, which keeps the visual field calm and easy to scan. They also avoid unintended associations with other colors.
This simplicity pays off most when a visual contains many elements or sits alongside other charts on a dashboard. A single hue leaves room for accent colors that highlight what matters most, because the base palette blends into the background rather than competing with annotations, callouts, or secondary data series. Subtle shade transitions also create a natural sense of depth and hierarchy: darker or more saturated steps draw attention, while lighter steps recede, letting a reader follow the progression from low to high without extra effort.
In practice, ensure adjacent shades differ enough in lightness to remain distinguishable, and verify that the lightest steps still hold up against the background color.
Multi Hue Sequential Scales
Multi hue sequential scales extend a single hue ramp by shifting across neighboring hues as values move through the range. A typical example moves from light yellow through orange into deep red, or from pale blue through teal into dark green. The core purpose of this hue shift is to keep perceptual steps clearly distinguishable when the data range is wide and requires many distinct levels, or to accommodate certain data distributions.
When a sequential scale relies on lightness alone within one hue, available contrast is limited. At the dark end, additional steps become hard to separate because the color has little room left to darken. At the light end, steps toward white crowd together and lose definition. A multi hue scale sidesteps this crowding by using hue as a second dimension of variation. As lightness changes, hue changes too, so each step differs from its neighbor along two perceptual channels rather than one. This gives viewers a stronger sense of distance traveled between values.
The hue shift also helps readers judge how far a value sits from a baseline or threshold. A scale that moves through neighboring hues creates a natural sense of direction, with warmer or cooler territory marking meaningful zones along the way. Gradual transitions keep the ordering intuitive, because neighboring hues on the color wheel feel closely related while still offering visible contrast.
Designers should keep the hue path short and controlled. Moving across too many hues risks implying categories, and abrupt hue jumps can create false boundaries in the data. A tight path of two or three adjacent hues, paired with a steady lightness gradient, preserves the sequential reading while delivering step clarity.
Best Uses for Sequential Colors
Sequential color scales work best when showing growth and density along a single continuum, where the question is simply how much or how many:
- Population heatmaps: A map shaded from pale yellow to deep red lets viewers see at once which regions are sparsely settled and which are crowded, with the darkest areas drawing attention to the highest concentrations.
- Revenue growth charts: A gradient that intensifies as figures climb communicates upward momentum and lets strong quarters stand out visually against weaker ones.
- Sales volume maps: Darker or more saturated tones mark territories with the heaviest activity while lighter tones recede into the background.
- Temperature and income ranges: Continuous progressions across regions or time periods map intensity of value directly to intensity of color.
Designers should match the ramp to the metric’s meaning, using darker tones for higher values when the goal is to emphasize peaks.
Common Sequential Mistakes
One of the most frequent problems with sequential color scales is that mid-range values lose their distinction and collapse into a muddy band of similar-looking shades. This usually happens for two connected reasons: uneven perceptual spacing and insufficient lightness contrast between adjacent steps. When a scale is built by interpolating between endpoints in a naive color space, steps that look evenly spaced in numeric terms turn out to be unevenly spaced to the human eye. Several middle values end up sitting almost on top of one another, making it hard to tell which category or data value a given shade represents.
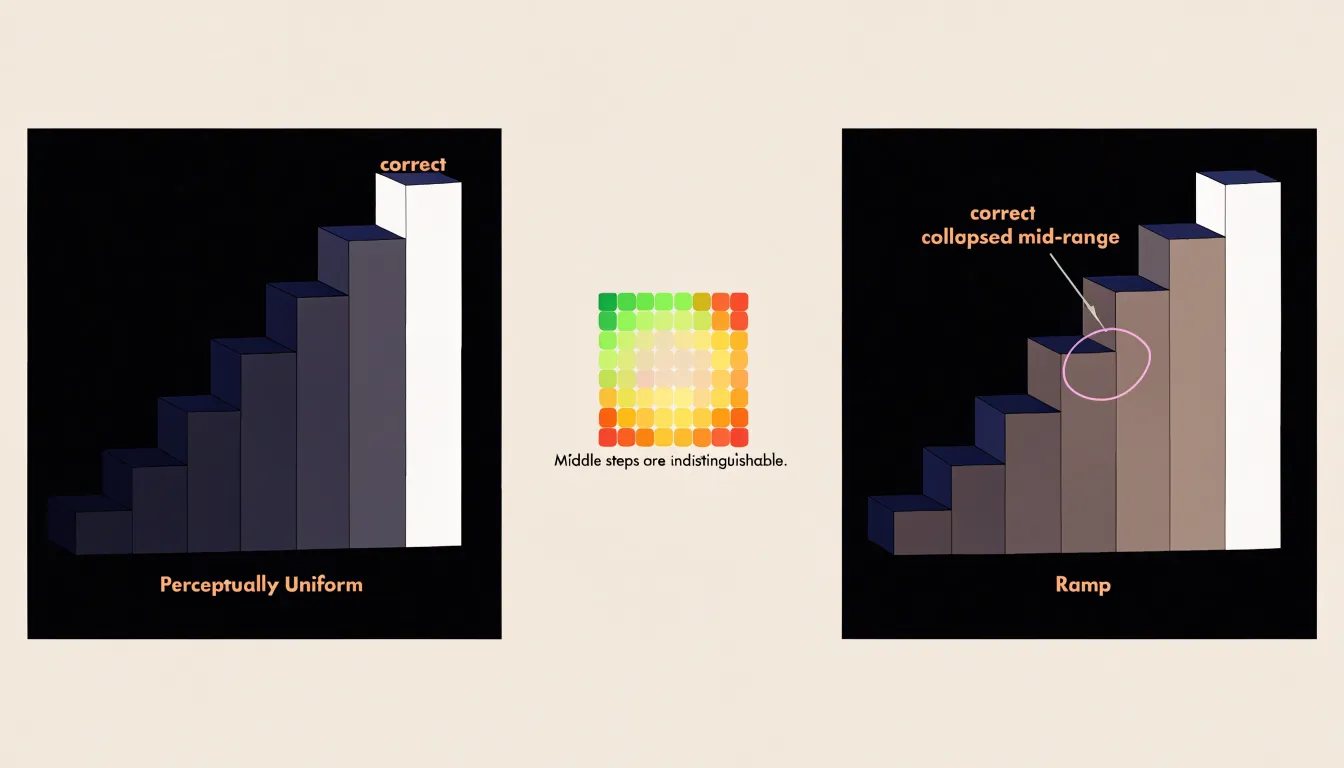
If the lightness difference between neighboring steps in the middle of the scale is too small, those steps will blur together, especially in small marks, thin lines, or dense maps. Two midtones that differ only slightly in lightness can look identical at a glance, forcing readers to squint or consult a legend repeatedly.
Muddy midtones can also arise when the interpolation path passes through desaturated or grayish territory, producing intermediate shades that lack both hue clarity and lightness separation. The fix is to design the scale in a perceptually uniform space, check each step for a consistent lightness increment, and verify the scale at the actual sizes and densities it will be used.
Diverging Color Scales
Diverging color scales use two distinct hues that meet at a neutral midpoint, creating a visual structure that mirrors the data’s relationship to a critical baseline. One hue extends toward one extreme, the other toward the opposite extreme, and the midpoint is rendered in a muted, low-saturation tone that serves as the visual anchor.
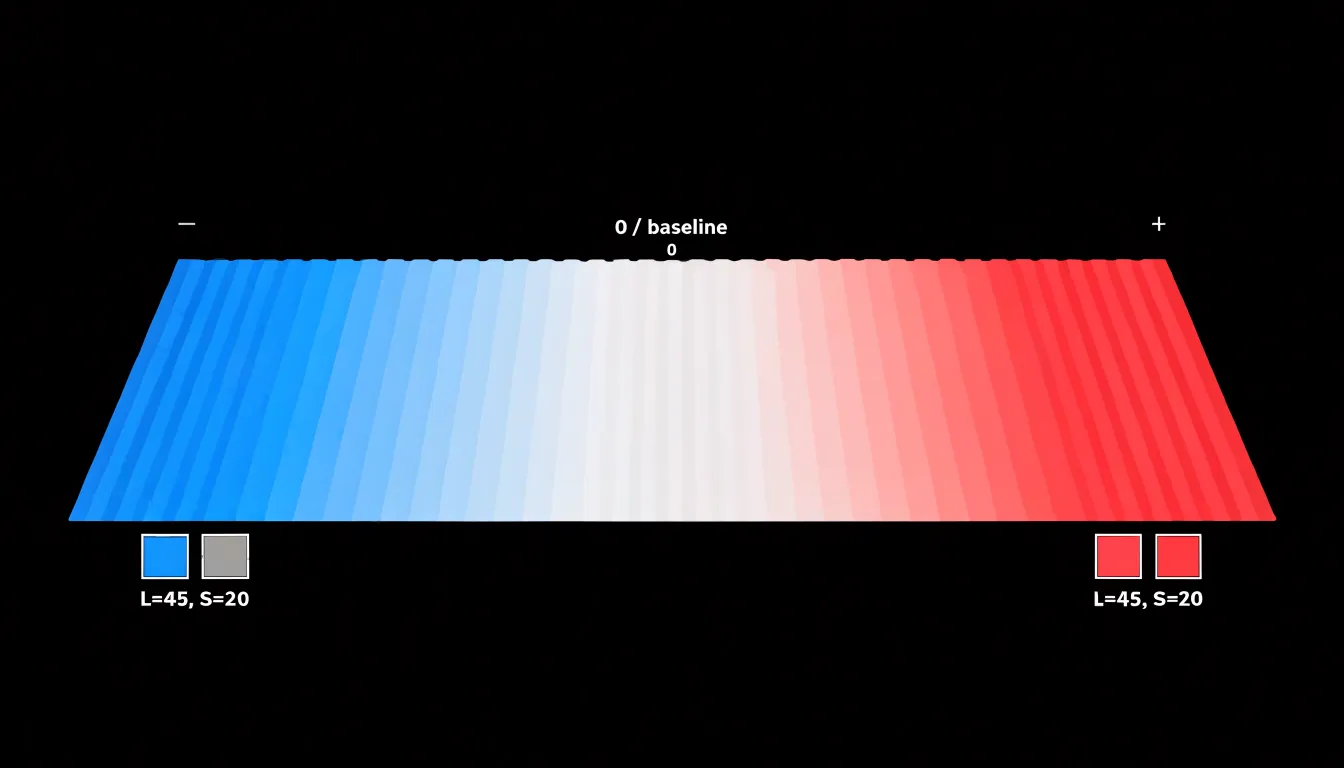
This dual-hue construction draws immediate focus to both poles simultaneously: the eye registers the two saturated ends as equally important reference points, while the neutral center recedes to indicate the baseline or zero value. The result is a palette that communicates polarity before any individual value is read.
The strength of a diverging scale lies in its ability to foreground meaningful contrast—the tension between above and below, profit and loss, or increase and decrease—while treating the midpoint as a reference rather than a value of interest. Designers choose the two endpoint hues to be perceptually balanced in lightness and saturation so that neither pole dominates. By keeping the midpoint light and the endpoints equally vivid, diverging scales enable quick, accurate judgments about direction and magnitude relative to the baseline, making them ideal for datasets where the sign of the deviation matters as much as its size.
The Neutral Midpoint
Selecting a desaturated grey or light off-white central value establishes the diverging scale’s anchor without introducing visual bias. A truly neutral midpoint ensures that the transition between the two arms of the scale is smooth and that neither side appears more prominent.
Desaturated grey is a common choice because it carries no inherent hue, making it ideal for representing a zero point or baseline condition. Light off-white values also work well, particularly when the background is white, as they create a subtle contrast that defines the midpoint without drawing attention. Avoid any tint that might imply a leaning toward one end of the scale; for instance, a midpoint with a slight blue tint could make the cooler end seem more connected to the center, skewing perception.
In practice, the neutral midpoint should match the lightness progression of the surrounding colors. If the endpoints are dark and saturated, the midpoint should be light and desaturated to create a clear visual hierarchy. A consistent neutral midpoint also provides a reliable reference across multiple charts, making cross-chart comparisons easier.
Best Uses for Diverging Colors
Diverging color scales are at their best when the story in the data lives at the edges of a spectrum around a meaningful center, such as a natural zero, target, benchmark, or historical norm:
- Election results: A map shaded from saturated blue through a neutral midpoint to saturated red instantly communicates which candidate or party leads in each district, while shade intensity shows the margin of victory. Closely contested areas sit tucked in the pale middle.
- Temperature anomaly maps: By anchoring a neutral color at a historical baseline (zero anomaly) and diverging toward deep red (positive departures) and deep blue (negative departures), climatologists show where a given month or year ran hotter or colder than normal.
- Financial dashboards: Profit-and-loss views or budget deviation charts place zero or the target at the midpoint so gains shade in one direction and losses in the other, letting managers scan a grid of regions, products, or quarters and spot underperforming segments without reading a single number.
- Survey results: Scales running from strongly agree to strongly disagree around a neutral response naturally map to opposing hues.
In each case, the eye is drawn naturally to the strongest saturations, so outliers, extremes, and shifts from surplus to deficit announce themselves while the neutral middle quietly identifies cases near the baseline.
Common Diverging Mistakes
Because a diverging scale exists to make a meaningful threshold unmistakable, losing that midpoint is a primary failure mode. Oversaturating the center is one common way to lose it: a bright yellow or vivid white at the midpoint can bloom against surrounding colors, especially on projectors or low-quality displays, so the neutral value reads as an active highlight. Viewers then treat the center as a peak rather than a reference point, and the data’s true pivot disappears into a glow. Equally damaging is a center that is too dark or too close in luminance to one arm of the scale, which makes the midpoint merge with one side and leaves the threshold ambiguous.
Asymmetric color pairs create a related distortion. When one arm is markedly darker, more saturated, or more attention-grabbing than the other, the chart implies that one direction matters more. A deep red against a pale blue makes every negative value shout while positive values whisper, even when the underlying magnitudes are symmetric. The central threshold then appears to sit closer to the quieter arm, shifting where viewers perceive the boundary between categories and compressing or exaggerating one side of the data.
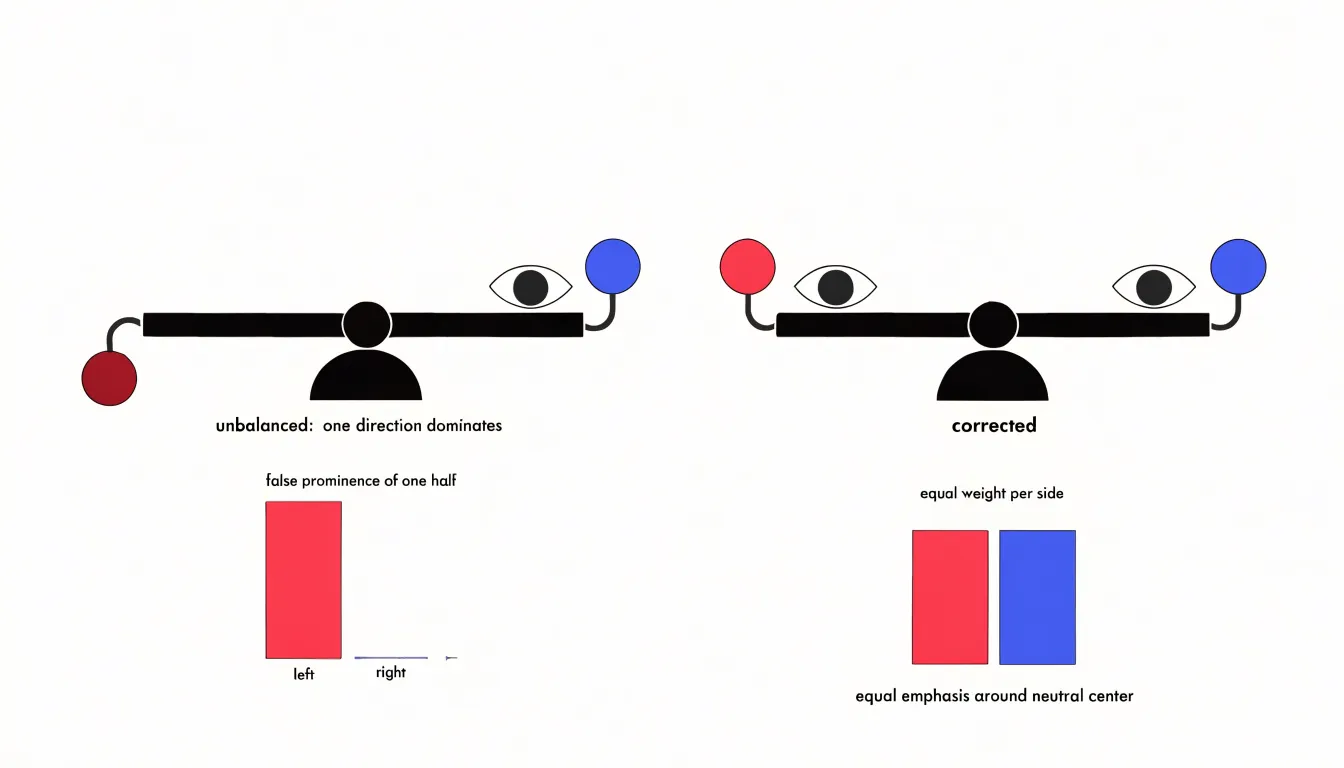
These pitfalls compound when a strong hue at the midpoint is combined with unbalanced arms: the critical value is hidden, the two directions are not comparable, and the threshold drifts. Keep the center visually quiet and balance the two arms in lightness and chroma so neither side dominates.
Core Differences Compared
Sequential scales encode continuous order, supporting ranking and accumulation. They tolerate uneven distributions well when paired with sensible class breaks, since the lightness ramp preserves ordering even where values cluster at one end. Diverging scales encode a dual-polar balance around a meaningful midpoint, supporting polarity and departure.
Aligning palette selection with data distribution means asking whether values have a substantive center. A diverging scale applied to data lacking a natural midpoint forces viewers to infer a reference that is not there, while a sequential scale applied to signed data hides the directional contrast the viewer needs. Choosing well means reading the spread of your values before choosing the ramp, then testing whether the legend communicates the intended comparison at a glance.
Accessibility Standards
The Web Content Accessibility Guidelines (WCAG) provide a foundation for readable palettes, requiring a contrast ratio of at least 4.5:1 for normal text and 3:1 for large text and graphical elements. For color scales, adjacent colors must maintain sufficient lightness difference to be distinguishable.
Color vision deficiency (CVD) affects approximately 8% of men and 0.5% of women, making it essential to avoid problematic combinations such as red-green or blue-yellow contrasts that can merge for those with deuteranopia or protanopia. Instead, designers can use colorblind-safe palettes like viridis or cividis, which vary monotonically in lightness and use hues that remain distinct across common types of CVD.
Relying on multiple channels—lightness, saturation, and hue—redundantly encodes information, making the scale more robust. Tools like Color Oracle or Sim Daltonism can simulate CVD to verify palette choices, while testing with real users, including those with visual impairments, provides the ultimate validation.
Testing Your Visuals
Practical validation of a palette begins with stripping color away and observing what remains:
- Grayscale conversion: Using an image editor filter, a design tool’s desaturation command, or built-in library accessibility checkers reveals whether lightness differences alone carry the encoded meaning. A sequential scale should read as a smooth ramp from light to dark; a diverging scale should show two distinguishable arms meeting at a clearly lighter or darker midpoint. When neighboring steps collapse into the same gray, the palette needs adjustment.
- Print previews: Office printers, projection systems, and PDF exports often reproduce hues differently than an on-screen design. Reviewing a test print on plain paper, ideally in both color and black and white, catches saturation shifts and ink coverage problems early.
- Screen brightness testing: View the visualization at maximum brightness, dim it to roughly half, and examine it under strong ambient light as if on a phone outdoors. Low brightness tends to compress darker steps together, while high brightness can wash out pale tints. Test across a laptop screen, an external monitor, and a mobile device.
A short checklist keeps the process manageable: confirm that each step stays distinct in grayscale, that the midpoint of a diverging scheme remains identifiable, that labels and gridlines stay legible against every fill, and that the overall shape of the data reads clearly at reduced brightness.
Final Decision Guide
To choose between sequential and diverging scales, walk through two questions:
- Does the data have a critical, meaningful midpoint (such as zero, an average, or a target)? If not—or if zero simply serves as a starting baseline for values moving in one direction—choose a sequential scale.
- If a midpoint exists, does the direction of deviation from it matter for your narrative? If your story hinges on distinguishing above versus below or positive versus negative, choose a diverging scale. If the midpoint is arbitrary or the deviations are not the focus, a sequential scale may still suffice.
By matching the scale to your analytical goal—sequential for ranking and magnitude, diverging for polarity and deviation—you ensure your visualizations support the exact comparisons you want your audience to make.
Frequently Asked Questions
What is the difference between sequential and diverging color scales?
Sequential scales encode ordered quantitative data along a continuous low-to-high range using a single hue or closely related hues, while diverging scales use two distinct hues that meet at a neutral midpoint to show polarity around a baseline. Sequential scales support ranking and magnitude; diverging scales support above/below or positive/negative contrast.
When should I use a sequential color scale?
Use a sequential scale when the data do not have a critical, meaningful midpoint, or when zero is just a starting baseline for values moving in one direction. They work well for showing growth, density, and magnitude along a single continuum.
Why use a multi-hue sequential scale instead of a single-hue one?
A multi-hue scale adds hue as a second dimension of variation, helping keep perceptual steps distinguishable when the data range is wide or requires many distinct levels. It can also help readers judge how far a value sits from a baseline or threshold while preserving sequential order.
What are common mistakes with diverging color scales?
Oversaturating the midpoint or making it too dark or close in luminance to one arm can make the baseline read as a highlight or merge with one side. Asymmetric color pairs can also make one direction of deviation dominate and shift where viewers perceive the threshold.
Why do mid-range values blur together in sequential scales?
Mid-range values can collapse into a muddy band because of uneven perceptual spacing and insufficient lightness contrast between adjacent steps, often from naive interpolation or paths through desaturated or grayish territory. The fix is to design in a perceptually uniform space and check each step for a consistent lightness increment.
How can I make and test an accessible color scale?
Follow WCAG contrast ratios—at least 4.5:1 for normal text and 3:1 for large text and graphical elements—and keep enough lightness difference between adjacent colors. Avoid problematic red-green or blue-yellow combinations, consider colorblind-safe palettes like viridis or cividis, and test with grayscale conversion, print previews, and different screen brightness levels.
Tony Astor
Tony writes about data visualization and the tools people use to build charts and dashboards. More about Data Illustrator