Sankey Diagram: How to Visualize Flows (With Examples)
 By Tony Astor ·

Sankey Diagram
A Sankey diagram is a flow chart that shows how quantities such as energy, money, or materials move through a system. Nodes represent stages, links are drawn as curved bands, and each band’s width is scaled in proportion to its flow value, so the total is conserved from inputs to outputs.
Table of Contents
Sankey Diagram
Flow diagrams map the movement of quantities—such as energy, materials, money, or time—through a system. They represent directional processes where inputs enter, undergo transformations, and exit as outputs. The fundamental principle is conservation: the total quantity remains constant across all stages, even as it splits, merges, or changes form.
Sankey diagrams excel at showing this conservation by scaling the width of arrows in direct proportion to flow magnitudes. A typical diagram begins with input flows on the left, which branch into sub-flows, pass through intermediate stages representing processes or transformations, and finally converge into output flows on the right. Because the visual area is directly comparable across the diagram, viewers can instantly grasp the relative sizes of different flows and identify where losses or gains occur.
For example, in an energy system diagram, fuel input splits into useful energy and waste heat, with the width of each arrow showing its respective share. Because the sum of flows entering a stage equals the sum leaving it, total quantities are preserved. By following paths from input to output, readers can trace how materials are transformed and where inefficiencies lie, making Sankey diagrams invaluable for quantitative analysis across engineering, economics, and operations.
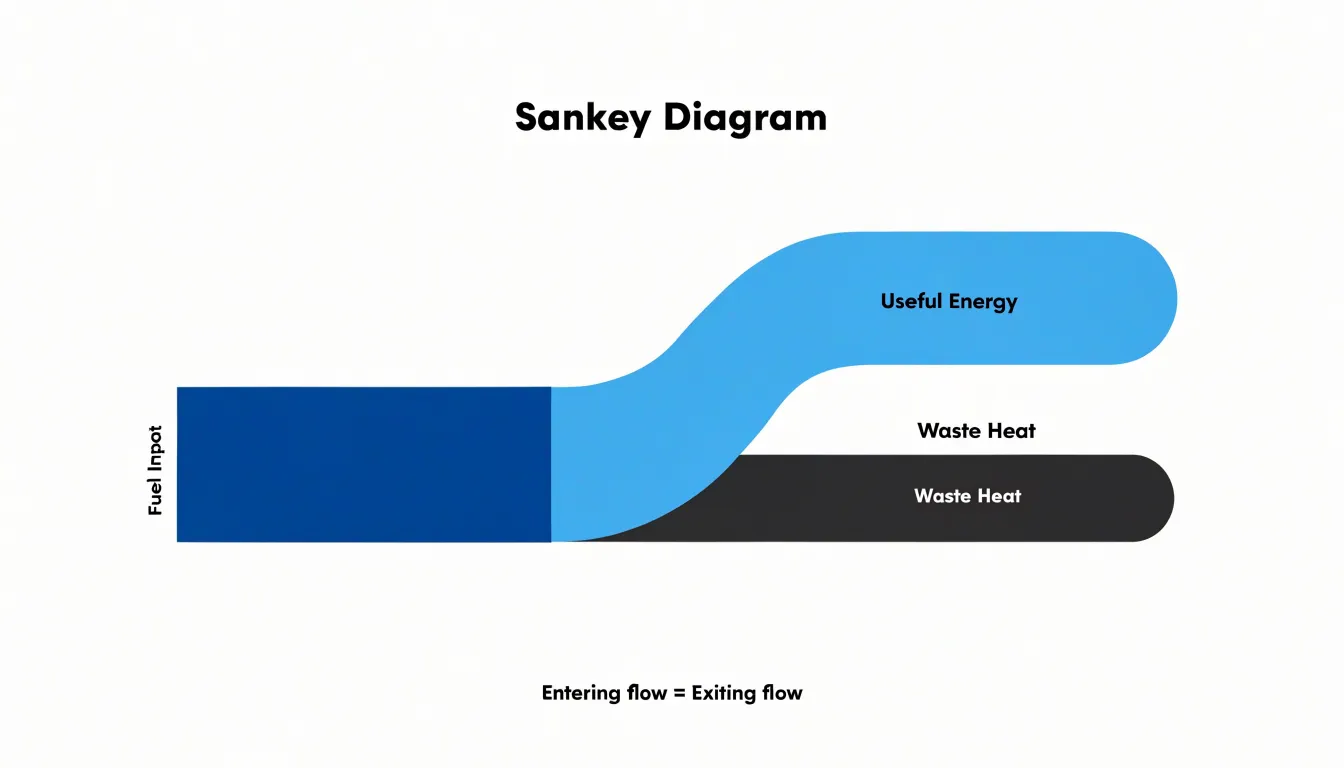
Sankey Diagram
A Sankey diagram communicates movement and quantity through three structural components: nodes, links, and flow widths.
- Nodes represent the entities or stages in a system, such as departments, processes, sources, or destinations. They typically appear as vertical bars or rectangular blocks positioned along the horizontal axis, marking where flows enter, pause, or exit. Each node acts as a checkpoint, giving viewers clear anchor points for reading the diagram.
- Links are the pathways that connect nodes, drawn as curved bands sweeping from one node to the next. A link may run between adjacent nodes in a simple process, or stretch across a wide span to represent a transfer over distance or time. The direction of travel is usually implied by the left-to-right layout, allowing viewers to follow the progression from origin to outcome.
- Flow widths are the defining feature of the chart. The thickness of each link is drawn in proportion to the magnitude of the flow it represents, so a link carrying twice as much volume appears twice as wide. Node height ordinarily matches the total of the flows entering or leaving it, keeping the diagram visually consistent.
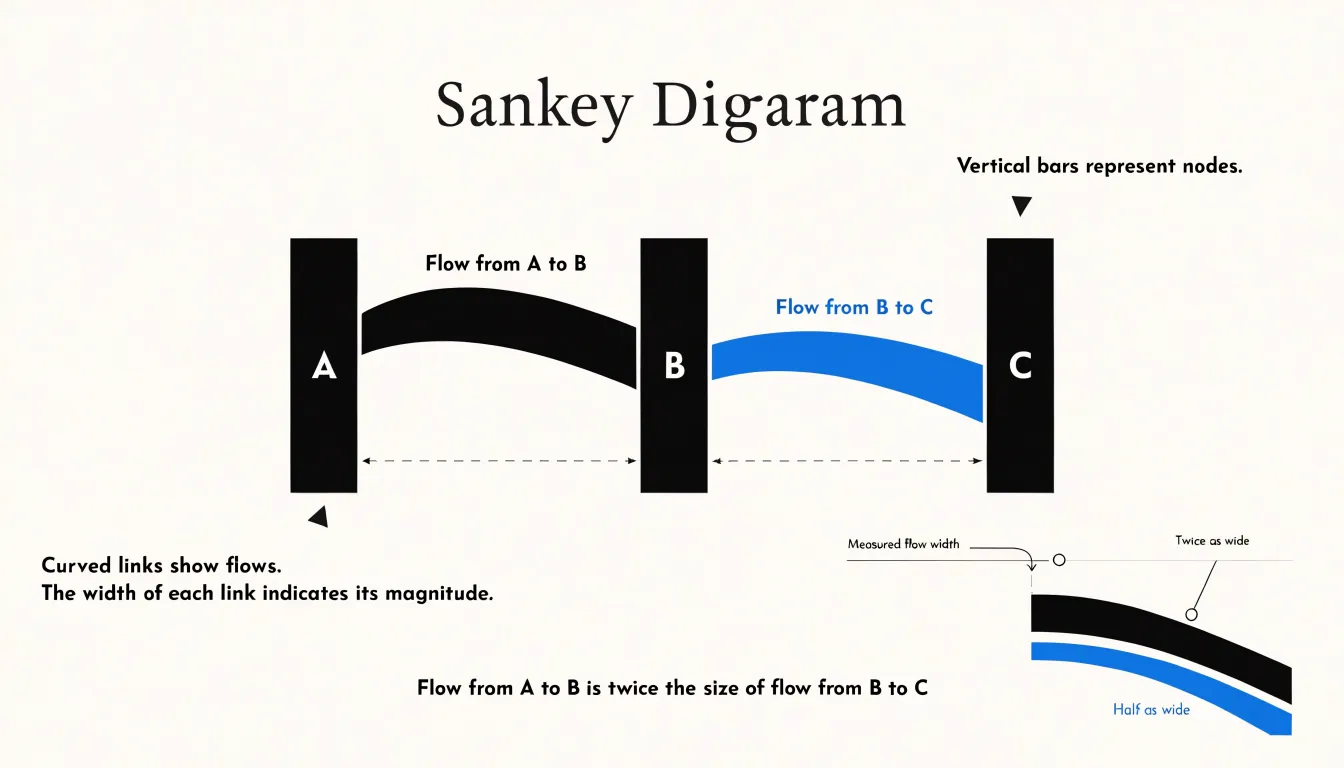
This proportional scaling lets readers compare the largest streams against smaller ones at a glance without consulting a legend or table. When flows split or merge at a node, the widths of the branches add up to the width of the parent flow, preserving the arithmetic integrity of the visual. Together, these three elements turn abstract quantities into a single picture where volume, direction, and connection are all visible at once.
Sankey Diagram
In power grids, Sankey diagrams trace energy from its original source through a series of transformations to the end user. These charts begin on the left with primary energy inputs such as coal, natural gas, nuclear fuel, wind, solar, and hydro. As the diagram progresses to the right, the bands branch and merge, showing how raw fuels are routed into power plants and how electricity is generated from renewable resources.
The middle portion of the diagram captures conversion losses, a critical feature for understanding real-world energy systems. When a power plant burns fuel to produce electricity, a substantial portion of the original energy is dissipated as waste heat. Sankey diagrams render these losses as downward branches that taper away from the main flow, making the magnitude of inefficiency immediately visible. Transmission and distribution losses across the grid are represented in a similar way, showing how energy diminishes between generation and delivery.
On the right side, the remaining energy arrives at final end-user consumption, typically divided into residential, commercial, industrial, and transportation sectors. Industrial facilities use the same approach to audit their own operations, mapping steam, process heat, electricity, and waste streams to identify opportunities for efficiency improvements. By presenting generation, conversion losses, and consumption in a single image, the diagram turns abstract energy statistics into a clear map of where power originates and how it is spent.
Sankey Diagram
In web analytics, Sankey diagrams map how visitors move through a website. Every page, campaign source, or event becomes a node, and the transitions between them become ribbons whose thickness corresponds to the number of users taking that path. Analysts use this layout to trace the actual routes visitors follow from landing pages through intermediate steps toward a goal, revealing patterns that tables of pageviews or bounce rates cannot easily show.
One common strategy is to begin with an entry-point view, grouping traffic by acquisition channel and splitting it across landing pages. This exposes which sources feed which sections of the site and where initial interest begins to fragment. Another strategy focuses on drop-off points: by following the ribbons forward through a defined session, places where wide bands suddenly narrow immediately highlight where users abandon the journey. This helps teams spot problematic pages, confusing forms, or unexpected exits without hunting through segmented reports.
Conversion funnels benefit from the same treatment. The diagram shows the full population entering the funnel and the shrinking proportion that proceeds through cart, checkout, and confirmation stages, along with the side paths users take before leaving. Because multi-step sessions across devices and return visits add complexity, practitioners often limit the scope to a single session window or a defined sequence of events to keep the chart readable. Filtering to the most significant flows turns the diagram into a diagnostic instrument for navigation behavior, showing stakeholders exactly where attention and revenue are won or lost.
Sankey Diagram
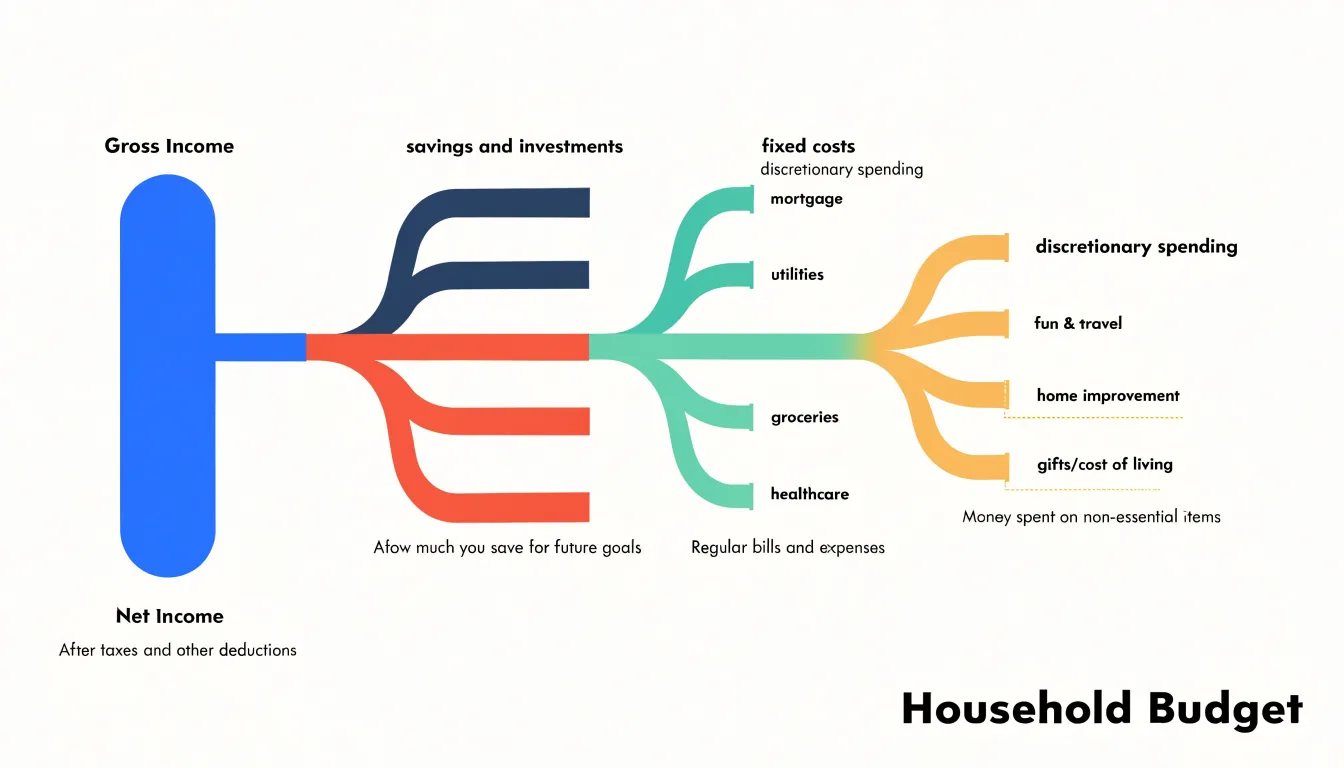
Applied to household finances, a Sankey diagram maps how gross income flows outward into the destinations that shape a family’s financial life. The diagram begins with a single thick band on the left representing total gross income, which splits into progressively narrower pathways as money is allocated:
- Taxes: The first major branch typically covers federal and state income tax, payroll deductions such as Social Security and Medicare, and local levies. Because these amounts are often withheld automatically, the diagram highlights the substantial portion of earnings that never reaches a household’s spendable balance.
- Savings and investments: From the remaining net income, another branch flows toward emergency funds, retirement contributions, and other reserve accounts, isolating the share of income devoted to future security rather than present consumption.
- Fixed costs: These branches encompass rent or mortgage payments, utilities, insurance premiums, loan repayments, and subscription services. Because these obligations stay stable month to month, they appear as consistent, predictable flows.
- Discretionary spending: The final pathways cover groceries, dining, transportation, entertainment, clothing, and other variable expenses. These bands often branch into many smaller streams, reflecting the wide variety of choices in day-to-day spending.
Viewed together, the diagram reveals at a glance whether fixed obligations consume a disproportionate share of income, how much is directed toward savings, and where discretionary funds concentrate. For anyone seeking to understand or restructure a budget, this format clarifies the cumulative effect of individual financial decisions.
Sankey Diagram
For logistics managers, a Sankey diagram provides a unified view of the supply chain, from raw material sourcing to final retail delivery. It traces how materials move through each stage: from factories and manufacturing plants, through distribution hubs, and finally into stores.
Managers can follow a specific product’s route, identify where flows merge or split, and see the relative volume moving along each path. For example, a wide band from a supplier to a factory indicates a high volume of incoming materials, while narrower bands branching out to different distribution centers show how that volume is divided.
This visual tracing helps pinpoint bottlenecks, such as a constricted flow at a particular hub, or inefficiencies like underutilized routes. By consolidating sourcing, manufacturing, distribution, and retail channels into one view, logistics managers can compare alternative routes and make informed decisions about resource allocation.
Sankey Diagram
On a manufacturing production line, Sankey diagrams locate inefficiency by scaling flows to material mass, energy, or cost, making losses visible as thick branches peeling away from the main process stream. A plant engineer can map raw material inputs to a product family, following each stream from receiving through machining, forming, and assembly to finished goods. Any widening band that diverts toward a waste or rework channel highlights where scrap material is accumulating. Tracking scrap by process step—rather than as a single factory-wide total—lets teams attribute losses to specific machines, shifts, or batches for targeted corrective action.
The same rendering exposes process bottlenecks. When upstream stages feed a downstream station whose throughput is constrained, the diagram shows material pooling or queue flows that dwarf the productive stream. Plotting throughput over time alongside the Sankey layout clarifies whether the constraint sits in a single operation or results from mismatched capacity across several steps. Decision-makers can then prioritize debottlenecking investments where the diagram shows the largest blocked or bypassed flows.
Energy analysis follows a parallel logic. Mapping steam, compressed air, and electrical inputs through the plant reveals heat losses as branches escaping at furnaces, ovens, or distribution networks. A wide exhaust or radiation band signals a recovery opportunity, such as heat exchangers or insulation upgrades, while thin, scattered losses indicate maintenance issues like leaking compressed-air lines. Quantifying each leak in common units converts scattered observations into a ranked list of savings. Regular updates to the model allow continuous monitoring of scrap rates, bottleneck migration, and energy performance as production conditions change.
Sankey Diagram
Corporate sustainability teams rely on Sankey diagrams to consolidate greenhouse gas emissions data that would otherwise remain scattered across spreadsheets. Emissions accounting is naturally a system of flows: energy and materials enter a value chain, pass through conversion and transport stages, and leave as waste or dissipated heat. A Sankey diagram can place all three emissions scopes on a single canvas, beginning with raw material extraction on the left and terminating with disposal or recycling on the right:
- Scope 1: Emissions from sources the company owns or controls, such as on-site fuel combustion and company vehicles.
- Scope 2: Emissions from purchased electricity, steam, heating, and cooling.
- Scope 3: Emissions across the upstream and downstream value chain, including purchased goods and services, business travel, employee commuting, logistics, product use, and end-of-life disposal.
With each stage sized according to its contribution, a sustainability manager can quickly see whether the dominant impact sits in purchased materials, distribution, or the use phase of sold products. Because the diagram is quantitative, it supports prioritization: teams can model interventions by narrowing a band and observing how the overall flow shifts. In external reporting, the immediate visual impression of a wide band dwarfing its neighbors often conveys more to stakeholders than pages of tabulated figures.
Sankey Diagram
Because a Sankey diagram is only as accurate as the data feeding it, preparing a clean tabular dataset is essential. Follow these steps to structure your data for automated tools:
- Define and label every node: Identify each entity that appears as a source or a target and assign it a unique, consistent label. Avoid synonyms or abbreviations that could split a single node into fragments.
- Create a three-column table: Structure your dataset with columns for
source,target, andvalue. Each row represents a directed flow from one node to another, and thevaluecolumn holds the numerical quantity (such as megawatts, dollars, or material units). - Standardize node names: Ensure every source and target entry exactly matches one of your defined node labels. Even a stray space or capitalization difference will cause software to render separate, disconnected nodes.
- Format branching and merging flows: Create separate rows for each source-target pair. For flows that split into multiple targets, use multiple rows with the same source.
- Verify positive values and units: Record all values as positive numbers, and include a unit column or header note to clarify what the numbers represent.
- Check flow conservation: Verify that the sum of outgoing flows from any node equals the sum of incoming flows, unless your diagram intentionally shows losses or gains.
- Handle missing data: Replace missing or null values with zeros or remove the rows entirely, depending on whether the absence represents zero flow or unrecorded data.
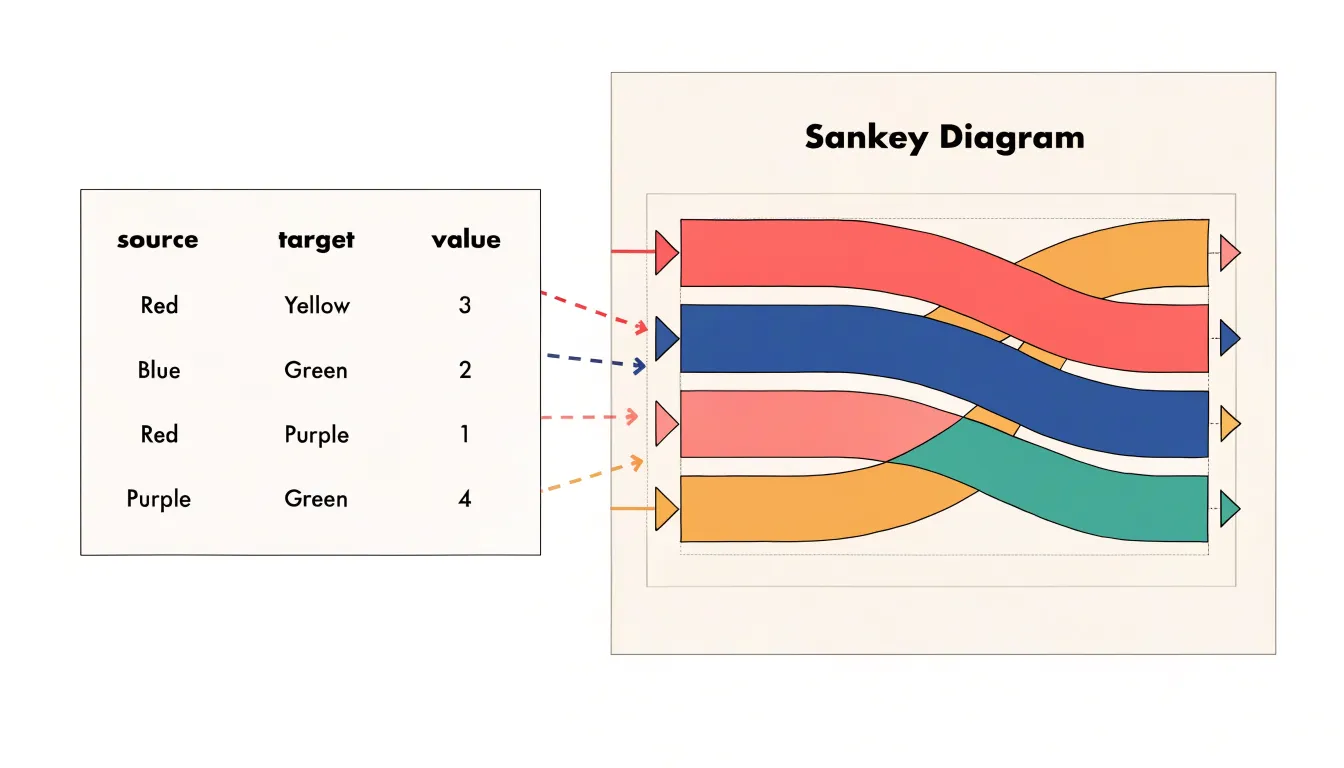
With this source-target-value structure, charting tools can parse the relationships directly, compute node positions, and update the diagram automatically when underlying figures change.
Sankey Diagram
Color is a primary tool for organizing a Sankey diagram, helping viewers trace pathways and distinguish between different types of nodes and links.
One common strategy is to assign colors based on the origin or destination of flows. Using a consistent hue for all bands originating from a single input allows viewers to follow that source’s contribution through the entire system. Alternatively, colors can denote distinct categories—such as departments, regions, or greenhouse gas scopes—where all nodes and links associated with a category share the same hue. To separate inputs from outputs, designers sometimes assign cooler colors (blues and greens) to inputs and warmer colors (reds and oranges) to outputs, providing an intuitive cue for directionality.
Regardless of the strategy, apply these rules to keep the palette effective:
- Limit the number of hues: Too many colors overwhelm the viewer and dilute the groupings. Use a distinct color for each major category, then rely on shades or tints within that hue to show subcategories.
- Maintain contrast: Ensure sufficient contrast between adjacent colors and the background to preserve legibility, especially where semi-transparent links overlap.
- Design for accessibility: Test palettes to ensure viewers with color vision deficiencies can distinguish the categories.
Sankey Diagram
A Sankey diagram’s legibility depends heavily on how nodes are ordered and how links are routed between them. Poor layout choices create long diagonal crossings that turn the chart into a tangled web.
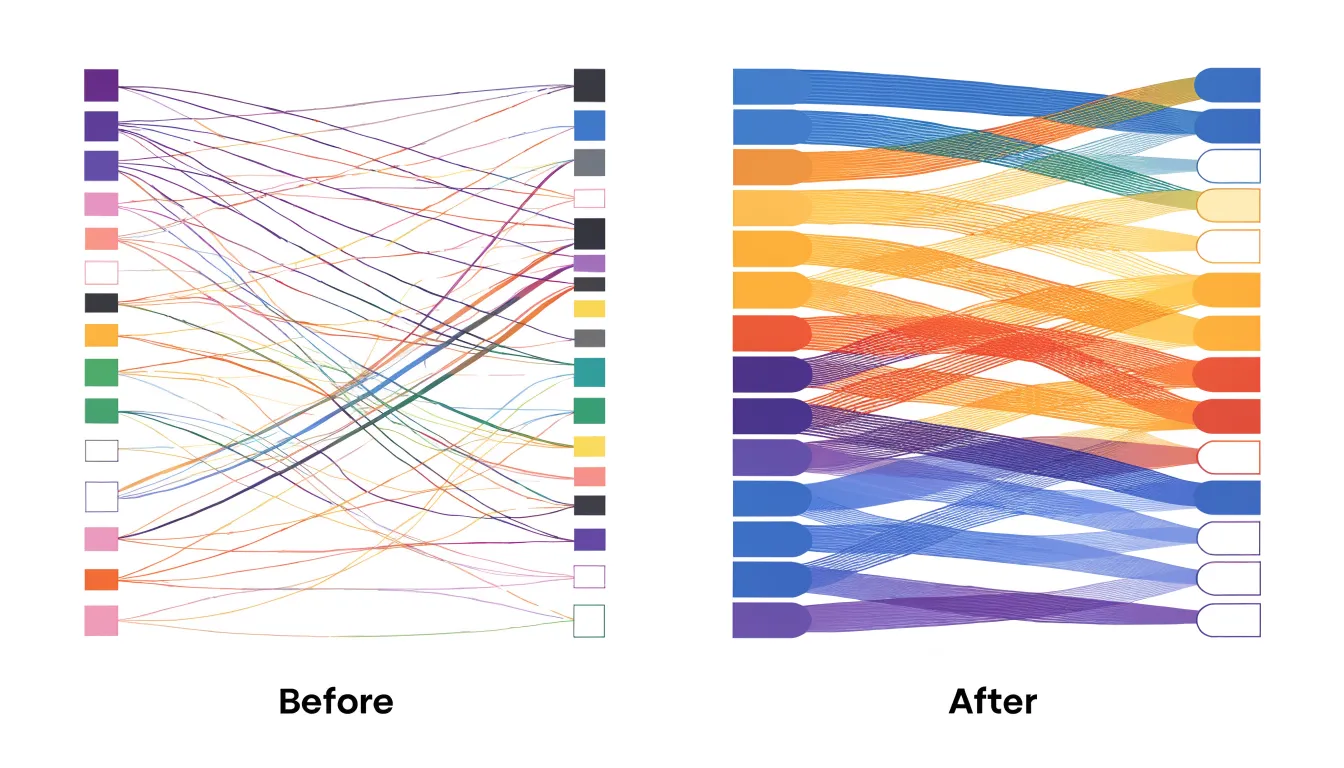
Start by positioning nodes according to their role. Place major sources along the left edge and terminal sinks along the right edge, then order intermediate nodes by the volume or direction of the flows passing through them. Nodes with the largest total throughput often work best near the vertical center of the diagram, while smaller nodes can sit toward the top or bottom. Grouping nodes that share upstream or downstream connections reduces the need for links to travel across the entire canvas.
Within each node, use consistent link stacking. Order outgoing links to match the vertical position of their destination nodes, and order incoming links to match their sources. This alignment keeps flows roughly parallel as they leave and enter nodes, so bands rarely need to weave past one another. Sorting links by volume within each node also helps, keeping large bands in predictable lanes while thin bands fill the gaps.
Finally, manage whitespace and stage depth. Adding vertical padding between nodes gives links room to bend and separate without merging into an unreadable mass. Limiting the number of nodes in any single column—and using fewer columns with well-chosen intermediate stages rather than fragmenting flows across many columns—further reduces congestion. Iterate on node order at the intended display size to spot and resolve any remaining crossings.
Sankey Diagram
Several common design mistakes can undermine the accuracy and readability of a Sankey diagram:
- Disproportionate or inconsistent scaling: Drawing a band thicker or thinner than its value warrants, or using different width-to-value ratios across different branches, destroys visual comparisons. Keep all flow widths strictly proportional to their quantities across the entire chart.
- Missing or sparse labels: Omitting labels for nodes, units, or values forces the audience to guess what the bands represent. Labeling only totals while leaving individual flows unlabeled makes it impossible to read specific contributions. Label every significant node and flow clearly.
- Unit inconsistencies: Mixing percentages, currency, and physical quantities in one diagram without explicit conversion turns the visual into a puzzle. Convert all flows to a single, consistent unit of measurement before plotting.
- Overly complex branching: Trying to display dozens of sources, intermediate stages, and sinks at once causes bands to cross repeatedly and thin out into unreadable hairlines. Conversely, merging too many tiny flows into a single band without explanation can misrepresent the underlying data. Limit stage depth and branch count, and group minor values into an explicit “Other” category.
- Misaligned nodes: Inconsistent vertical placement of nodes between stages creates unnecessary link crossings that imply non-existent relationships. Align connected nodes horizontally wherever possible.
Sankey Diagram
Pie charts and Sankey diagrams both show how a total is divided, but they serve different analytical purposes. A pie chart divides a single total into proportional slices, working well when the goal is to show how a whole breaks down at a single moment in time. However, it has no mechanism for showing where quantities originate, how they travel, or where they end up after passing through intermediate stages. It captures a static snapshot, omitting the sequence of events.
A Sankey diagram preserves the pathway of each quantity from source through intermediate processing to final destination. A reader can follow a single flow across multiple stages and observe how its width shrinks or splits along the way, revealing inefficiencies or redistributions that a pie chart cannot display.
Multi-stage sequential relationships—such as energy balances, budget allocations, and supply chains—therefore require the Sankey format. In these systems, the essential insight lies in the transitions rather than the totals. Squeezing such data into pie charts forces the analyst to flatten the sequence into a separate chart for each stage, leaving the reader to reconstruct the connections mentally. The Sankey diagram keeps those connections integrated in a single geometry.
Sankey Diagram
Sankey diagrams are a staple in executive dashboards, and several software options exist to build them depending on your organization’s technical stack:
- Tableau: Supports Sankey diagrams through dashboard extensions and calculated fields, enabling interactive flows that integrate with other dashboard elements.
- Power BI: Offers Sankey visuals via custom add-ins from its marketplace, supporting dynamic filtering and cross-highlighting. Both Tableau and Power BI suit self-service environments that rely on existing enterprise data connections and governance structures.
- D3.js: A JavaScript library that gives developers full control over layout, styling, and interactivity. It is best suited for custom web-based dashboards requiring unique branding or complex user interactions.
- Python (Plotly and HoloViews): These libraries offer a middle ground, allowing data scientists to generate Sankey diagrams programmatically and embed them into web applications using frameworks like Dash or Streamlit.
When selecting a tool for executive dashboards, weigh your need for automated data refreshes, user interactivity, and long-term maintenance against the technical skills of your team.
Frequently Asked Questions
What is a Sankey diagram used for?
A Sankey diagram maps the movement of quantities such as energy, materials, money, or time through a system. It uses arrow widths scaled in proportion to flow magnitudes so viewers can compare flows and see where losses or gains occur.
What are the main parts of a Sankey diagram?
The three structural components are nodes, links, and flow widths. Nodes represent entities or stages, links are pathways connecting nodes, and link thickness is drawn in proportion to the magnitude of the flow.
How do Sankey diagrams show energy losses in power grids?
They trace energy from primary inputs through transformations to end users, with conversion losses shown as downward branches that taper away from the main flow. Transmission and distribution losses are represented similarly between generation and delivery.
How are Sankey diagrams used in web analytics?
In web analytics, pages, campaign sources, or events become nodes, and transitions between them become ribbons whose thickness corresponds to the number of users taking that path. Analysts use them to trace visitor routes, spot drop-off points, and examine conversion funnels.
How can a Sankey diagram help with household finances?
A household finance Sankey diagram begins with gross income and splits it into taxes, savings and investments, fixed costs, and discretionary spending. It can show whether fixed obligations consume a disproportionate share of income, how much is directed toward savings, and where discretionary funds concentrate.
What data structure is needed to build a Sankey diagram?
Use a three-column table with source, target, and value, where each row represents a directed flow from one node to another. Node names should be consistent, values should be positive, units should be clear, and outgoing flows should equal incoming flows unless losses or gains are intentionally shown.
Tony Astor
Tony writes about data visualization and the tools people use to build charts and dashboards. More about Data Illustrator