Radial Bar Chart: When Circular Bars Make Sense
 By Tony Astor ·
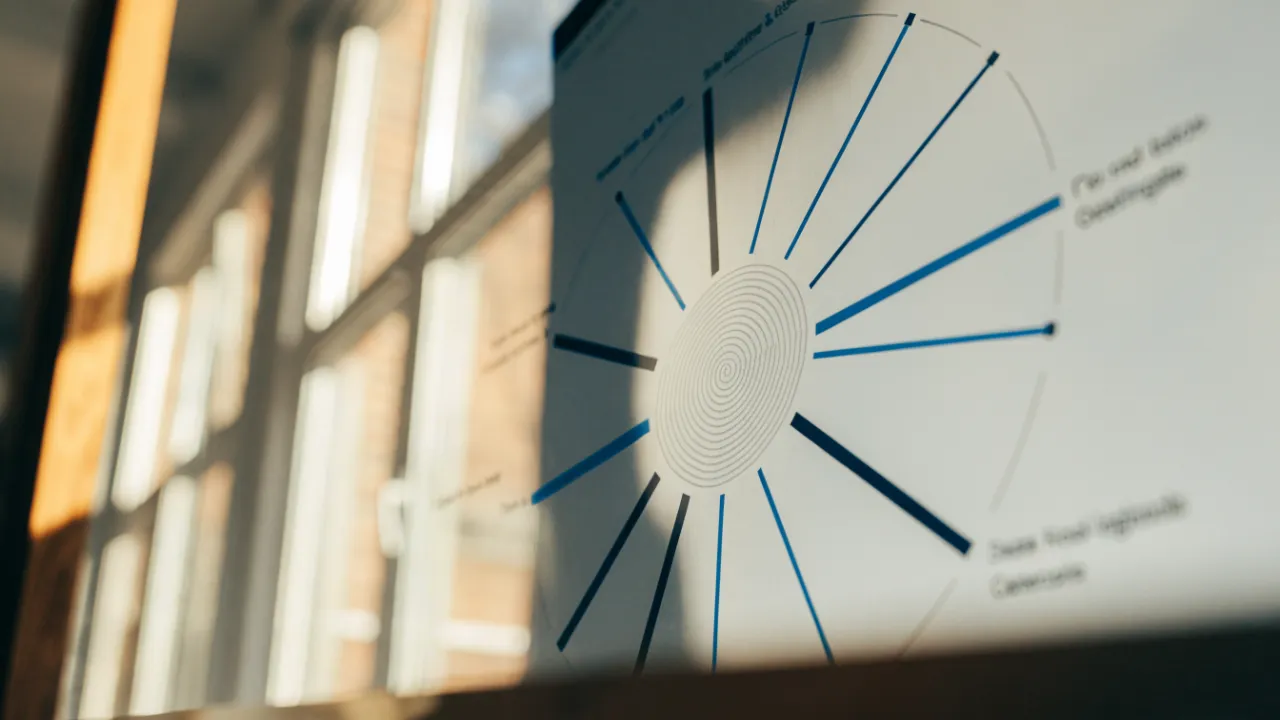
Radial Bar Chart
A radial bar chart displays bars along concentric circular arcs that sweep from a fixed start angle to show progress toward a goal, with a full ring indicating completion. Each ring represents one metric on a 0–100% scale, letting viewers judge percentage completion at a glance and pack multiple goals into a compact square footprint.
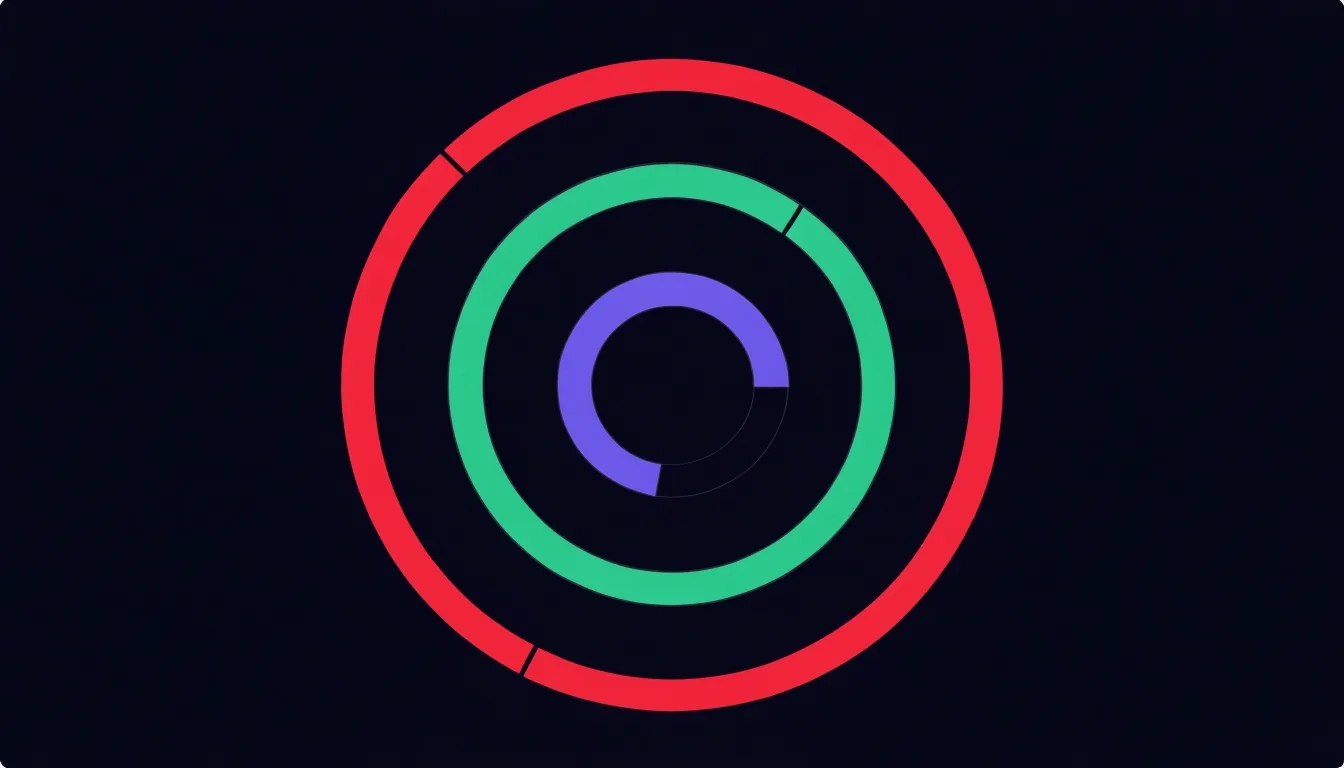
Table of Contents
Radial Bar Chart
A radial bar chart arranges its bars along circular paths, a geometry that suits showing progress toward a goal with a naturalness straight bars rarely match. Each goal receives its own ring, drawn as a concentric arc that sweeps around a common center. The arc begins at a fixed starting angle, usually at the top or at the three o’clock position, and extends clockwise until it reaches the current completion level. A ring that closes into a full circle signals a finished goal, while a partial arc leaves an obvious gap that the eye reads instantly as remaining work. This is the same visual language popularized by fitness tracking rings, where movement, exercise, and standing goals each occupy their own band, and years of exposure to that convention have made the format widely legible without any explanation.
The strength of the form lies in how quickly percentage completion can be judged. A viewer does not need to read axis labels or compare bar lengths across a baseline; the proportion of the circle that is filled communicates attainment directly. Multiple concentric rings pack several related goals into a compact, roughly square footprint, so an entire dashboard of targets can be surveyed in a single glance. Color can separate the rings or shift as a goal passes thresholds, and a faint background track behind each arc shows the full extent of the goal so that even a small value remains anchored to its maximum.
Because the rings share a center and a scale of 0 to 100 percent, comparing progress across goals feels immediate. The format works well for individual scorecards, habit trackers, and any context where the primary question is how far along each target has traveled rather than how raw values compare against one another.
Radial Bar Chart
In another variation of the radial bar chart, each bar radiates outward from a central point, and its angular position corresponds to a point in a repeating cycle. This layout naturally accommodates data that loops, such as hours in a day, months in a year, or seasons in a year. For example, a 24-hour daily routine can be mapped so that each hour occupies a 15-degree slice, with bar lengths representing activity levels or energy usage. Similarly, monthly budgets can be displayed with 12 bars arranged around the circle, each bar showing spending for that month. Seasonal trends, like temperature or rainfall, also fit well because the circular axis emphasizes the recurring nature of the pattern.
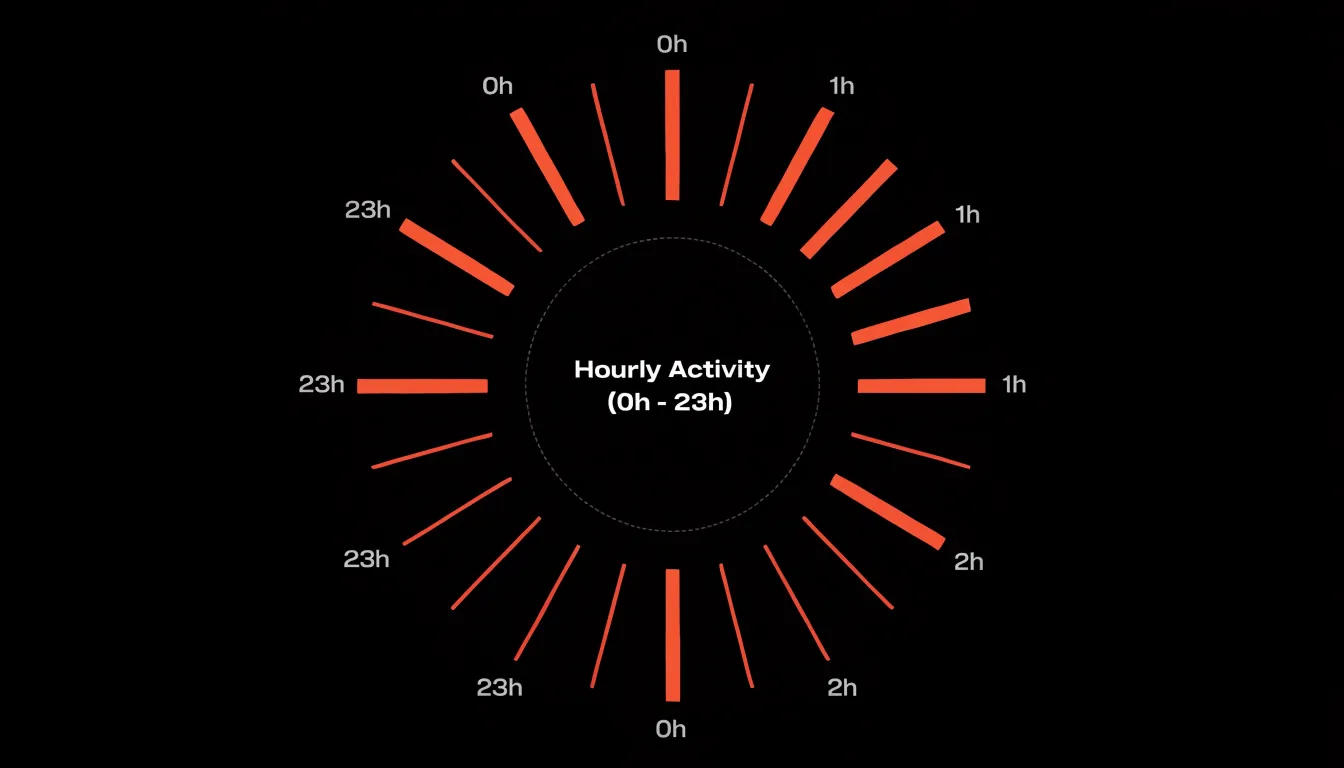
The continuous circular axis helps viewers perceive cyclical continuity: the end of one cycle connects seamlessly to the beginning of the next. This design leverages the natural human ability to recognize patterns in circular layouts, making it easier to spot peaks, troughs, and periodicities. When choosing this layout, ensure the data truly cycles; otherwise, the circular arrangement may confuse. For cyclical data, the radial bar chart offers a compact and intuitive way to reveal rhythms and repetitions that might be less obvious in a linear chart.
Radial Bar Chart
When comparing multiple categories in a concentric radial bar chart, the arrangement of rings and the sorting of categories play a critical role in how quickly viewers can extract meaning. By sorting the rings in a logical order—typically from largest to smallest arc length—you create a visual hierarchy that guides the eye toward the top performers. This ordering leverages the natural tendency to scan from the outer edge inward or from top to bottom, making it easy to spot the highest values at a glance. Without sorting, the chart becomes a jumble of varying arc lengths, forcing users to compare each ring individually and slowing down insight discovery.
Because humans are better at comparing lengths than angles or areas, ensuring that arc lengths are proportional to the data values is essential. When rings are sorted, the progression of arc lengths creates a smooth gradient from the most to least significant category, reinforcing the ranking. This is especially useful when the number of categories is large, as it provides an immediate sense of distribution and outliers. For example, in a customer satisfaction survey across multiple service channels, sorting the rings by satisfaction score allows stakeholders to instantly identify which channels are performing best and which need attention.
The combination of sorted rings and consistent arc length encoding supports rapid comparison, highlights top performers, and reduces cognitive load, enabling users to focus on decision-making rather than decoding the visualization.
Radial Bar Chart
Dashboard designers often face the challenge of presenting numerous key performance indicators within limited screen real estate. Unlike traditional horizontal or vertical bar charts that extend linearly and demand width or height proportional to the number of categories, radial bars wrap around a central point, allowing many metrics to be displayed in a single, space-efficient graphic. This makes radial bar charts particularly well-suited for dashboards where multiple KPIs must be visible at a glance without scrolling or switching views.
When bars radiate outward as slices, the circular layout naturally accommodates a larger number of categories. As the number of metrics grows, the chart can simply add more slices around the circle, maintaining a consistent overall size. This density is achieved without overwhelming the user interface because the circular form provides a clear visual boundary and a familiar shape that users can quickly scan. The eye can follow the arc of each bar, comparing lengths around the circle, while the central area remains open for summary text or a key figure. This efficient use of space ensures that even dense dashboards remain readable and uncluttered, enabling users to monitor many performance indicators simultaneously.
Radial Bar Chart
Designing a radial bar chart for mobile screens begins with a careful rethinking of touch targets. On a handheld display, a finger pad covers a far larger area than a mouse cursor, so each ring segment and its associated labels need generous hit zones. Aim for targets of at least 44 by 44 points, and consider spacing segments slightly apart so taps register cleanly without accidental selection of a neighboring bar. Interactive tooltips or drill-down states should trigger from anywhere within the segment’s arc, not just at its centerline, which keeps selection forgiving on small screens.
Font scaling is the next critical consideration. Mobile viewing distances and high pixel densities mean labels can shrink to illegibility if sized with desktop assumptions. Use system-relative units so text responds to user accessibility settings, and set a minimum readable size for axis labels and value annotations. Because radial layouts compress available space near the center, plan to abbreviate labels, rotate them along the arc, or move detailed values into tap-activated panels. Allowing charts to scale typography with the viewport ensures the circular form stays informative rather than decorative.
Ring thickness ties these concerns together. Rings that are too thin become difficult to tap and hard to distinguish at small sizes; rings that are too thick crowd the center and leave little room for labels. A practical approach is to let ring width adapt to the available radius, keeping a consistent gap between rings and reserving the innermost area for a summary figure or empty space. Testing across common phone widths helps confirm that segment boundaries remain visible and that every ring can be selected comfortably. Together, these adjustments keep the radial chart legible and usable on compact handheld displays.
Radial Bar Chart
In a radial bar chart, every ring competes for the viewer’s attention at once, so color becomes the primary tool for establishing order. An intentional palette begins with a small set of hues chosen for their relationships: an analogous set for categories that belong together, a sequential ramp when values share a common scale, or a categorical set when each ring represents an independent entity. Limiting the palette to a handful of colors keeps the chart readable; when too many hues appear across the rings, the eye has no anchor and the overall shape dissolves into noise.
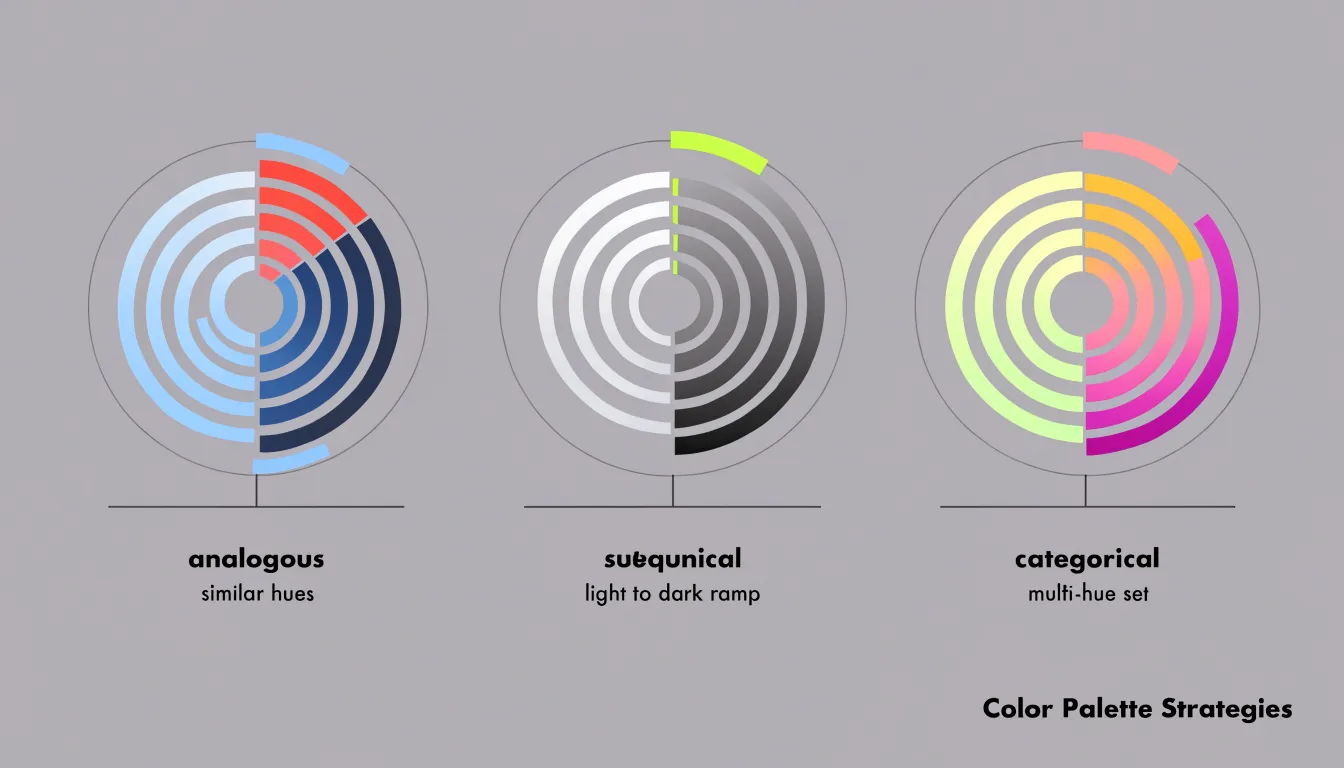
Gradients extend this logic along each ring or across the radial axis, letting lighter and darker tones encode magnitude within a single sweep. A sequential gradient running from a pale center outward to a saturated edge signals growth or accumulation intuitively, allowing viewers to read direction without consulting a legend.
Contrasting highlights sharpen the hierarchy further. By rendering the majority of rings in muted greys or desaturated versions of the base palette, a single highlighted ring in a strong accent color pulls focus instantly, whether it marks a peak, a target, or a selected category. The same principle works with brightness: a bright ring against a dim background reads as foreground, while dimmed rings recede into context.
Consistency across rings matters as much as the choice of hue. Applying the same color logic to labels, gridlines, and any annotations ties the chart together and prevents visual clutter from undermining the palette. Testing the chart at small sizes and in greyscale verifies that the hierarchy survives beyond color alone, ensuring the most important rings remain distinguishable even when hue differences fade.
Radial Bar Chart
Because a radial bar chart encodes values as angular sweep rather than linear length, the geometry of a circle can quietly change the story the data tells. Readers judge a slice or arc by the angle it subtends, and angle perception is less precise than length perception along a straight axis. Small differences in the outer portion of an arc look trivial, while differences near the center look dramatic, even when the underlying quantities differ by the same amount. This distortion grows as the bar radius shrinks: an arc of the same angular width covers far less circumference near the hub than at the rim, so two segments with equal angles can appear to represent very different totals. Designers should keep bars at a constant inner radius, avoid tapering wedges, and add direct labels so readers do not have to estimate angles visually.
A second source of misinterpretation is the baseline. Circular scales tempt designers to start bars at an inner hole rather than at zero, or to begin the scale at an arbitrary minimum that flatters the data. When a bar does not start at zero, its visible arc overstates proportional differences, making modest gaps appear large. Always anchor the arc at a true zero point, or clearly mark and justify any truncated baseline. Where a full circle spans 360 degrees, decide in advance what value the complete revolution represents, and keep that mapping consistent across all bars in the set.
Finally, be cautious with circular scales that map values to radius rather than angle. Area and radius do not grow together linearly, so doubling a radius quadruples the visual footprint. Choose one encoding rule, apply it uniformly, and provide a legend or scale ring.
Radial Bar Chart
In a concentric radial bar chart, each bar occupies a segment of an annulus, and the visual weight of that segment is heavily influenced by its radial position. Outer bars, being farther from the center, have a longer perimeter arc for the same angular span. This means that even when two bars represent identical data values, the outer bar covers a larger area and presents a longer visible edge. The human eye is naturally drawn to larger, more expansive shapes, so outer bars tend to dominate attention. This outer bar bias can distort perception, making outer categories appear more significant or larger than they actually are, especially when bar lengths are similar.
To maintain perceptual balance, designers must account for this inherent bias:
- Adjust bar width: Make outer bars slightly thinner than inner ones to compensate for the greater arc length and equalize the visual area across radii.
- Vary color or opacity: Use a consistent bar width but render outer bars in lighter tones to reduce their visual prominence.
- Order categories strategically: Place more important or larger values toward the center to leverage the bias for emphasis, or arrange categories in a logical sequence (such as descending order) to help viewers compare accurately.
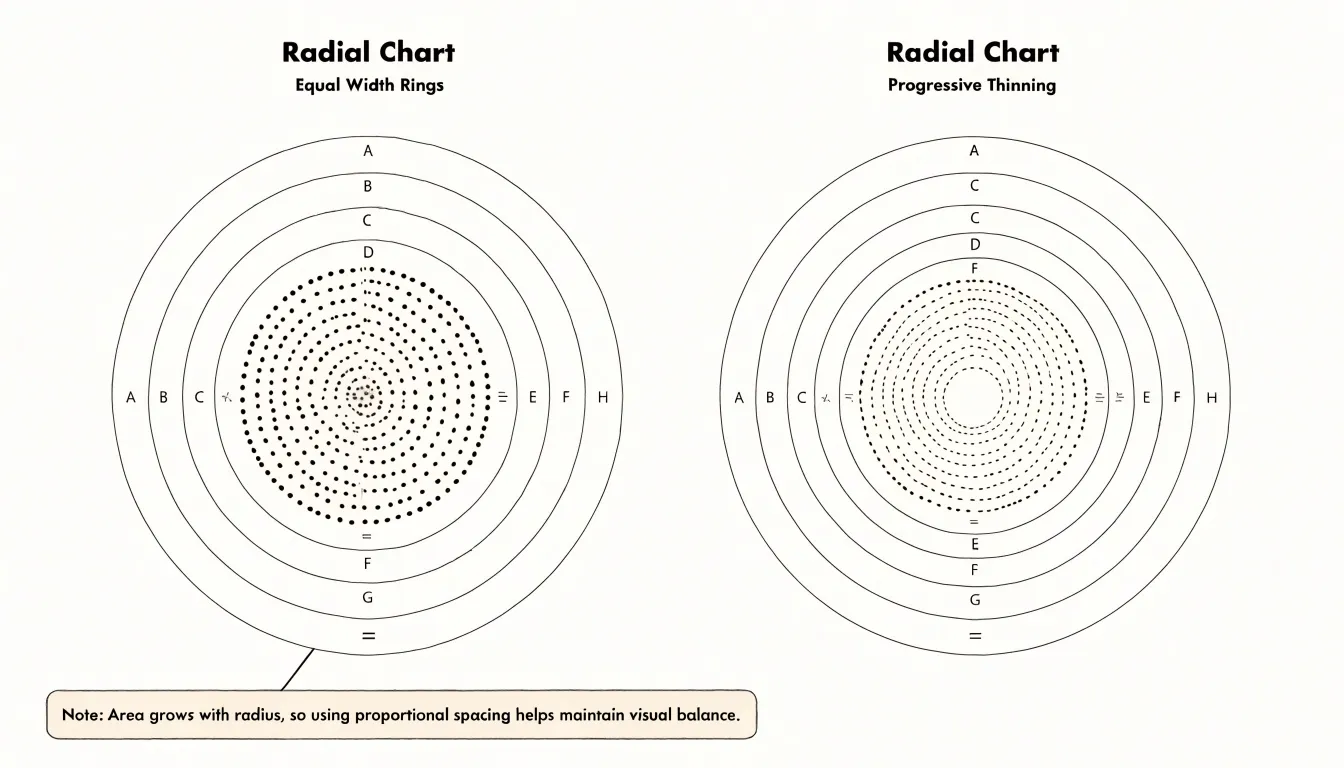
Designers should also consider the overall scale and the number of categories; with many bars, the bias compounds, so adjustments become more critical. By consciously managing bar width, color, and ordering, one can create radial bar charts that are perceptually fair, ensuring that the visual representation aligns with the underlying data.
Radial Bar Chart
Readability in a radial bar chart begins with typography that respects the curve. Labels placed along or near curved tracks need consistent alignment, a clear hierarchy of size and weight, and enough letter spacing to stay legible where the eye is following an arc rather than a straight line. Category names should sit at a predictable point relative to each bar, typically aligned to the start of the track, so viewers can match label to data without hunting. Numeric labels work best when kept to a compact format and positioned at the bar ends, where the eye naturally lands after tracing the arc. Choosing a typeface with open counters and generous x-height helps at small sizes, and limiting the number of distinct text styles keeps the chart from feeling cluttered.
Clear start and end tick marks give curved paths a frame of reference. A visible baseline marking zero, plus a tick at the maximum value, lets viewers judge bar length with confidence, since the curvature makes absolute comparison harder than in a linear chart. Intermediate ticks can help when the scale matters, provided they are light enough not to compete with the data. Tick marks should be consistent across all rings, and any axis labels should connect unambiguously to their ticks.
Ample whitespace is the third pillar. Circumference shrinks as rings move toward the center, so the inner rings are naturally more crowded. Leaving breathing room between rings, between labels and bars, and around the outer edge of the chart prevents overlap and reduces visual noise. Margins around the whole graphic matter too, giving the eye a place to rest and keeping the focus on the data paths rather than on decorative elements.
Radial Bar Chart
Adding tooltips and hover context transforms a radial bar chart from a static graphic into an interactive analytical tool. When a user moves the pointer over an individual circular bar, a small overlay can surface the precise figure the bar encodes, removing the guesswork that comes with estimating an arc’s length against a circular grid. Because radial bars lack the straight baseline readers rely on in conventional column charts, supplying the exact numerical value on hover compensates for the reduced positional accuracy inherent to the circular layout.
Radial Bar Chart
Building circular bars in a spreadsheet tool begins with data preparation, since neither Excel nor Google Sheets offers a native radial bar chart type. The standard workaround arranges values across a grid of helper columns that define each ring’s start, thickness, and rotation. A practical approach is to convert each metric into a set of angles: divide 360 degrees by the number of categories, then use those angles to compute the x and y coordinates of every bar segment with sine and cosine formulas. For each ring, generate dozens of small rows representing incremental points around the circle, so that plotted coordinates trace a smooth arc when rendered as a scatter or filled radar series.
Once the coordinate table exists, insert a scatter chart with straight lines and no markers, then add each ring as a separate series so that its arc can be styled independently. Ring order typically runs from the center outward, with the innermost series assigned to the smallest or most important metric. Adjust the axis ranges to equal positive and negative values, which centers the plot and keeps the circles perfectly round; hiding gridlines, tick marks, and axis labels leaves only the arcs visible.
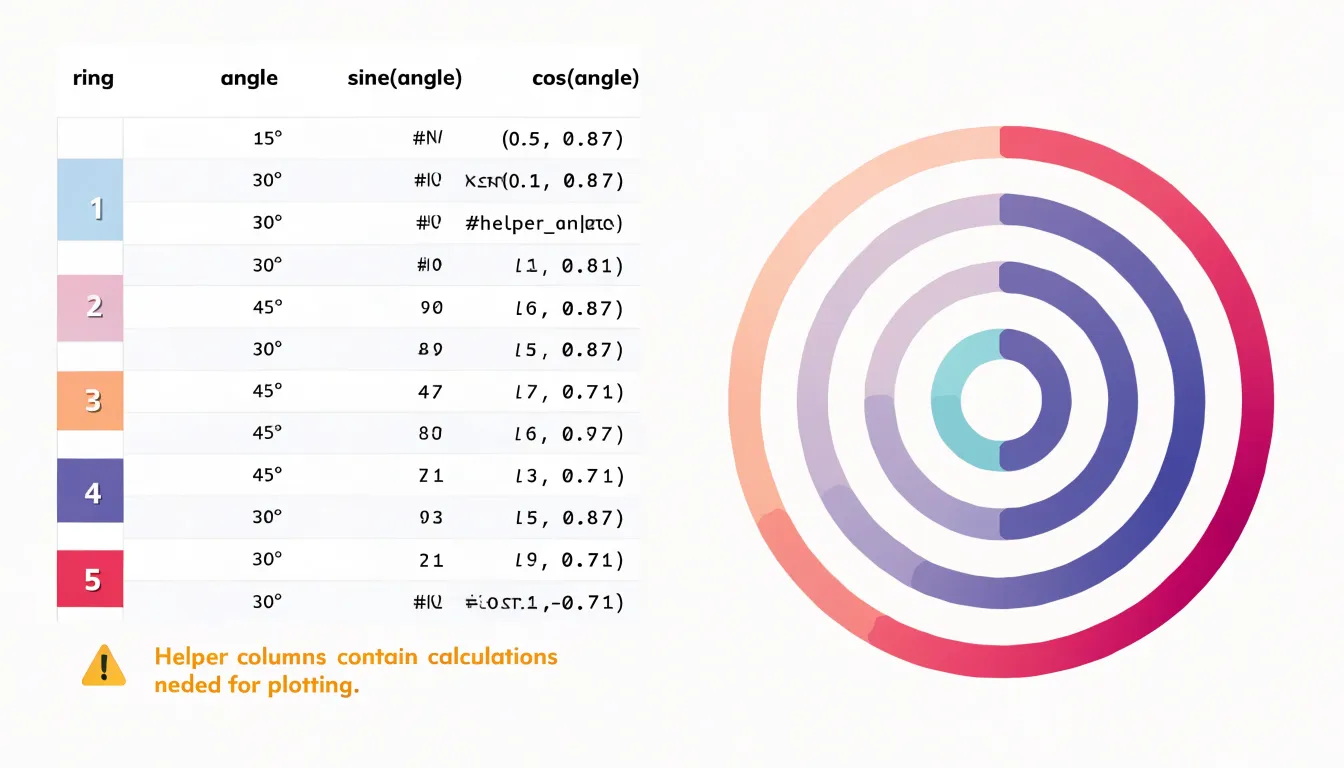
Helper formulas also handle labels. A separate column calculates the midpoint angle for each bar and converts that angle into label coordinates, letting text sit at the end of each arc. Conditional formatting in the source cells can drive color changes, and named ranges make the chart easy to refresh when new data arrives. In Google Sheets the same logic applies, though the chart editor places series controls in different menus. With careful column layout and a dedicated steps worksheet, the technique becomes repeatable for any dataset.
Radial Bar Chart
Radial bar charts, particularly in the form of circular progress rings, have become a staple in health and finance applications due to their ability to motivate users through clear, goal-oriented visuals. Apple Health, for instance, uses concentric rings to track daily activity: the Move ring shows calories burned, Exercise displays minutes of brisk activity, and Stand indicates hours spent standing. Each ring fills as the user progresses toward their daily goal, providing immediate visual feedback. This design leverages the principle of completion—users are naturally driven to close their rings, a psychological nudge that encourages consistent physical activity.
In personal finance, apps like Mint and YNAB have adopted similar radial visualizations to help users manage budgets. For example, a circular chart might show the proportion of a monthly budget spent, with the ring filling as expenses accumulate. When spending approaches the limit, the ring changes color (e.g., from green to red), serving as a visual warning. This immediate, intuitive feedback helps users stay within their financial goals without needing to parse complex tables or numbers. The circular design is particularly effective for showing progress toward savings goals as well; as users save, the ring fills, providing a sense of accomplishment and reinforcing positive financial habits.
Whether encouraging more steps or smarter spending, the circular ring capitalizes on human psychology to drive behavior change and motivate users.
Radial Bar Chart
While a radial layout works well for cyclical data or compact dashboards, the circular format introduces challenges that become significant when the goal is detailed comparative analysis. Judging the relative length of bars that curve and radiate in different directions requires more cognitive effort than comparing bars that share a common baseline along a straight axis. Readers must mentally trace each bar back to its origin, and bars positioned opposite one another are especially difficult to compare accurately.
A standard linear bar chart offers a clear advantage in these situations because all bars extend from the same baseline along a single horizontal or vertical axis. This shared reference point allows readers to compare lengths directly and to estimate differences between values with far greater precision. When a dataset contains many categories with values that differ only slightly, the linear format makes those small differences visible and interpretable. In contrast, radial layouts tend to exaggerate or obscure subtle variations, since the eye is drawn to the outer edges of the circle rather than to a consistent measuring line.
Complex datasets with numerous variables, hierarchical categories, or a need for precise value labels also favor the linear approach. Sorting, ranking, and annotating values are straightforward tasks in a conventional bar chart, and gridlines can be aligned cleanly with the axis. Audience familiarity is another consideration: most readers interpret linear bars intuitively and can extract exact values without additional explanation. When the analytical task centers on comparing magnitudes, detecting small differences, or presenting detailed values to an audience that needs to draw precise conclusions, the standard bar graph remains the more effective and reliable choice.
Radial Bar Chart
Presenting data through a radial bar chart calls for deliberate design choices that keep the circular layout legible. Start with the fundamentals: keep the number of categories modest, since a radial arrangement gives each bar less visual room than a standard bar chart, and too many spokes turn the graphic into a dense ring that readers cannot parse. Consistent spacing between bars prevents adjacent segments from bleeding together, and a shared, clearly marked scale anchored at a reachable angle gives readers a reference point for judging length.
Emphasizing key takeaways means guiding attention before the reader has to hunt for it. Highlight the top performer or the segment most relevant to the narrative with a stronger color, a subtle callout, or a short annotation placed near the bar itself. Use the center of the radial chart to state the single most important figure or message in the form of a brief summary, such as a total, an average, or the headline finding. Keep these interventions few, since multiple accents dilute their effect.
Contextual labeling completes the graphic. Include units, a clear title, and any necessary footnote about the data source or period so the chart stands on its own. Where the circular geometry could mislead, add light guidance such as a reference ring or a note on how to read the arc.
Radial Bar Chart
Readers encounter the radial bar chart most often in dashboards, where it communicates progress toward a target, the relative size of a handful of categories, or the completion status of a set of tasks. Beyond fitness trackers, typical applications include sales dashboards comparing a small group of products and project management views summarizing the share of work finished across workstreams.
Placement within a dashboard deserves care. Radial bar charts work best as compact summary widgets positioned near the top of a screen or beside a headline metric, where they draw attention to a single figure or a small cluster of related values. They suit panels occupying a square or circular footprint, such as the corner of a KPI row or a sidebar card, since the round shape fills that space efficiently. Because a conventional horizontal bar chart serves better for showing many categories or precise differences, the radial form belongs in supporting rather than primary analytical roles.
For implementation, keep the category count low, generally between three and eight bars, and provide accessible text alternatives for screen readers. With these practices in place, the radial bar chart becomes a dependable element of a well-structured dashboard.
Frequently Asked Questions
What is a radial bar chart?
A radial bar chart arranges bars along circular paths, with each goal drawn as a concentric arc that sweeps from a fixed starting angle to its current completion level. A full circle signals a finished goal, while a partial arc leaves a gap that shows remaining work.
When is a radial bar chart a good fit for cyclical data?
It works well for data that loops, such as hours in a day, months in a year, or seasons, because the circular axis emphasizes recurring patterns and continuity from one cycle to the next. The article cautions that you should ensure the data truly cycles, since a circular arrangement may confuse otherwise.
How should you sort rings in a concentric radial bar chart?
Sort the rings in a logical order, typically from largest to smallest arc length, to create a visual hierarchy that helps viewers spot top performers. Without sorting, the chart becomes a jumble of varying arc lengths and slows insight discovery.
What touch target size should a mobile radial bar chart use?
Aim for touch targets of at least 44 by 44 points, and consider spacing segments slightly apart so taps register cleanly without selecting a neighboring bar. Interactive tooltips or drill-down states should trigger from anywhere within the segment’s arc, not just at its centerline.
What are common readability pitfalls in radial bar charts?
Because angle perception is less precise than length perception, equal angular differences can look trivial near the outer edge and dramatic near the center, especially as bar radius shrinks. Designers should keep bars at a constant inner radius, avoid tapering wedges, add direct labels, and anchor arcs at a true zero point or clearly mark and justify any truncated baseline.
Are radial bar charts better than standard bar charts for detailed comparison?
No; the article says a standard linear bar chart is clearer when the goal is detailed comparative analysis, because all bars share a baseline and lengths can be compared directly. Radial layouts require more cognitive effort and can obscure or exaggerate subtle differences, so they belong in supporting rather than primary analytical roles.
Tony Astor
Tony writes about data visualization and the tools people use to build charts and dashboards. More about Data Illustrator