Radar Chart vs Bar Chart: Which Compares Better?
 By Tony Astor ·

Radar Chart vs Bar Chart
A radar chart plots multiple variables on axes radiating from a shared center, forming a polygon that shows an item’s overall profile at a glance. A bar chart encodes each value as a bar length on a common linear scale, making precise comparisons easier. Radar charts suit profile recognition across five to eight dimensions; bar charts suit accurate value reading and ranking.
Table of Contents
Radar Chart
A radar chart, sometimes called a spider plot or polar chart, places each variable on its own axis radiating outward from a shared central origin. The axes are spaced evenly around a circle, and every axis uses the same scale, so a point plotted far from the center represents a high value while a point near the center represents a low one. When the values for a single item are plotted along each axis and connected in sequence, the result is a closed polygon whose shape serves as a compact picture of that item’s overall profile.
The appeal of this layout lies in how it handles multivariate data for one entity. A product might be assessed on speed, reliability, cost, ease of use, and support quality. Plotted on a bar chart, those five measures sit side by side as separate columns, and the reader has to mentally assemble them into a summary. On a radar chart, the same five values form a single shape, and the silhouette conveys the entity’s strengths and weaknesses immediately. A polygon that bulges toward the outer ring on speed and support but pulls inward on cost signals a fast, well-supported, but expensive product without any reading of individual numbers.
The central origin gives every axis a common reference point, which makes the geometry meaningful. The area enclosed by the polygon corresponds roughly to overall performance, and the symmetry or skew of the shape shows how balanced the entity is across dimensions. Because all axes share one scale, comparisons between variables remain honest within the chart.
This makes radar charts well suited to profile-style questions: how does this candidate rate across competencies, how does this service score across quality dimensions, or where does this model sit on a range of trade-offs. The radial format turns a table of measurements into a recognizable signature for the item under review.
Bar Chart
A bar chart maps each category to a rectangular bar whose length encodes a single value. The horizontal or vertical axis carries a linear scale, so equal differences in value appear as equal differences in length anywhere along the axis. A bar representing 40 units is exactly twice as long as one representing 20, and the visual gap between 60 and 70 looks identical to the gap between 20 and 30. Readers can compare bar lengths at a glance without mentally adjusting for curvature, angle, or distance from a center point. This direct correspondence between number and length makes the chart intuitive even for audiences with no statistical training.
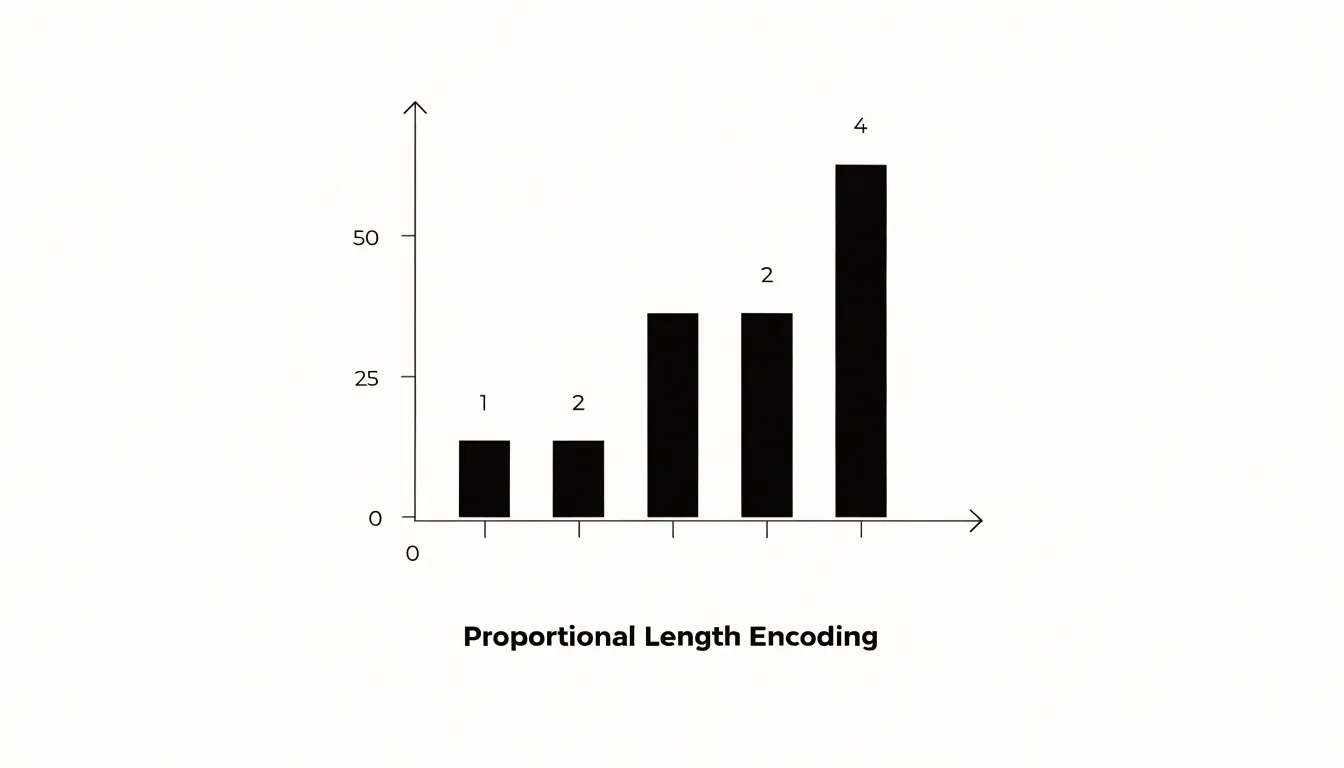
That intuitiveness matters most when comparing discrete, single-metric quantities across categories: revenue by region, headcount by department, survey responses by option, or units sold by product. Each category stands alone, and each bar answers one question about it. Because the categories share one axis, any two bars can be compared directly, and the whole set can be ranked by length in an instant. Ordering the bars by value turns the chart into a ready-made ranking, while grouping or coloring them lets readers trace subcategories without abandoning the common scale.
Linear scales also keep the comparison honest. Consistent unit spacing means no region of the chart is visually privileged, and small differences stay small while large ones stay large. When the data contain a genuine zero, anchoring the axis there preserves proportional reading, so a category twice the size of another shows a bar twice as long. Gridlines and tick labels reinforce this reading by letting viewers translate any bar back into an approximate figure.
Radar Chart
When a product evaluation covers a fixed set of criteria such as performance, price, ease of use, support, and reliability, plotting every product on the same set of spokes makes trade-offs a matter of visual geometry rather than a table of numbers.
Skill assessments benefit from the same logic. When a candidate or employee is rated across communication, technical ability, leadership, and problem solving, the resulting polygon gives managers a profile they can compare against a target shape or a team average. Layering a second or third series onto the chart—for example, an aspirational profile against a current one—lets reviewers see gaps as visible surface area rather than isolated figures.
The compactness of the format also suits executive summaries and dashboards, where space is limited and readers need to absorb an overall pattern quickly. For product teams weighing competing designs, and for HR teams building development plans, the radar chart turns a long checklist of scores into a silhouette that communicates where an option excels and where it falls short.
Bar Chart
In the vertical form, often called a column chart, categories sit along the horizontal axis while the measured quantity rises along the vertical axis. This arrangement makes the bar chart a dependable instrument for tracking sales and volume over time, since each column corresponds to a specific interval such as a month, quarter, or year, and the sequence of columns reflects chronological progression.
When the vertical axis starts at zero, column height offers an honest encoding of magnitude: a quarter that doubles its revenue produces a column twice as tall as the one before it. This direct proportionality supports quick judgments about direction and pace: a steadily rising series of columns communicates expansion, a falling series signals contraction, and alternating heights reveal seasonality or irregular demand. Analysts can layer a trendline across the tops of the columns to highlight the underlying trajectory, and a stacked configuration allows each column to be divided into segments representing product lines, regions, or channels, so total revenue and its composition appear in a single view.
The same structure works well for operational volume shifts, including units shipped, orders processed, hours logged, or inventory moved. Because volume data often spans uneven periods and occasional spikes, the column format keeps each measurement anchored to a common baseline, making outliers easy to spot and comparisons between adjacent periods straightforward. Grouped columns extend the approach to side-by-side comparisons, such as this year against last year within each quarter, while consistent spacing and clear axis labels preserve readability as the number of periods grows.
Radar Chart
The radar chart’s structure makes it especially well suited to evaluating items across multiple senses or attributes at once. In sensory profiling, consider a flavor wheel applied to coffee, chocolate, wine, or cheese: tasters may rate notes such as sweetness, acidity, bitterness, roast intensity, fruitiness, and body. Plotted on a radar chart, an experienced panel can compare one sample against another by overlaying their polygons. The same approach works for fragrance balance, where axes might represent top, heart, and base notes alongside qualities like freshness, warmth, and woodiness. Perfumers and evaluators can see immediately whether a composition leans citrus-forward, resinous, or floral, and where its balance sits relative to a reference standard.
Sensory descriptions often involve many dimensions that interact, and a radar chart preserves that multidimensionality without forcing evaluators to collapse their judgments into a single score. Axes can be arranged so that related attributes sit adjacent to one another, giving the resulting shape an intuitive geometry: a rounded, balanced polygon suggests harmony, while a spiky one highlights dominant characteristics. This is useful in product development, quality control, and comparative tasting, where teams need to communicate nuanced sensory impressions consistently.
Accuracy
Human visual cognition is well tuned to certain geometric properties and notably weak at others. In a bar chart, judging length relies on the visual system’s ability to compare aligned linear extents, a task people perform with high precision. Because the bars share an origin and orientation, differences between them register directly as differences in endpoint position. Research on graphical perception, most famously the work of Cleveland and McGill, consistently ranks position along a common scale and aligned length at the top of accuracy rankings, well above angle and area judgments. The eye can detect small discrepancies in bar length because the comparison is a one-dimensional measurement against a fixed reference.
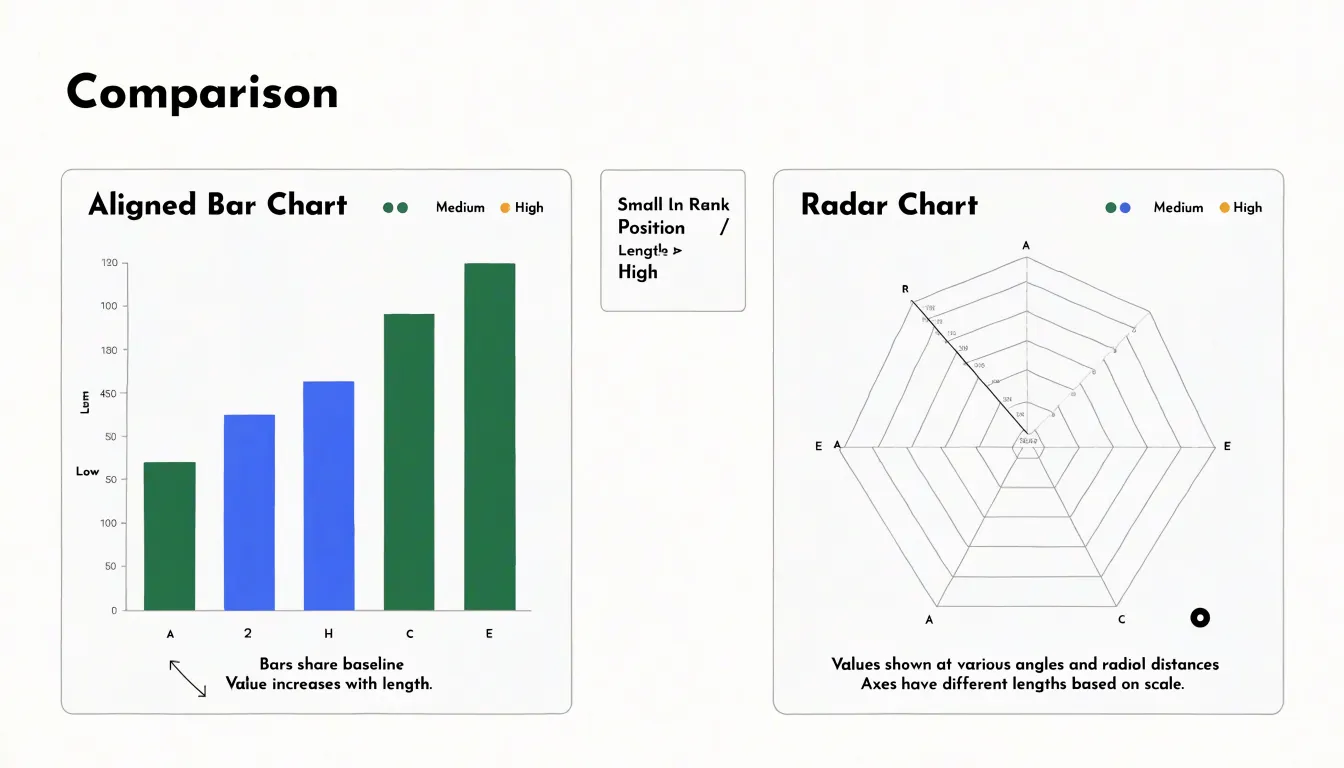
Radar charts impose a different perceptual burden. Each value is encoded as a point along a spoke, and the resulting shape’s vertices sit at varying angles and distances. Reading a single value means estimating a radial distance without a shared baseline; each spoke starts at the same center but points in a different direction, so there is no common axis to anchor the comparison. Comparing two values means comparing angles and the areas enclosed by the polygon, which are far coarser judgments. Angle perception degrades quickly as angles grow similar, and enclosed area is difficult to estimate accurately, especially when shapes are irregular. Values in a radar chart also change meaning depending on where the axis order places them, since adjacent points form edges and fill regions whose apparent size shifts with configuration rather than data.
The practical consequence is that bar charts let readers decode values with a precision close to the underlying numbers, while radar charts introduce perceptual error at every step. Small differences that a bar chart renders obvious may vanish in a radar plot, and larger differences may be exaggerated by the filled area. For any task that requires accurate reading of values, the linear length encoding of a bar chart is the safer choice.
Radar Chart
Radar charts come into their own when a dataset spans five to eight distinct dimensions that need to be read together as a single profile, such as balanced scorecard dimensions. In this range, spreading the categories evenly around a circle gives every axis comparable visual weight without requiring the reader to scan back and forth across a long horizontal axis.
Bar charts begin to strain under the same conditions. Representing five to eight variables for even a handful of entities produces clustered bars that multiply quickly: each additional variable adds another column to every group, and each additional entity adds another set of clusters. The chart grows crowded as bars narrow, labels collide, and distinguishing one group from another demands close inspection of a busy legend. Reading the overall profile of a single entity requires hopping between non-adjacent bars to reconstruct a pattern that a radar chart presents as one continuous outline.
The radial design works best when the axes are genuinely comparable in scale, the number of variables stays moderate, and the goal is profile recognition rather than precise value lookup.
Bar Chart
Bar charts excel at managing large datasets because their linear layout scales naturally with the number of categories. When a bar chart includes dozens of distinct categories, the horizontal or vertical axis can be extended to accommodate each one. On a screen, the chart can be made scrollable, allowing viewers to navigate through the full set of categories without losing the ability to compare bar lengths. Alternatively, the chart can be paginated, splitting categories into manageable chunks across multiple views, or equipped with zoom controls. This flexibility ensures that each category remains clearly labeled and that the bars maintain a consistent width and spacing.
In contrast, radial designs struggle with large numbers of categories because the available space around the circle is fixed. As more axes are added, the angles between them narrow, labels overlap, and data points crowd together.
Moreover, bar charts support sorting and grouping, which enhances readability for large datasets. By ordering bars by value or grouping related categories, viewers can quickly identify patterns and outliers—an organization that is cumbersome in radial designs where the circular arrangement imposes a fixed order.
Bar Chart
Most audiences encounter bar charts early in their education and continue to see them in reports, dashboards, news coverage, and business presentations throughout their careers. When a reader meets a bar chart, the cognitive work of decoding the graphic happens almost instantly, freeing attention for the actual argument the data supports.
For general audiences, this familiarity reduces friction. Non-technical stakeholders do not need a legend tutorial or a moment of orientation before extracting meaning. Executives scanning a deck between meetings can read a bar chart at a glance, form an impression, and move on without pausing to interpret radiating axes or overlapping shapes. The absence of that pause matters in decision-making settings, where hesitation often becomes skepticism and where an unclear visual can stall a conversation.
Bar charts also constrain the ways a graphic can be misread because their conventions are widely understood. With less familiar formats, readers must construct an interpretation in real time, which is where errors creep in: a viewer may misjudge area, overlook the center of a radial scale, or assume a relationship the chart does not encode. For audiences who will act on the numbers, choosing the structure they already trust keeps attention on the message.
Space Efficiency
A radar chart occupies a roughly square footprint because its points are plotted along radial spokes that sweep a full circle and its gridlines are concentric polygons or rings. Squeezed horizontally, a radar chart distorts its angles; squeezed vertically, the spokes collapse into each other. A dashboard designer therefore has to reserve a block of space close to a square, even when the surrounding layout calls for a wide, short panel. In multi-panel dashboards, where columns and rows follow a regular grid, this mismatch often leaves unused whitespace or forces other elements to be resized around the circular chart.
Horizontal bar layouts behave differently. Because their length dimension runs along the x-axis and their categorical dimension stacks along the y-axis, they can stretch or compress in width with little loss of readability. A horizontal bar chart can sit in a wide banner slot, a narrow sidebar, or an elongated panel beneath a table. Long category labels also read naturally along the left edge, avoiding rotated text that consumes vertical room in other layouts. When many small charts are tiled into a reporting grid, horizontal bar panels can share common aspect ratios and align cleanly to row and column boundaries, making better use of the available area.
Outliers
Outliers become visible at different speeds depending on the chart type. On a radar chart, when one attribute deviates sharply from the rest, the polygon stretches dramatically toward that spoke, producing a long, conspicuous spike. Because the eye reads the overall shape of the polygon as a unified object, a spike that breaks the symmetry draws attention immediately. The anomaly announces itself through the silhouette of the whole figure, simultaneously showing how far the value departs from its neighbors and from the typical profile of the entity. In a multi-attribute context, several deviations can register at once, since each distorted corner stands out against the expected contour.
In a bar chart, each column is an independent mark. An outlier shows up as an unusually tall or short bar, but the viewer must notice it among the other bars and mentally gauge its height against the scale and its neighbors. On a crowded axis, a single extreme bar can be visually absorbed by surrounding columns, especially when many bars cluster at similar heights and the scale stretches to accommodate the maximum.
The practical difference is the speed of detection. A radar polygon turns a deviation into a change of overall shape, which the visual system processes holistically and almost instantly. A bar chart encodes the same deviation as one height among many along a line, which the viewer resolves sequentially, bar by bar.
Variable Ordering
The shape of a radar chart is highly sensitive to the order in which variables are arranged around the perimeter. Because the polygon is formed by connecting adjacent axis points, changing the sequence of metrics redraws the entire figure, altering its apparent area and visual emphasis. A metric that appears as a sharp peak when placed next to a low-value metric may become part of a broad, gentle slope when repositioned, even though the underlying data remain identical.
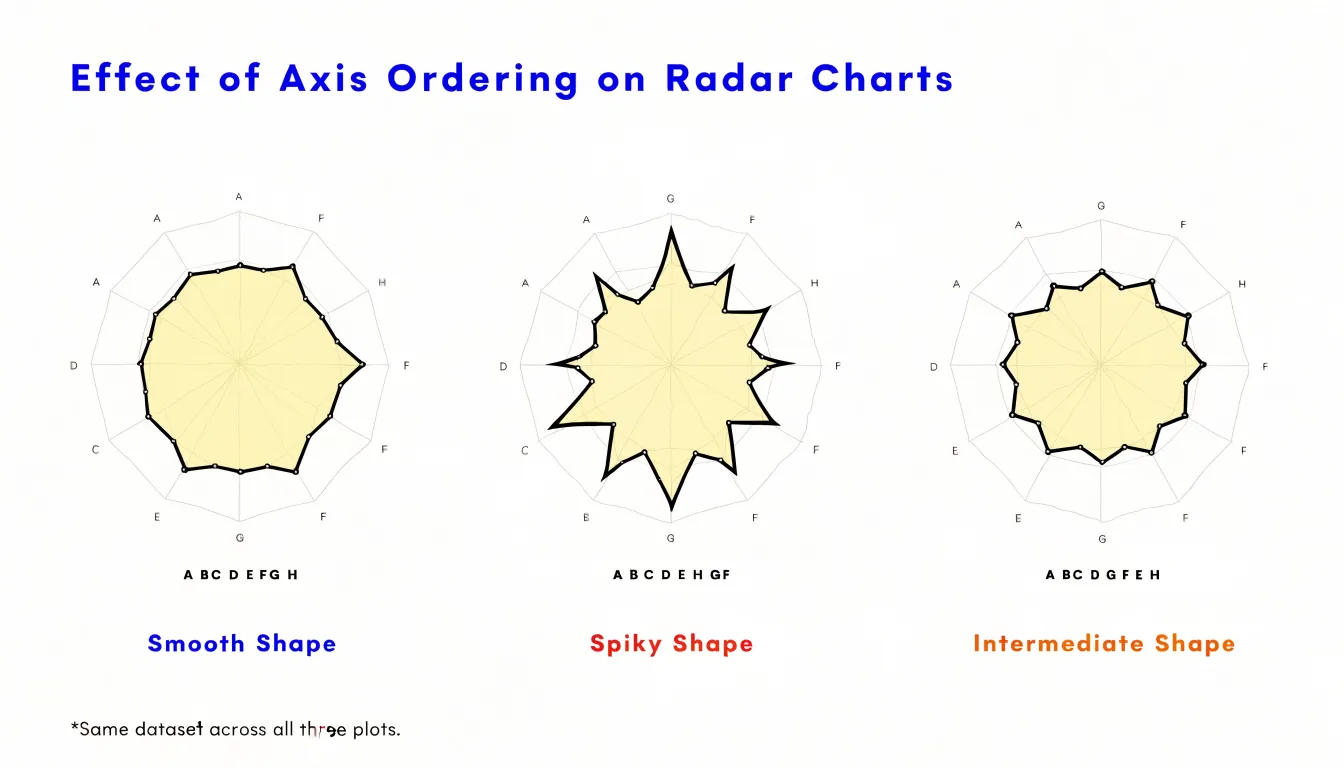
This axis-order effect introduces a subtle bias: viewers perceive the chart’s overall shape as a meaningful pattern, when in fact that shape is partly an artifact of arbitrary layout decisions. Grouping similar metrics together can create a smooth, rounded polygon that suggests consistency, while interleaving high and low values produces a jagged outline that implies volatility. In comparative contexts, inconsistent axis ordering can further distort comparisons, making one series appear larger or more balanced simply because its axes were arranged more favorably.
To mitigate this bias, analysts should adopt a consistent and justifiable ordering strategy—such as sorting by logical category, alphabetically, or by magnitude—and disclose that choice. When possible, presenting the same data under multiple orderings can reveal how much of the perceived pattern is robust and how much is an artifact of layout.
Design Mistakes
Several recurring mistakes can undermine an otherwise sound visualization:
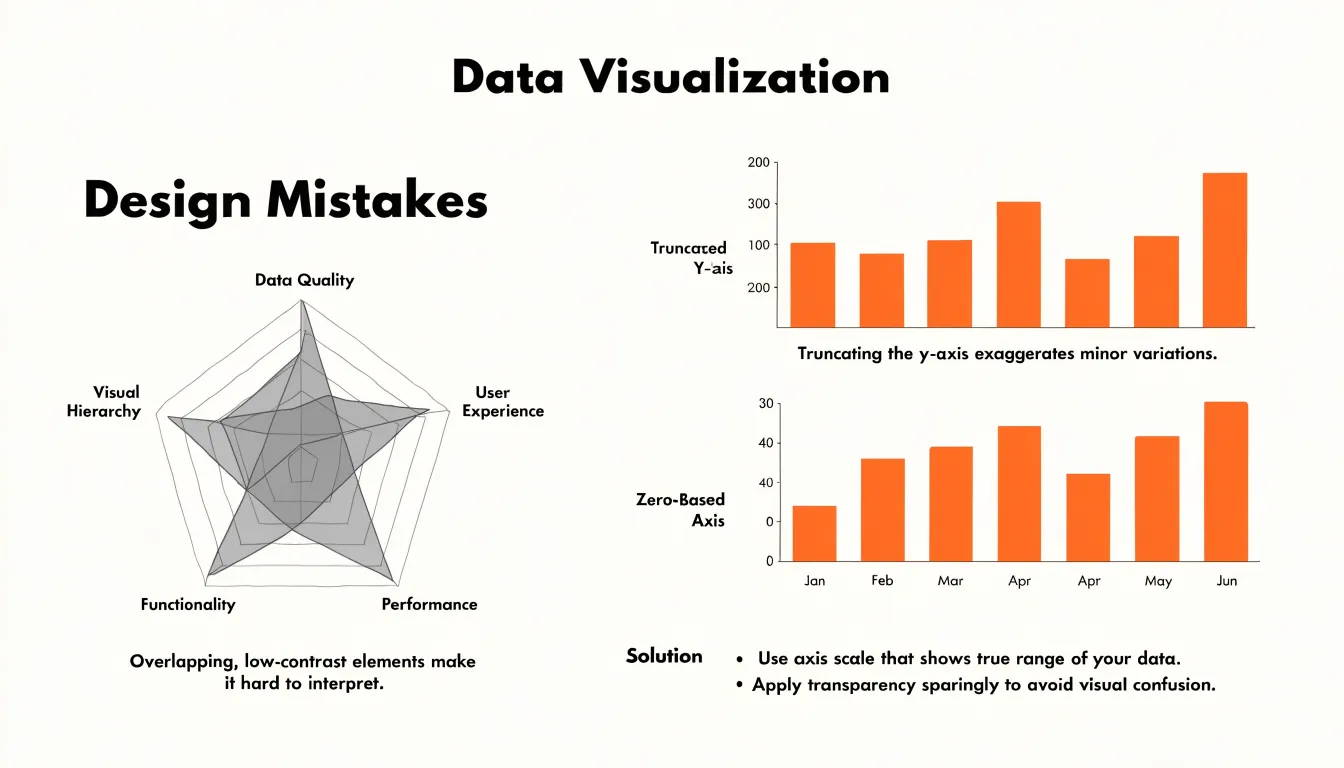
- Overlapping radar polygons: Layering multiple semi-transparent polygons on the same axes multiplies the number of tinted regions, forcing readers to mentally subtract colors to work out which series occupies which area. Once four or five series are stacked, the chart turns into a muddled web where intersections become ambiguous and the visual hierarchy collapses. Limit the number of overlaid series, use distinct outline styles, or split dense comparisons into small multiples so each polygon can be read on its own.
- Truncating the bar chart baseline: When a bar chart’s axis starts at an arbitrary value above zero, small differences between bars are stretched into dramatic visual gaps. A difference of two percentage points can appear to be a fivefold advantage, misleading readers who rely on bar length as a proxy for magnitude. Keep the baseline at zero whenever the chart supports comparison. If the variation is genuinely small, annotate the values directly or switch to a chart type designed for narrow ranges.
- Low-contrast color palettes: Pale pastels and similarly toned hues blur together in overlapping radar polygons and make adjacent bars hard to distinguish, particularly for readers with color vision deficiencies or on poorly calibrated screens. Test palettes for sufficient luminance contrast, pair color with texture or shape, and verify legibility in grayscale.
Dashboard Overview
Selecting between a radar chart and a bar chart relies on three filters:
- Audience familiarity: Viewers with strong domain familiarity often read radar charts fluently, interpreting the polygon’s shape at a glance. Audiences with less domain expertise tend to benefit from bar charts, which require no interpretive training. If it is uncertain whether primary readers can read radial axes without guidance, bar charts offer a safer default.
- Metric complexity: Radar charts work best when a fixed set of related, similarly scaled metrics forms a closed profile. When metrics diverge in units, ranges, or importance, bar charts handle the comparison more gracefully because each bar stands alone and does not distort its neighbors.
- Layout and tooling constraints: Radar charts can pack a multidimensional profile into a small square widget on dense executive dashboards, though they need careful axis labeling to remain readable. Bar charts scale horizontally to fit wider panels and detailed analytical views, are universally supported across tools, and are easy to annotate.
Frequently Asked Questions
What is a radar chart used for?
A radar chart places each variable on its own axis radiating from a shared central origin, uses the same scale on every axis, and connects values into a closed polygon that shows an item’s overall profile. It is well suited to profile-style questions, such as how a candidate rates across competencies or how a service scores across quality dimensions.
Are bar charts more accurate than radar charts?
Yes, the article states that bar charts let readers decode values with precision close to the underlying numbers, while radar charts introduce perceptual error at every step. For tasks requiring accurate reading of values, the linear length encoding of a bar chart is described as the safer choice.
When should I use a radar chart instead of a bar chart?
Radar charts work best when a dataset spans five to eight distinct dimensions that need to be read together as a single profile, when axes are genuinely comparable in scale, and when the goal is profile recognition rather than precise value lookup. Bar charts are better for large datasets, sorting and grouping, and situations where each category stands alone.
How do radar charts and bar charts show outliers?
On a radar chart, an outlier stretches the polygon toward that spoke and creates a conspicuous spike, so the deviation is processed as a change in overall shape almost instantly. In a bar chart, an outlier appears as an unusually tall or short bar that the viewer must notice among the other bars and mentally gauge against the scale.
Why does variable order matter in a radar chart?
The shape of a radar chart is highly sensitive to the order of variables because the polygon connects adjacent axis points, so changing the sequence redraws the figure and can alter its apparent area and visual emphasis. The article recommends a consistent, justifiable ordering strategy and disclosing that choice, and suggests presenting the same data under multiple orderings when possible.
What are common mistakes to avoid with radar charts and bar charts?
Common mistakes include overlapping too many semi-transparent radar polygons, truncating a bar chart baseline above zero, and using low-contrast color palettes. The article recommends limiting overlaid radar series or using distinct outline styles or small multiples, keeping the bar chart baseline at zero whenever the chart supports comparison, and testing palettes for sufficient luminance contrast.
Tony Astor
Tony writes about data visualization and the tools people use to build charts and dashboards. More about Data Illustrator