Radar Chart: Uses, Examples and Limitations
 By Tony Astor ·
Radar Chart
A radar chart is a circular graph that displays multivariate data by plotting values on evenly spaced spokes radiating from a central origin, with adjacent points connected to form a closed polygon. Each spoke shares the same scale, so distance from the center encodes magnitude, and the polygon’s shape reveals a profile’s strengths, weaknesses, and balance at a glance.
Table of Contents
Radar Chart
A radar chart—often called a spider chart, spider web plot, or web chart—begins with a single decision about geometry: the placement of a central origin point. That point represents the zero or minimum value for every variable being displayed, and every measurement radiates outward from it. The choice of location matters because the chart’s entire visual balance depends on it.
Once the origin is fixed, each variable receives its own spoke axis: a straight line extending outward from the center at an equal angular interval from its neighbors. With five variables, the spokes divide the circle into five equal slices of 72 degrees; with eight, each slice becomes 45 degrees. This even spacing ensures that no variable is visually privileged over another, creating the wheel-like frame that gives the chart its distinctive appearance.
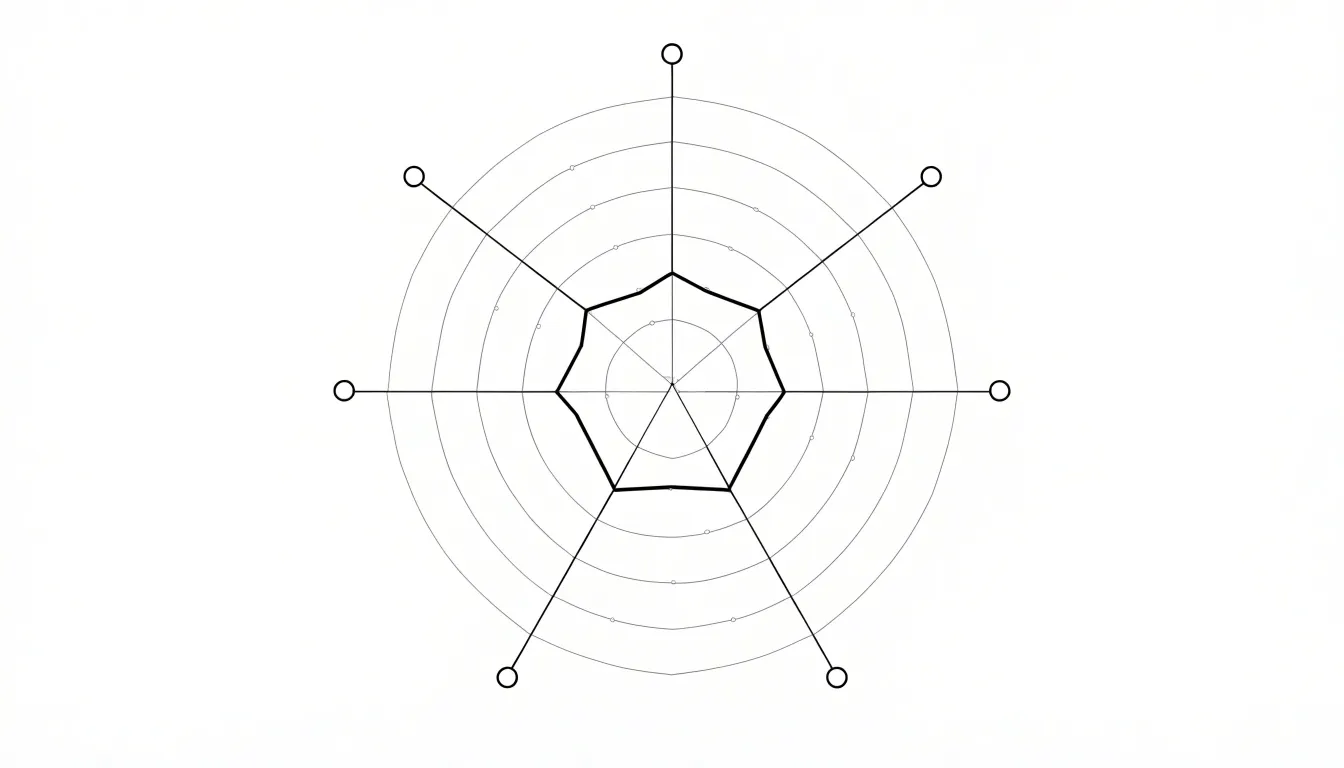
Along each spoke axis, a scale is marked off in consistent increments, so that a value of 50 sits halfway out on every spoke and a value of 100 reaches the outer boundary. The viewer reads each variable by locating where its data value falls on its own axis. Next, a point is placed on each spoke at the appropriate distance from the center, and adjacent points are joined by straight line segments to form a closed polygon. That polygon is the actual data shape, and its overall area and silhouette allow quick comparison between profiles. A larger, regular polygon suggests consistently high values across all dimensions, while an irregular shape that dents inward or spikes outward highlights variables where the profile deviates from the rest.
The foundational geometry thus consists of three layered elements: the central origin, the evenly spaced spoke axes that structure the space, and the connected polygon that encodes the data.
Radar Chart
At the heart of the radar chart lies a system of concentric radial grid lines that translate raw numbers into spatial distance. Starting from the central zero point, each successive ring moving outward marks a fixed increment along the quantitative scale, much like the evenly spaced tick marks on a conventional axis. The rings are drawn as polygons or circles that connect equal radius points across each axis, banding the plotting area into discrete measurement zones.
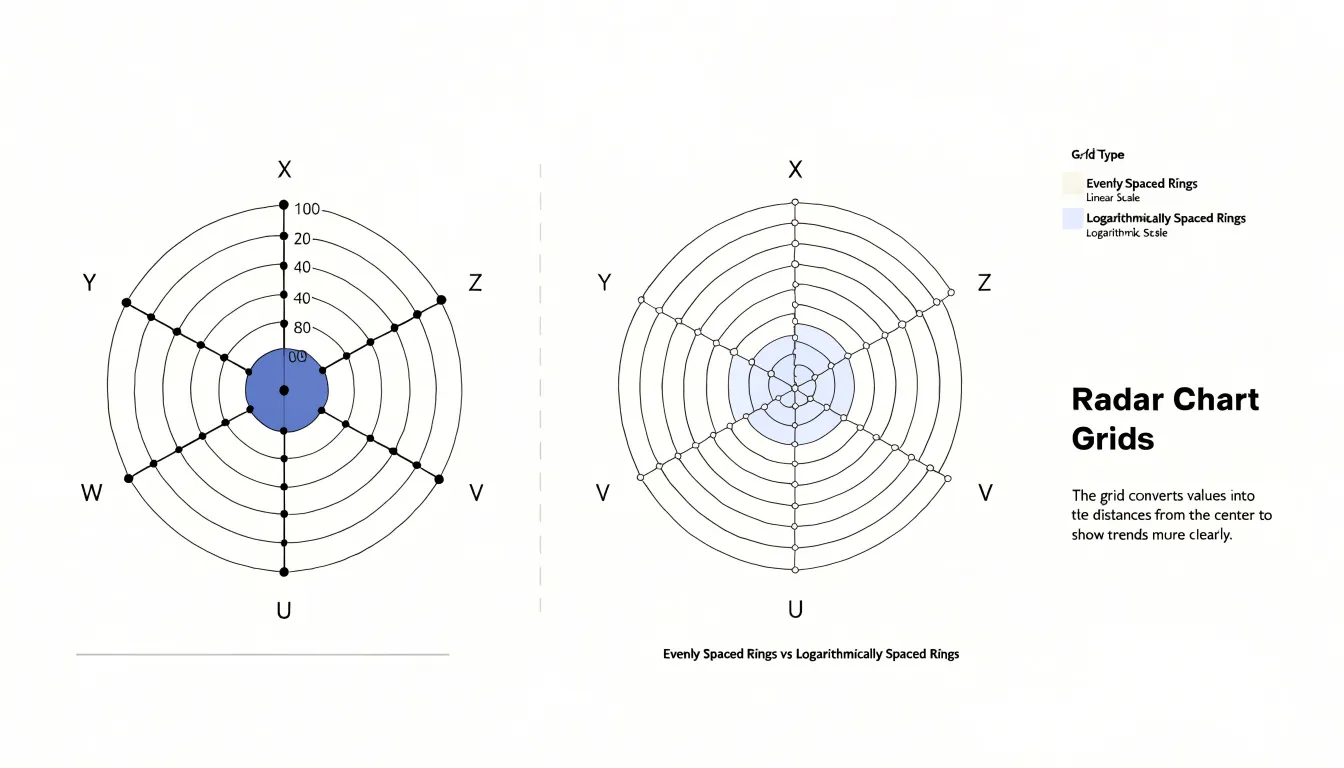
To read a value, a viewer follows the axis for a given variable outward from the center and notes where the plotted point falls relative to those rings. A point sitting on the third ring indicates three increments above zero, while a point on the fifth ring indicates five. Because every axis shares the same set of rings, the grid establishes a common reference across all variables, allowing magnitudes on one axis to be compared directly with magnitudes on another. This uniform ring structure gives the radar chart its ability to show relative proportions at a glance: a shape that bulges toward the outer rings signals high values, while a shape pulled close to the center signals low ones.
The spacing of the rings also shapes how the chart communicates:
- Evenly spaced rings produce a linear scale, where equal distances correspond to equal differences in value.
- Uneven or logarithmically spaced rings compress or expand portions of the scale, altering how dramatic a given change appears.
Designers typically label the rings, either along one axis or around the perimeter, so that viewers can anchor the distances to concrete numbers. Without those labels, the rings still convey relative magnitude, but the exact values remain ambiguous. In this way, the radial grid lines function as the chart’s measuring instrument, converting an abstract set of figures into a readable geometry of distance from the center.
Radar Chart
Perfume composition hinges on how individual materials release their scent over time, and the radar chart offers a compact way to visualize that behavior across a whole formula. Perfumers and essential oil brands often categorize materials into top, middle, and base notes, then assign each category a numerical intensity value based on concentration, volatility, and perceived strength in a trial blend.
When those values are plotted, each fragrance becomes a distinct polygon whose shape reveals the overall balance of the composition. A scent heavy in citrus and light aldehydes produces a sharp spike toward the top-note axis, while an oriental blend with resins, woods, and musk pushes the polygon outward along the base-note axis instead.
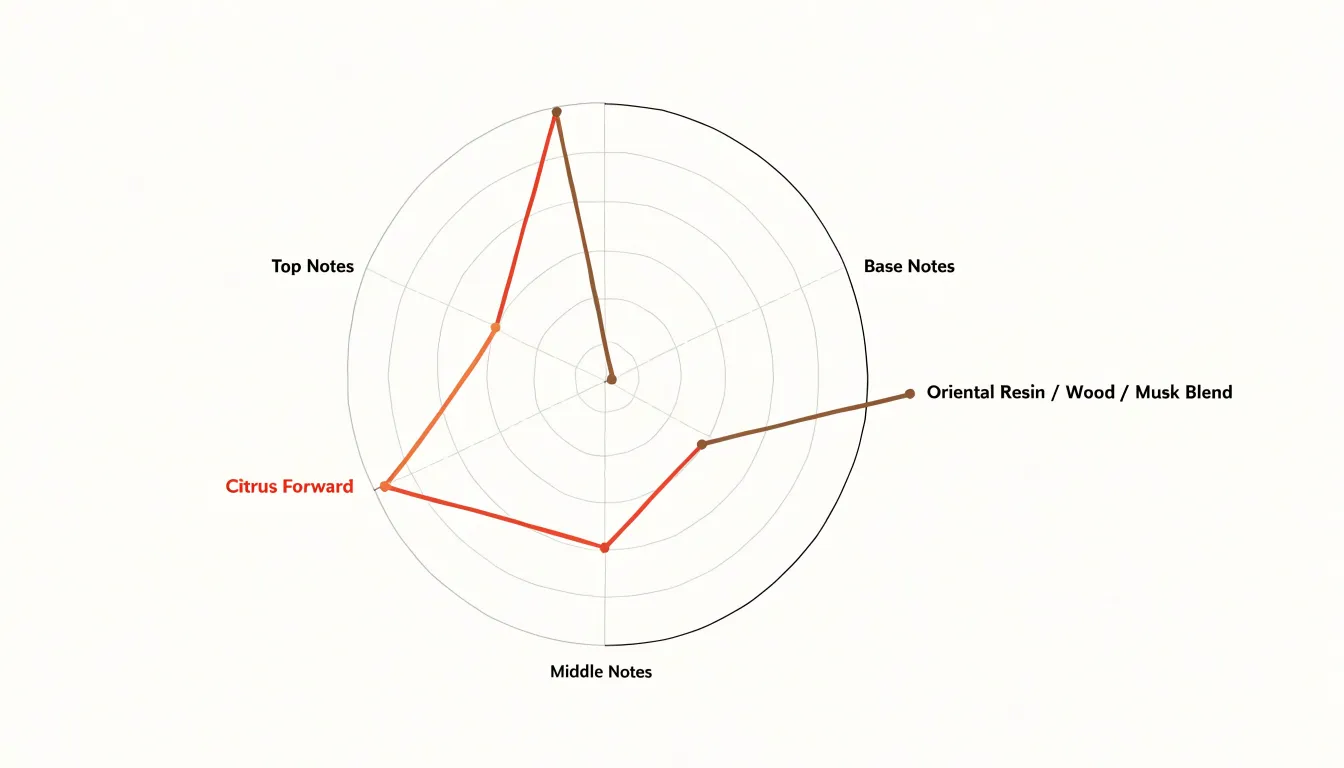
Because the axes correspond to recognizable sensory categories, overlaying two or more fragrances on the same chart makes differences immediately visible:
- Formulation trials: A perfumer evaluating several trial modifications can overlay their polygons to see which version strengthens the middle-note heart without flattening the opening.
- Batch communication: Essential oil suppliers use similar maps to communicate the expected aromatic profile of a batch, helping buyers understand whether a given lot leans bright and volatile or deep and persistent.
- Quality control: A deviation from the reference polygon signals a shift in raw material or blending ratio.
Building the chart begins with a consistent scoring rubric so that intensity values remain comparable across materials and products. Analysts may draw on sensory panel ratings, gas chromatography data, or established perfumery conventions, then aggregate the scores for each note family. The resulting radar chart condenses a complex fragrance profile into a single visual signature, making it easier to discuss, document, and refine compositions across teams and markets.
Radar Chart
Wearable health trackers and smartphone wellness apps capture a wide range of daily metrics, from hours slept and sleep quality to hydration, step counts, active minutes, and recovery indicators such as resting heart rate and heart rate variability. On a radar chart, sleep quality might occupy the vertical axis, hydration the next spoke clockwise, activity levels the next, and recovery the one after that. On any given day, the tracker plots the user’s scores to create a compact portrait of their daily health habits.
When all metrics sit near the outer edge of the chart, the large, regular polygon signals a day where sleep, hydration, activity, and recovery all received attention. When one dimension lags, its point pulls inward and dents the shape on that axis. A user who slept poorly but stayed active and well hydrated sees this imbalance immediately, without comparing columns of numbers. Over a week, overlaying several days’ polygons shows how the shape shifts, revealing patterns such as consistently low recovery scores after high-activity days.
This single-layout approach suits the multi-dimensional way people think about wellness. Rather than reading four separate progress bars, the user absorbs the overall shape and its irregularities in one glance. Many tracker apps use this design to draw a morning readiness radar that summarizes overnight metrics and sets the tone for the day ahead, helping users spot which habit needs attention and which ones are holding steady.
Radar Chart
When a team wants to rate product features side by side, a radar chart places price, performance, durability, and other relevant attributes around a single circumference so that every product’s profile can be drawn across the same set of spokes. The plotting method begins with defining the attribute set and normalizing each scale, since raw units like dollars, benchmark scores, and months of expected life do not share a common range.
The strength of the format lies in how it exposes trade-offs. A low-cost product may pull its shape sharply toward the center on price while extending far outward on affordability, while a premium rival shows the reverse pattern along the performance and durability spokes. Viewing several polygons overlaid on one chart makes these category tensions immediately visible, showing where a product sacrifices ground to gain elsewhere.
Analysts often pair the plot with a table of underlying scores so viewers can read exact numbers, and they order the axes consistently across comparisons to keep the shapes comparable. Care is needed with axis scaling and axis ordering, both of which can alter the polygon’s silhouette. Used with those cautions, radar charts give product teams and shoppers a compact visual summary of multi-attribute comparisons and the compromises each option embodies.
Radar Chart
In dermatological and beauty assessments, a radar chart is often used to track core skin parameters—such as hydration, oiliness, and elasticity—simultaneously across a course of treatment. When a topical botanical formulation is applied over weeks or months, repeated measurements from each assessment point can be overlaid so that the polygon gradually shifts outward or inward on particular axes, giving clinicians and formulators an immediate impression of which skin qualities are responding and which remain unchanged.
Each parameter relies on a distinct instrument:
- Hydration is typically quantified with a corneometer, which measures the electrical capacitance of the stratum corneum.
- Oiliness is recorded with a sebumeter that assesses surface lipid levels.
- Elasticity is commonly evaluated with a cutometer, which applies suction and records how quickly skin returns to its original state.
Because these instruments produce values on different scales, the readings are normalized before plotting so that each axis is comparable. The resulting chart displays a multi-parameter profile rather than a single number, which is useful when a botanical extract is expected to influence moisture retention and barrier function together.
Plotting successive assessments on the same chart reveals trends that raw tables can obscure. A polygon that expands along the hydration axis while remaining stable on the oiliness axis suggests a formulation that improves moisture without increasing greasiness—an important balance for products marketed to combination skin. Overlay charts from baseline, midpoint, and endpoint visits let assessors compare individual participants or treatment groups and communicate results clearly to non-specialist audiences. Used alongside statistical analysis, the radar chart supports claims about the real efficacy of topical botanical formulations by showing how core skin parameters evolve over the full duration of a study.
Radar Chart
Survey data often arrives as a set of Likert scale responses covering several distinct customer satisfaction metrics, such as product quality, support responsiveness, pricing fairness, and ease of onboarding. Each metric carries its own average score, usually expressed on a common scale like 1 to 5 or 1 to 10. Placing each metric on its own spoke allows a radar chart to summarize the entire satisfaction profile at once.
Because every spoke begins at the same origin and follows the same scale, a reader can see instantly which metrics score high and which lag behind without scanning a table of numbers. The resulting outline often reveals patterns that isolated figures would hide, such as a company that excels on product quality but trails on support responsiveness.
When averages come from Likert data, the chart works best with a consistent scale and clear ring labels so that each radius corresponds to a defined score value. Metric names should sit at the end of each spoke to keep the reading order obvious. A single series shows one satisfaction profile, while overlaying two series—such as this year against last year—lets viewers compare profiles directly and see where the polygon has expanded or contracted.
Radar Chart
Radar charts offer HR managers a compact way to map an individual employee’s strengths across a defined set of competencies. Each competency occupies its own axis, and the resulting polygon becomes a recognizable signature of that person’s professional profile. When an HR manager plots several employees on the same grid, the comparison reveals patterns of strength and shortfall that might otherwise stay buried in spreadsheets or narrative performance reviews.
The real diagnostic value emerges when an employee’s polygon is overlaid against a target benchmark representing the expectations of a particular role. That benchmark may be drawn from a job competency model, an ideal profile for a promotion track, or the average scores of a high-performing peer group. The gaps between the two polygons point directly to development priorities. A broad inward pull along the communication and stakeholder-management axes, for example, signals where coaching or formal training would have the greatest impact, while areas where the employee’s shape already extends beyond the benchmark confirm existing strengths that can be leveraged or shared with the team.
Career development conversations benefit from this visual structure. HR managers can walk an employee through the chart and discuss concrete paths forward: which competencies to strengthen for a lateral move, which to deepen for a leadership role, and how training investments align with the employee’s ambitions. Because the chart summarizes many data points in one image, it keeps discussions focused on the overall profile rather than getting lost in isolated scores.
Radar Chart
A radar chart can also track stress and energy levels across a series of days, weeks, or months. Each axis can represent a single day, a time of day, or a distinct wellness dimension such as perceived stress, physical energy, sleep quality, and emotional balance. When a user logs a daily check-in, the accumulated polygons form a longitudinal record of how their internal state has shifted, making it easy to compare a high-energy Tuesday against a depleted Friday or see whether stress is pulling the outline outward on one side while energy collapses on another.
This longitudinal view becomes particularly valuable when lifestyle interventions enter the picture. Suppose a user begins an aromatherapy routine, perhaps diffusing lavender in the evening or using citrus blends during the workday. By logging stress and energy before and after the intervention period, the radar chart captures the resulting changes in shape. A polygon that was once spiky and irregular may gradually become rounder as stress and energy come into closer alignment.
The chart does not prove causation, yet it provides a structured way to observe correlations between a deliberate practice and the user’s felt experience. Over weeks, patterns emerge that might otherwise be lost in a linear list of numbers: a consistent dip in energy on days without the routine, or a steady easing of stress across the evening axes. This makes the radar chart a reflective tool, helping users connect daily habits with mood shifts and adjust their wellness strategies with greater awareness and evidence.
Radar Chart
When comparing multiple variables across several categories, standard column charts often reach their limits. A column chart positions each variable along a single horizontal axis, requiring the viewer to scan back and forth across a long row of bars. As the number of variables grows, this linear layout becomes cluttered and forces the viewer to mentally aggregate separate bars, which slows comprehension and increases the chance of misinterpretation.
Radar charts address this by placing all variables simultaneously in a compact, circular space. Beyond general multi-dimensional profiles, this layout offers two distinct advantages over linear bars:
- Cyclical data: For monthly sales, seasonal temperatures, or periodic performance metrics, the circular layout mirrors the cyclical nature of the data, placing the first and last variables adjacent to each other. This makes it easy to see patterns that repeat or wrap around—something a linear column chart cannot represent without awkward breaks or repetitions.
- Multi-series comparison: Overlaying a few polygons allows viewers to assess similarities and differences across profiles without scanning a dense forest of grouped bars or tracking complex bar positions across a wide horizontal axis.
While column charts are suited for simple magnitude comparisons, radar charts offer a more space-efficient way to showcase cyclical or multi-dimensional profiles.
Radar Chart
When a radar chart includes multiple series—especially more than three or four—the shaded areas that represent each group often overlap extensively. This overlap creates a dense, muddy visual field where colors blend and boundaries become indistinct. The result is a chart that is technically correct but practically unreadable, forcing viewers to squint and guess which area belongs to which series. Instead of facilitating comparison, the overlapping shapes obscure differences and exaggerate similarities.
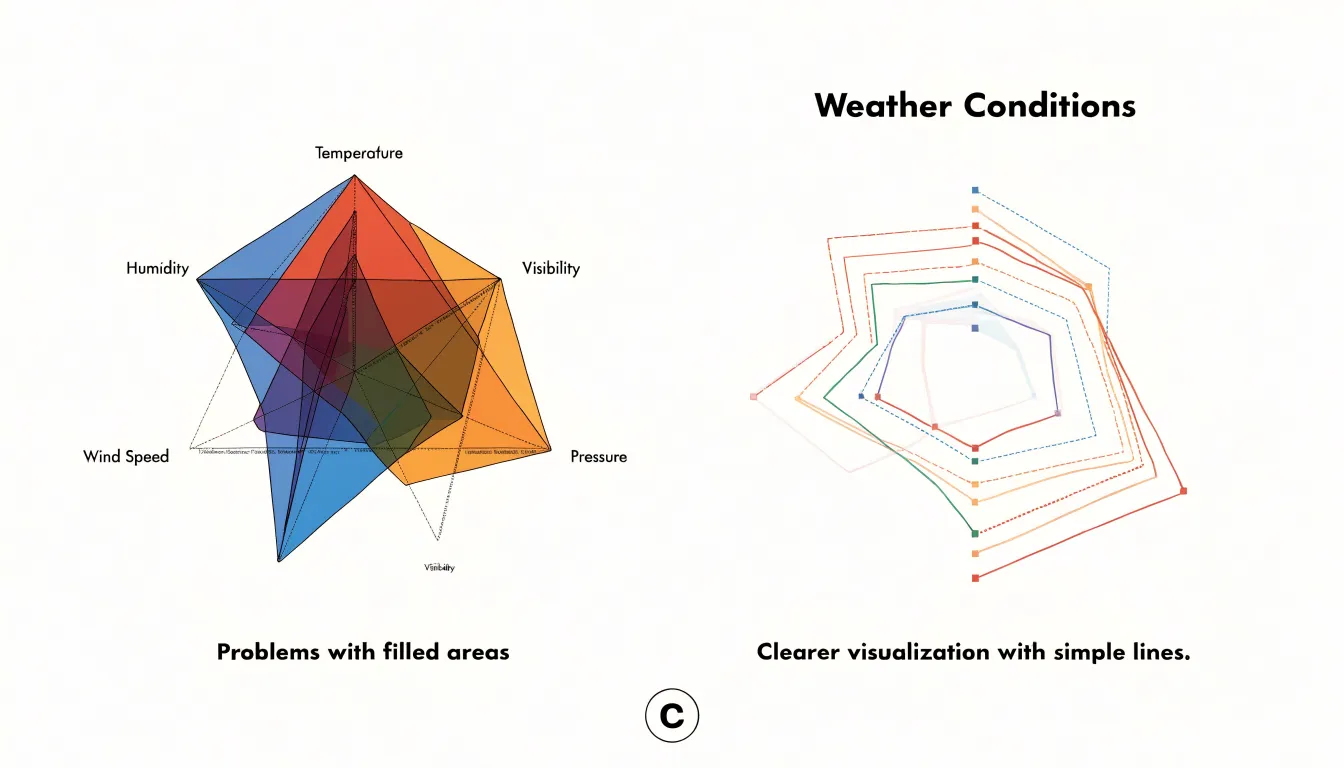
The problem intensifies with filled areas, which are common in radar charts:
- Color mixing: Each series is typically represented by a polygon filled with a semi-transparent color. When many such polygons are layered, the transparency causes colors to mix, producing new hues that are not in the legend. This can mislead viewers into perceiving relationships or groupings that do not exist.
- Layering bias: The order in which series are drawn affects which areas appear dominant, introducing a visual bias that depends on arbitrary layering choices rather than data significance.
- Line and vertex clutter: Each series contributes a jagged outline that crisscrosses with others, creating a spiderweb of intersections. Axis labels may become crowded, and data points may be hidden behind overlapping shapes. Tracing individual lines across the chart becomes error-prone as the number of series grows, sharply increasing cognitive load.
To mitigate these pitfalls, limit the number of series to a manageable few, use distinct line styles or markers instead of filled areas, or consider alternative visualizations such as small multiples or parallel coordinates.
Radar Chart
When a radar chart’s spoke scales are built with different increments, the polygon that connects the plotted points stops reflecting the underlying data in any honest way. Consider a chart with five spokes, where four of them run from 0 to 100 in steps of 20 while the fifth runs from 0 to 100 in steps of 10. A value of 60 lands at three-fifths of the way out on the first four spokes, but if the fifth spoke’s rings are mismatched, the point sits at a different physical distance from the center relative to its true proportion, making the shape bulge or contract toward that axis. Readers do not measure the tick marks; they absorb the silhouette. The polygon looks lopsided, and the eye reads that lopsidedness as a performance story that the numbers do not support.
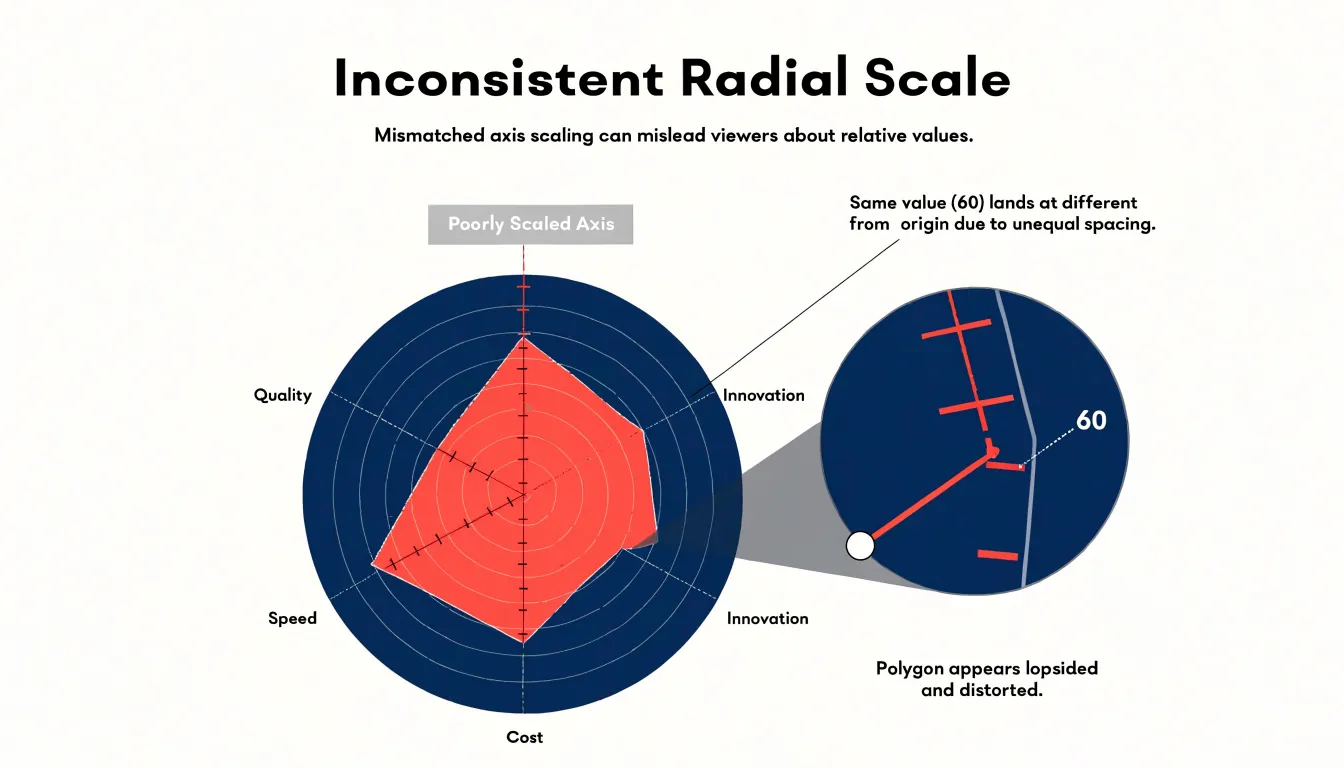
The distortion compounds when several axes are rescaled. If one spoke compresses a wide range into a short physical distance, high values on that axis sit close to the center and appear modest, while a different axis stretched across the same radius makes middling values look dominant. Two candidates with identical profiles can produce visibly different polygons purely because of how their axes were calibrated. The chart then compares scale choices rather than entities. Worse, inconsistent intervals break the geometric logic that makes radar charts readable at all, since equal distances no longer represent equal changes.
Guarding against this begins at the design stage:
- Give every spoke the same minimum, the same maximum, and the same number of intervals, ideally anchored at zero so that distance from the center maps proportionally to magnitude.
- Where variables genuinely use different units, normalize them before plotting or state the shared scale explicitly.
- Check tick labels on each spoke during review rather than trusting the outline, because the polygon will always look coherent even when its axes are not.
Radar Chart
The enclosed polygon of a radar chart fills the space between the axes, making this region the most visually dominant element of the chart. This creates a geometric bias: a shape with a larger overall footprint tends to capture attention and appear more substantial, even when the individual point values along the axes are identical or only marginally different.
The polygon area grows nonlinearly as points move outward, because the region expands in multiple directions at once. A small shift on several axes can produce a shape that looks dramatically larger, while the same total shift concentrated on a single axis may barely register. Viewers typically judge the filled shape as a whole before examining any individual axis, so the total area drives the initial impression.
Furthermore, two series with matching average or maximum values can enclose very different areas depending on how values are distributed across adjacent axes. Because the area of each triangle formed by two adjacent spokes and the center depends on the product of the two adjacent values, placing high values next to each other creates a much larger polygon than alternating high and low values around the circle. The visual weight therefore depends on axis ordering and spacing rather than the data itself.
This bias intensifies when multiple series are overlaid, since a shape with slightly higher values across several adjacent axes can cover or crowd out the others and appear to dominate the comparison. Because the enclosed area has no stable, linear relationship to the plotted values, relying on shape size introduces a systematic distortion that favors whichever series happens to have the more expansive outline.
Radar Chart
Axis labels are the interpretive key to a radar chart, so their placement deserves deliberate attention. Each spoke carries two kinds of text: the category name that identifies the variable, and the scale markers that show values along the axis.
For category labels:
- Position them just beyond the outer edge of the chart, keeping a consistent gap between the outermost gridline and every label so the chart reads as one coherent object.
- Anchor horizontal text at the left for spokes pointing west and at the right for spokes pointing east, keeping the text upright rather than rotated. Angled or upside-down labels slow reading considerably, especially on multi-spoke charts, so favor horizontal orientation wherever the spoke count allows it.
- When categories cluster near the top or bottom of the circle and labels collide, offset them slightly with leader lines or vary their distance from the perimeter to separate them.
- If a category name is long, wrap it onto two lines rather than extending it far outward, and reserve abbreviated forms only when a legend or footnote defines them.
For scale markers:
- Place them inside the plot area, running along one or two spokes (such as a single vertical spoke) rather than every spoke, giving readers a reference without cluttering the field.
- Choose three to five tick values at round numbers, and align them to the same side of the spoke for consistency. Light gridline rings can carry the values at their intersections, letting the markers sit quietly against the data.
- For dense charts, consider labeling only the outermost ring along with an intermediate tick.
- Verify contrast and font size against the filled polygons behind the labels, since overlapping series can obscure text that otherwise looks well placed.
Radar Chart
Radar charts work best when you need to assess a balanced profile across a fixed set of comparable variables, spot strengths and weaknesses relative to a benchmark, or compare a few subjects on the same criteria. Typical fitting cases include skill assessments, product comparisons on consistent attribute scales, and performance dashboards where the number of variables is small to moderate and each measures something of similar importance and range.
A short checklist helps decide when the radar format serves this purpose well:
- Use a radar chart when: the variables are bounded and standardized on a shared scale, the number of axes stays modest, overall profile shape or cyclical continuity matters more than exact values, the number of overlaid series is three or fewer, and the audience is familiar with the convention.
- Avoid a radar chart when: axes mix incompatible units without normalization, many variables crowd the perimeter, precise comparisons between individual values are required, arbitrary axis ordering would distort the area, or several overlapping series would obscure one another.
Parallel coordinates offer a strong alternative when a radar chart falls short. In a parallel coordinates plot, each variable gets its own vertical axis arranged in a row, and connected lines trace each subject’s values across those axes. That layout supports many more variables without perimeter crowding, preserves exact readings along uniform vertical scales, eliminates radial area distortion, and scales better to dense multivariate data. The choice comes down to intent: a radar chart emphasizes the closed, balanced profile of a single subject or a few subjects, while parallel coordinates emphasize relationships, clusters, and trade-offs across many dimensions.
Frequently Asked Questions
What is a radar chart?
A radar chart—often called a spider chart, spider web plot, or web chart—uses a central origin for the zero or minimum value, equally spaced spoke axes for each variable, and a closed polygon formed by connecting the plotted points. Its foundational geometry consists of the central origin, the evenly spaced axes, and the connected polygon that encodes the data.
How do you read values on a radar chart?
To read a value, follow the axis for a given variable outward from the center and note where the plotted point falls relative to the concentric rings. Because every axis shares the same rings, magnitudes on one axis can be compared directly with magnitudes on another; ring labels anchor distances to concrete numbers, but without labels the exact values remain ambiguous.
How is a radar chart used in perfume composition?
Perfumers and essential oil brands categorize materials into top, middle, and base notes and assign each category an intensity value based on concentration, volatility, and perceived strength in a trial blend. When plotted, each fragrance becomes a polygon whose shape reveals the overall balance of the composition.
How do wearable health trackers use radar charts?
They can plot daily metrics such as sleep quality, hydration, activity levels, and recovery indicators on separate spokes to create a compact portrait of daily health habits. Metrics near the outer edge signal a large, regular polygon, while a lagging dimension pulls inward and dents the shape on that axis. Overlaying several days’ polygons shows how the shape shifts and can reveal patterns.
Why can a radar chart with multiple series be hard to read?
When a radar chart includes multiple series—especially more than three or four—shaded areas can overlap extensively, colors can mix, layering can introduce bias, and line and vertex clutter can make tracing individual series error-prone. To mitigate these pitfalls, limit the number of series, use distinct line styles or markers instead of filled areas, or consider alternatives such as small multiples or parallel coordinates.
When should you not use a radar chart?
Avoid a radar chart when axes mix incompatible units without normalization, many variables crowd the perimeter, precise comparisons between individual values are required, arbitrary axis ordering would distort the area, or several overlapping series would obscure one another. Parallel coordinates are a strong alternative when a radar chart falls short, especially for many variables or dense multivariate data.
Tony Astor
Tony writes about data visualization and the tools people use to build charts and dashboards. More about Data Illustrator