Preattentive Attributes: What the Eye Notices First
 By Tony Astor ·

Preattentive Attributes
Preattentive attributes are visual cues—color, brightness, size, shape, orientation, position, motion, enclosure, line weight, curvature, and density—that the brain processes instantly, before conscious reading begins. Designers use them to guide attention, establish visual hierarchy, and direct the eye to key elements first. Used with restraint, they shape visual flow and speed comprehension.
Table of Contents
Color
Before a reader consciously parses a headline or reads a single word, the visual system has already registered hue and contrast, sorting a scene into elements that stand out and elements that recede. Because this happens in the earliest moments of perception, color choices deserve deliberate thought whenever key information needs to be found quickly.
Distinct hues are especially effective at pulling focus. When most of a layout sits in muted or neutral tones, a single saturated color becomes a natural landing point for the eye. A warm accent on a call-to-action button, a colored bar beside an important statistic, or a highlighted term within a paragraph draws attention because it differs from everything surrounding it. The principle works through difference rather than brightness alone: a modest but unusual hue can outperform a loud color used everywhere.
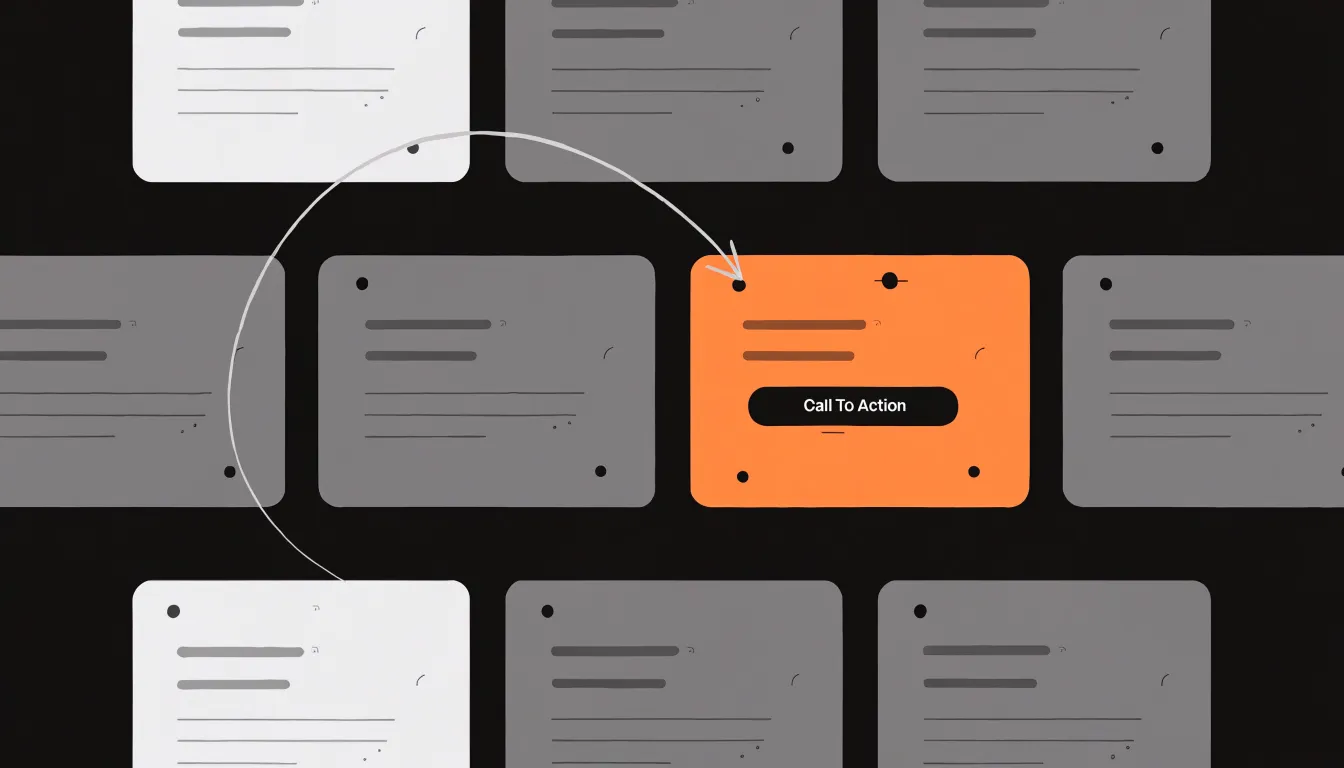
Contrast operates alongside hue. Strong differences in lightness between text and background, or between a foreground element and its surroundings, create clear edges that the eye detects almost instantly. Dark text on a light field, or a high-contrast label against a tinted panel, gives the viewer a firm anchor. Low-contrast combinations blur boundaries and push information into the background, which suits secondary material but works against anything meant to be noticed first.
To put these principles into practice:
- Choose a small number of accent colors and reserve them for genuinely important elements so the signal retains its meaning.
- Test colors against their actual surroundings, since an accent that stands out on a white page may disappear on a tinted one.
- Keep body text in calm, readable tones and let accents do the pointing.
Used with restraint, color guides the reader’s eye to what matters without overwhelming the page.
Brightness
The human visual system registers differences in luminance faster than almost any other stimulus, automatically sorting a scene into lighter and darker zones within a fraction of a second and assigning importance to whatever stands out.
Varying luminance levels creates a natural visual hierarchy. When one element is markedly lighter or darker than everything around it, the eye treats that difference as a signal of significance and travels toward it first. Softer gradations produce gentler hierarchies, where secondary and tertiary elements recede in measured steps while remaining legible. By controlling the range of shades across a layout, a designer can draft a path for the gaze, moving it from the most prominent element down through supporting content in the intended order.
This principle is especially powerful for calls to action. A high-contrast button—whether a bright shape set against a muted background or a dark element against a light field—pulls the eye directly to the point of interaction. Even on a crowded screen holding text, imagery, and navigation, a single high-contrast shade can guide a reader’s gaze straight to the critical action without arrows, motion, or additional decoration.
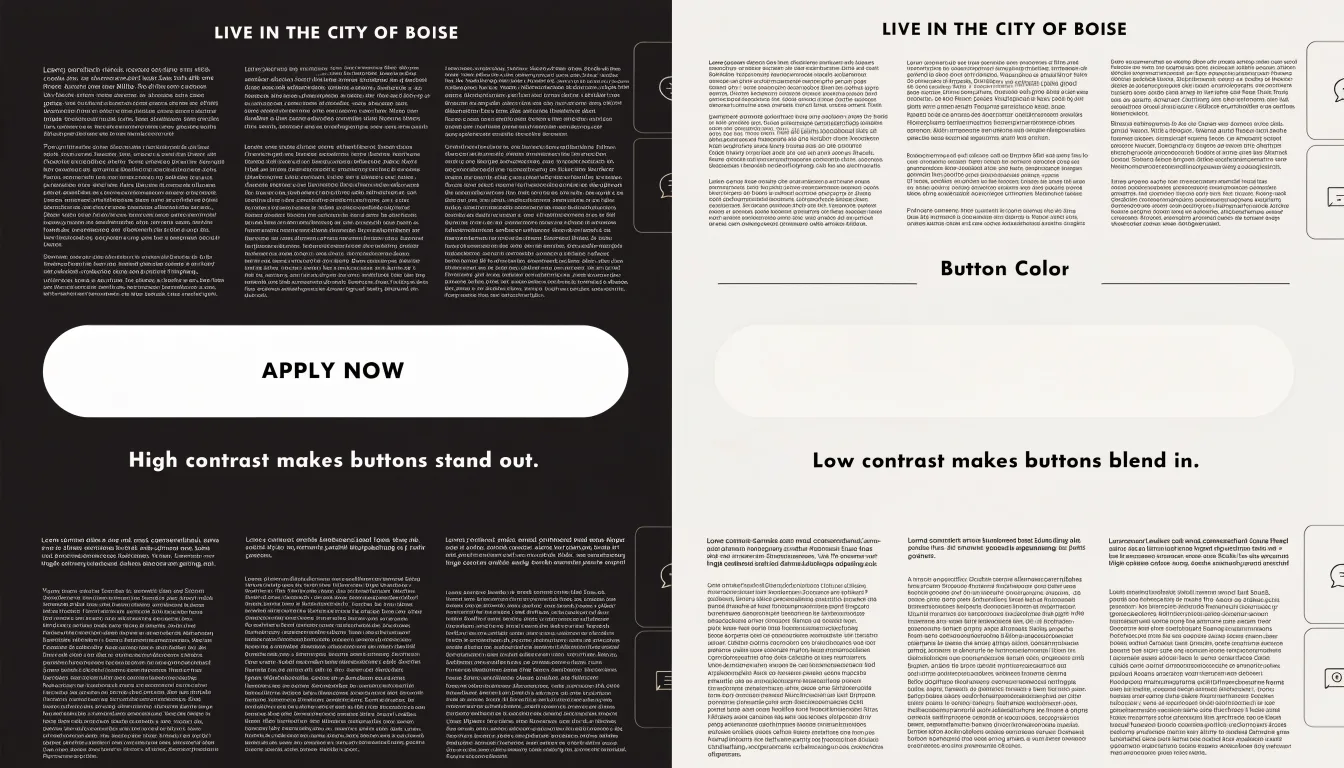
Used deliberately, brightness does the work of emphasis quietly and efficiently, letting the underlying structure of light and dark organize attention.
Size
Because the visual system registers relative scale before deliberate reading begins, viewers interpret a noticeably larger element as a statement about importance. Strategic variation in scale therefore signals hierarchy, guiding the eye from the most significant content toward supporting detail in a natural sequence.
Headers offer the clearest application of this principle. A primary heading sized well above body text announces the entry point for a section, while subheadings occupy an intermediate scale that marks a shift in topic without competing for first attention. Keeping the steps between levels distinct and consistent lets readers infer structure at a glance.
Key callouts benefit from the same logic. A statistic, a pull quote, or a critical instruction can be enlarged relative to surrounding copy so that it interrupts normal scanning and draws the eye. The enlargement should reflect genuine importance; when many elements are inflated, the contrast dissolves and the cue loses its power.
Images follow comparable guidelines. A dominant image anchors a layout and establishes the emotional tone of a page, while smaller supporting images sit lower in the visual order. Matching image scale to the weight of the accompanying message keeps the composition coherent.
Across all of these cases, differences in size should be large enough to read instantly as deliberate, and the resulting order should match the priority of the content itself. Used with restraint, scale turns a flat arrangement of elements into an intuitive scanning path.
Shape
When a field of elements shares a common form, the eye settles into a rhythm of expectation, scanning across circles, squares, or bars without pause. Introduce a single triangle, star, or diamond among them, and that rhythm breaks. The novel form registers almost instantly, pulling attention toward the element it marks. This is the core mechanism behind using shape to flag important data points: the deviation itself carries the signal.
In practice, a dashboard crowded with uniform circular markers can highlight an outlier by rendering it as a distinctive shape. A map filled with identical point symbols can call out a location of special interest with a different glyph. Repetitive content blocks—whether rows in a table, cards in a grid, or entries in a timeline—become far easier to navigate when one item carries a unique silhouette. The shape becomes a visual anchor that the viewer can locate at a glance to orient themselves within the surrounding pattern.
Designers often combine shape variation with cues like color or size, yet shape alone frequently suffices because it survives conditions that weaken other cues. It remains legible in grayscale, at small scales, and for viewers with color vision deficiencies. Reserve distinctive shapes for genuinely important markers, keeping the vocabulary small and consistent so that each shape retains a stable meaning. Used with restraint, geometric variation turns visual monotony into a structured field where the eye knows where to land.
Orientation
Orientation refers to the perceived angle or alignment of a visual element. Our perceptual apparatus is finely tuned to detect deviations in orientation because horizontals and verticals dominate the built and designed world. When a line or shape appears slanted against a field of expected horizontals, it registers as a distinct signal that pulls the eye automatically, much like a single tilted stroke stands out among a grid of upright ones.
In layout design, most reading environments establish a strong horizontal baseline through text blocks, columns, and aligned edges. Introducing a diagonal element into that field creates a controlled disruption. Because the tilted line registers as different at a preattentive level, it captures immediate interest and momentarily redirects the gaze. This is why angled rules, slanted dividers, or tilted graphic accents can draw attention to a headline or key message without bright color or heavy weight.
Beyond simple disruption, angled lines can direct reading pathways dynamically. A diagonal establishes a direction of travel, guiding the eye from one part of a composition toward another along an active, energetic path. Where horizontal lines suggest calm, steady progress from left to right, slanted lines imply motion and create a sense of speed or ascent. Designers can use this effect to lead viewers from an entry point toward a focal message, connect separated elements, or build forward momentum across a page. The goal is measured use: a single well-placed diagonal captures interest and guides the eye, while many competing angles fragment attention and undermine clarity.
Position
Placement within a layout determines where attention lands first. Research on eye movements shows that readers do not scan a page uniformly; instead, they follow predictable, automatic patterns shaped by thousands of hours of reading experience:
- F-shaped pattern: On text-heavy pages, the eyes move in a horizontal sweep across the top, a shorter horizontal sweep a little lower, and then a vertical scan down the left side.
- Z-shaped path: On pages with less text or a stronger visual hierarchy, the eyes often move from top-left to top-right, diagonally down to bottom-left, and finally across to bottom-right.
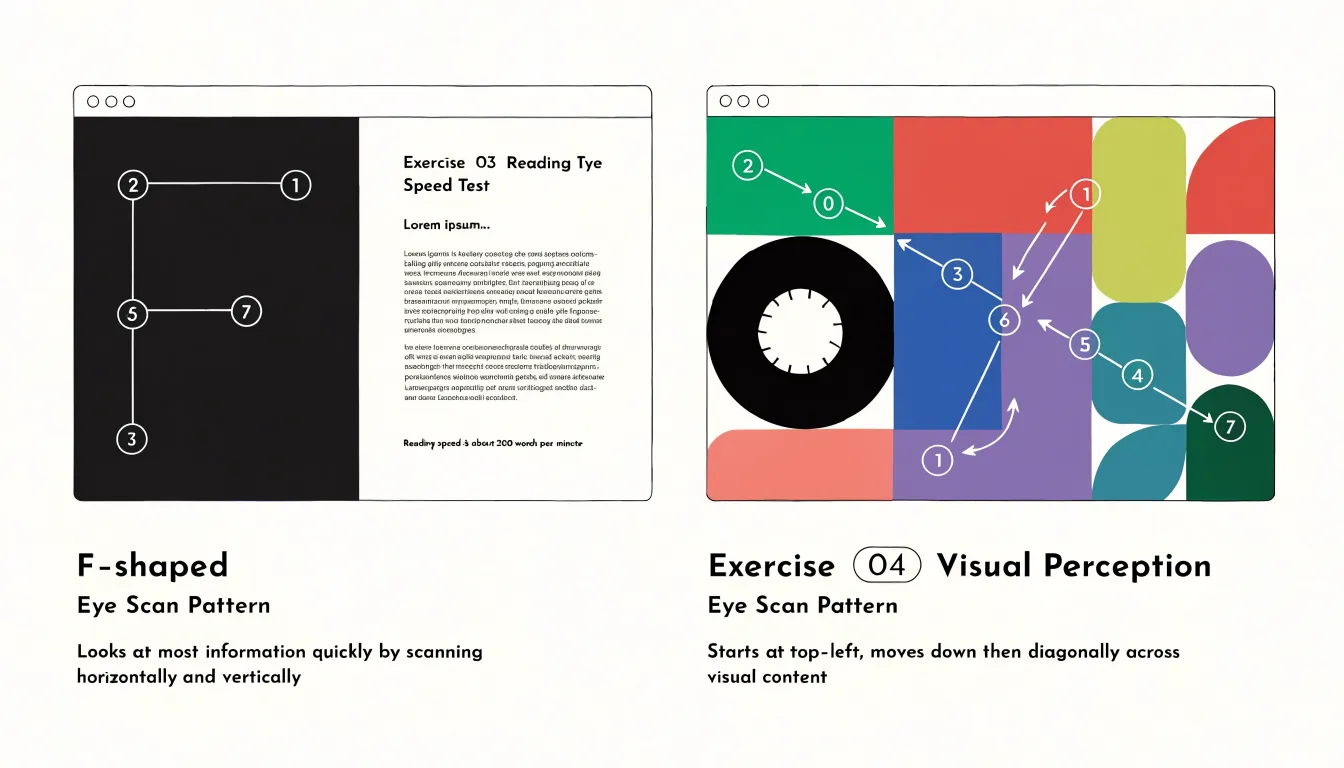
Designers can leverage these natural scanning behaviors by placing the most important elements where attention is most likely to land. The top-left corner and upper horizontal band receive the earliest and most sustained attention; placing a headline, key call to action, or critical information here takes advantage of the first sweep of the F-pattern. For Z-pattern layouts, the top-right and bottom-right corners serve as natural anchor points, making them ideal for secondary calls to action or navigation elements. The center of the page, while not the first stop, often receives focused attention once the initial scan is complete, making it a strong position for primary content or imagery.
Strategic placement also involves understanding prime screen real estate—the areas of a page most visible without scrolling and within the natural flow of the reader’s scan. Elements placed here benefit from higher engagement because they require less effort to find. Conversely, elements in the lower-left region or along the far right edge may be overlooked entirely, as they fall outside dominant scanning paths. Positioning key elements along the routes the eyes already travel increases the likelihood that important content is seen and acted upon.
Motion
The human visual system is wired to notice change. Our peripheral vision is especially sensitive to movement—a survival mechanism that once helped us detect predators and still causes our attention to snap toward anything that shifts, slides, pulses, or fades. Because this happens below the level of deliberate attention, motion can guide focus effectively, though it can just as easily become a distraction.
Micro-animations harness this tendency in small, purposeful ways. A button that subtly depresses when pressed, a notification badge that gives a gentle pulse, a panel that slides into view as the user scrolls, or a loading indicator that rotates steadily all provide motion cues that confirm an action occurred or signal where to look next. These cues operate subconsciously, helping users track state changes without reading or interpreting anything. A well-placed transition can make an interface feel responsive and smooth the mental jump between views.
Restraint is essential:
- Keep motion brief, usually a few hundred milliseconds, and tie it to a clear functional purpose such as confirming input, directing attention, or showing a relationship between elements.
- Avoid looping or decorative animations that run continuously, as they compete for attention and irritate users trying to read or complete a task.
- Avoid animating large areas of the screen at once, provide reduced-motion alternatives for users who prefer them, and keep easing gentle so movement feels natural rather than abrupt.
Used sparingly, motion sharpens focus; overused, it fragments it.
Enclosure
Enclosure leverages the Gestalt principle of grouping to help users perceive related elements as a single unit. By drawing a border around a set of items or placing them on a shared background card, you create a visual container that signals commonality. This taps into the brain’s innate tendency to group elements that are physically close or share a common region, allowing users to grasp the structure of information almost instantly.
When used effectively, enclosure simplifies complex layouts by reducing the number of distinct visual elements a user must process. For example, a form with fields grouped into sections using subtle borders or background cards makes it easier to scan and understand relationships. Users can quickly identify which labels belong to which inputs and recognize logical groupings such as personal details, billing information, or preferences, reducing cognitive load and speeding up comprehension.
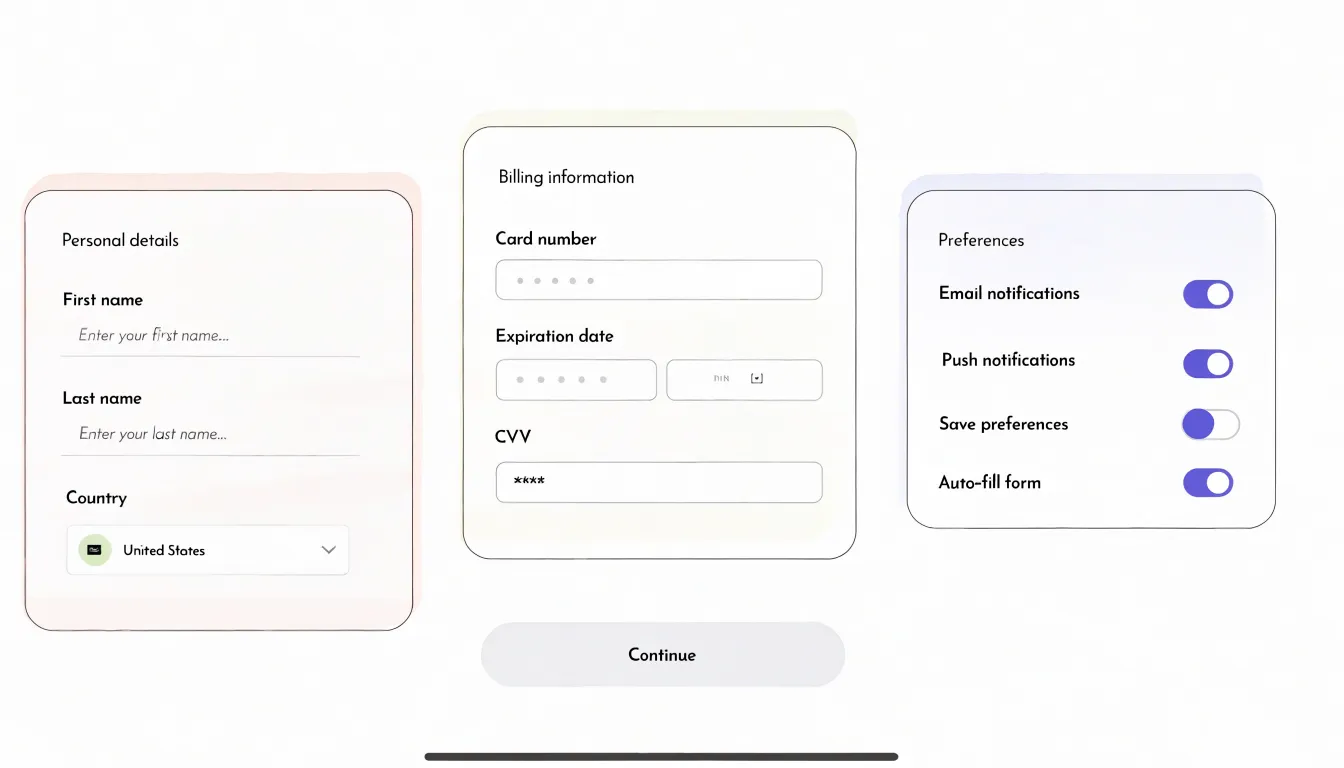
Enclosure also highlights important information. A card with a contrasting background or border can draw attention to a call to action, a warning message, or a key metric. The key is judicious use—overusing borders and cards creates visual clutter and dilutes the effect. Subtlety is often more effective than heavy lines; a light background shade or a thin border is enough to create a clear grouping without overwhelming the design.
In interface design, enclosure works alongside proximity and similarity. Whether in a dashboard with widgets in separate cards or a settings page with grouped options, enclosure helps users navigate and process information with minimal friction.
Line Weight
Line weight refers to the thickness of a stroke, offering a direct tool for establishing visual priority without relying on color, imagery, or type size. When strokes vary in thickness, the eye reads that variation as a signal of importance, moving first to the heaviest marks and then settling on the lighter ones.
In practice, a bold line functions as a primary divider, marking the boundary between major sections of a page or screen and telling the viewer where one large content area ends and another begins. A delicate line operates at a quieter level, separating sub-elements within a section—such as individual list items, captions, or supporting details—without competing with bolder divisions above it.
Using a range of weights creates a clear visual structure that mirrors the content’s organization:
- Bold strokes mark primary divisions.
- Medium strokes mark secondary divisions.
- Fine strokes separate tertiary details.
This approach conserves space and reduces clutter because boundaries are communicated by thickness rather than by heavy backgrounds or boxes. Consistency strengthens the effect: when the same weight always signals the same level of division, viewers learn the pattern quickly. A restrained palette of two or three weights typically provides enough contrast to distinguish levels while keeping the design coherent.
Curvature
Curvature shapes both how users feel and where they look. Soft, rounded forms are processed fluently, often evoking calm, friendliness, and approachability. Sharp angles and straight lines signal urgency, precision, or alertness, drawing attention through a sense of tension. Designers can use the contrast between these qualities to set a mood and direct focus.
In practice, organic curves—such as rounded buttons, circular avatars, and flowing illustrations—create a comforting atmosphere. They reduce perceived threat and encourage exploration, making them suitable for onboarding, wellness, and social contexts. Geometric sharpness—such as square cards, triangular arrows, and angular icons—conveys efficiency and directs the eye with authority, making it effective for calls to action, warnings, and data-heavy interfaces where clarity and speed matter.
Balancing organic and geometric shapes is key. A layout dominated by sharp angles can feel aggressive or cold, while an excess of curves may seem vague or overly casual. A common approach is to use curves for containers and backgrounds to soften the overall experience, while reserving sharp accents for interactive elements that need to stand out—such as a rounded card featuring a sharply angled icon.
Designers can also vary curvature within a single element. A button with gently rounded corners feels inviting, whereas a button with sharp corners demands immediate action. Aligning curvature with the intended tone of each screen and the actions you want users to take ensures the visual language supports both comfort and clarity.
Density
Density describes how tightly or loosely information is packed within a layout. When elements sit close together, the eye reads them as a single unit; when space opens up between them, the eye treats each cluster as distinct. Varying proximity across a page creates focal points almost effortlessly: a dense block of text or imagery naturally draws the eye first, while generous white space around a headline or key figure isolates it and amplifies its importance.
Spacing also provides structure. Grouping related items through proximity signals shared meaning, so a caption placed close to its image reads as belonging to it, while a wider gap announces a new topic. Consistent gaps between sections build rhythm and help readers navigate longer content without fatigue, letting them locate categories, controls, or highlights through layout rather than labels alone.
Controlling density requires restraint. Visual clutter accumulates when too many elements compete within the same space, and each additional item dilutes the prominence of the rest. By thinning out secondary content, removing decoration, and reserving open space around essential highlights, you protect the elements that matter most. A single call to action surrounded by white space will consistently outperform one buried among competing details.
Combining Attributes
Visual attributes such as color, size, and shape can be combined to reinforce one another, guiding attention to the most important elements first and then to secondary information. For example, giving a key data point a distinct color, a larger size, and a unique shape ensures that it stands out even in a complex display.
Effective combination relies on moderation and consistency:
- Limit each element to two or three differing attributes: Overloading a single element causes visual clutter and increases cognitive load. If color distinguishes categories, varying size within those categories can indicate magnitude, while shape is reserved for a dimension like status or type.
- Align combinations with the intended hierarchy: Give the most critical element the strongest combination of cues, and use subtler differences for less important elements.
- Maintain consistency across the display: If a color denotes a specific category, apply it uniformly everywhere.
When stacking attributes, test the display by viewing it from a distance; the key elements should still pop out without overcomplicating the layout.
Accessibility
Visual perception varies widely across any audience, and contrast is the foundation of accessible design because every visual cue depends on the difference between foreground and background to register. WCAG provides concrete thresholds calculated from relative luminance:
- Normal text: Requires a contrast ratio of at least 4.5:1 against its background.
- Large text (18 point regular or 14 point bold): Requires at least 3:1.
- Non-text elements (icons, borders, focus indicators, chart lines): Require at least 3:1 against adjacent colors so they remain distinguishable.
Free contrast checkers make verifying these ratios simple during design and development handoff.
Beyond numeric ratios, visual cues must survive color vision deficiencies. Red-green deficiencies are the most common, so any design relying on red versus green alone will fail for many viewers. The remedy is redundancy: pair color with shape, pattern, position, or direct labels. A status indicator can combine a colored dot with a distinct glyph and a text label; a line chart can vary dash patterns alongside hue; error states can use an icon and message text rather than a red border alone. Testing tools that simulate deuteranopia, protanopia, and tritanopia reveal where color carries meaning by itself.
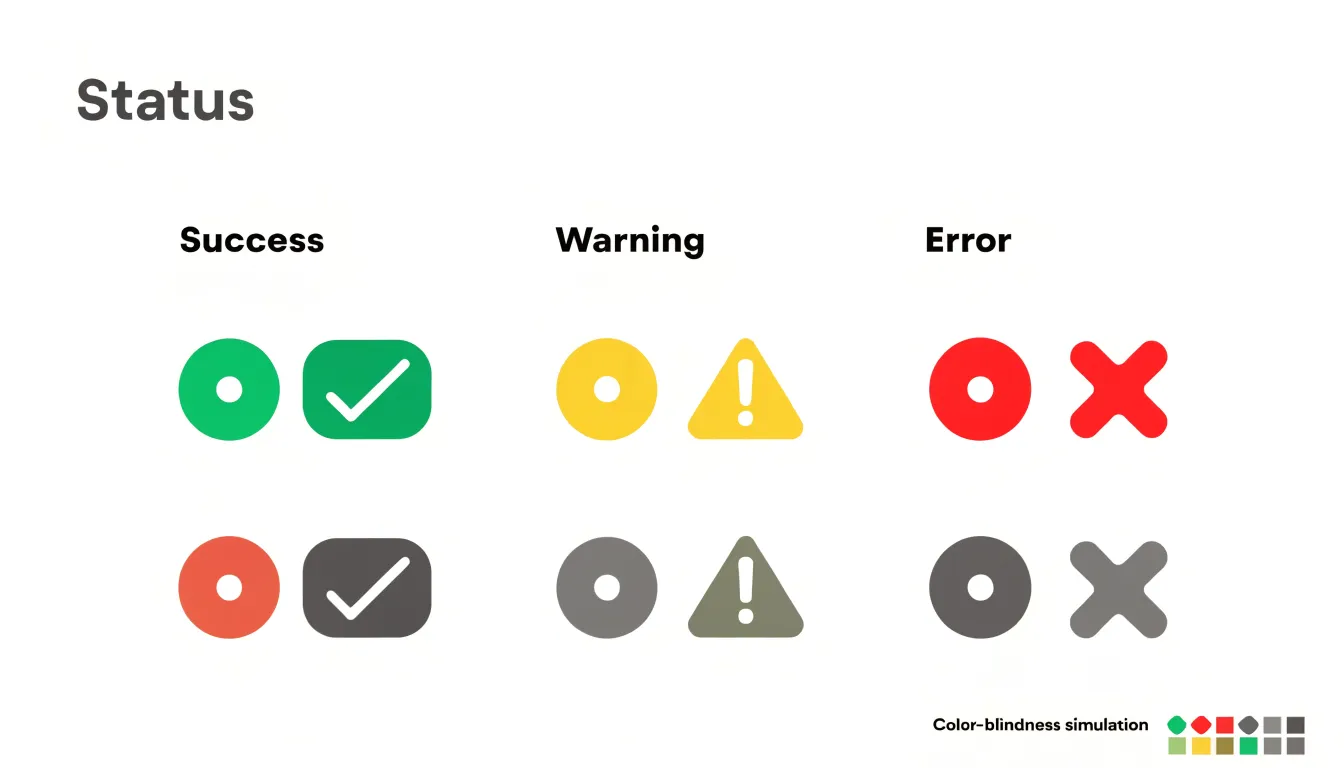
Practical implementation begins early, while palettes are still fluid. Define a contrast-checked color system, document approved pairings, and build contrast validation into component reviews. Check hover, focus, disabled, and dark-mode states, as these are frequently overlooked. Pairing automated audits with manual review and testing by users with diverse vision ensures the design holds up in real use.
Testing Designs
Once a design is drafted, two lightweight methods can verify that its visual hierarchy guides attention as intended:
- The five-second test: Show a design to a participant for five seconds, hide it, and ask what they remember—what stood out, what the page was about, and what action they would take next. Because preattentive processing is nearly instantaneous, this brief exposure captures the elements that dominate initial perception. If the intended focal point is not among the first things mentioned, the hierarchy needs adjustment.
- The blur test: Apply a Gaussian blur to the design until text becomes unreadable, then observe which regions still draw the eye. At this level of abstraction, only color, contrast, size, and position remain, revealing whether the most important element holds visual weight or gets lost among competing shapes.
Both tests require minimal tools and can be repeated with a handful of users to spot consistent patterns. The resulting feedback is directly actionable: if a secondary button attracts more attention than the primary call to action, you can increase the primary button’s contrast, adjust its size, or reposition it. If the page’s purpose is unclear after five seconds, the headline or main visual likely lacks prominence. Running these checks early and often lets teams refine designs iteratively and avoid costly redesigns later.
Visual Flow
Visual flow is the path a reader’s eye travels across a page, shaped by how preattentive attributes work together. A strong layout arranges signals so they reinforce one another rather than compete: a single saturated color in a muted composition provides the entry point, size and weight draw the gaze from the headline down through supporting text, and elements aligned along a shared axis create an implied line the eye follows naturally.
Balance is the counterweight to direction. A page that pulls attention hard toward one corner feels unstable, and readers sense that imbalance even when they cannot name it. Distributing visual weight across the composition—through mirrored contrast or offset masses of text and image—keeps the layout feeling settled while still allowing deliberate emphasis. Symmetrical arrangements convey calm and order, while asymmetrical arrangements create dynamism and motion; either can serve a conversion goal depending on the required tone.
Synthesizing these attributes means choreographing them so the sequence feels seamless. Calls to action benefit from convergence: a distinctive color, a clear size relationship, isolation through surrounding whitespace, and a terminal position at the end of the reading path all point the same way. When every preattentive cue agrees, the reader arrives at the conversion point without friction.
Frequently Asked Questions
How do I use color and contrast to make important information stand out?
Use a small number of accent colors and reserve them for genuinely important elements, since a distinct hue stands out in a muted layout. Strong differences in lightness between text and background, or between a foreground element and its surroundings, create clear edges that the eye detects almost instantly.
How should I use size to create a visual hierarchy?
Make primary headings noticeably larger than body text and use intermediate sizes for subheadings so readers can infer structure at a glance. Keep the steps between levels distinct and consistent, and enlarge elements only when they reflect genuine importance.
Where should I place key content based on how people scan a page?
On text-heavy pages, readers tend to follow an F-shaped pattern; on pages with less text or a stronger visual hierarchy, they often follow a Z-shaped path. The top-left corner and upper horizontal band receive early attention, while the lower-left region and far right edge may be overlooked.
How can I use motion without distracting users?
Keep motion brief, usually a few hundred milliseconds, and tie it to a clear functional purpose such as confirming input or directing attention. Avoid looping or decorative animations, avoid animating large areas at once, provide reduced-motion alternatives, and keep easing gentle.
What contrast ratios should accessible designs meet?
Normal text requires a contrast ratio of at least 4.5:1 against its background, while large text requires at least 3:1. Non-text elements such as icons, borders, focus indicators, and chart lines require at least 3:1 against adjacent colors.
How can I test whether a design’s visual hierarchy is working?
Use the five-second test to see what participants remember after a brief exposure, and use the blur test to observe which regions still draw the eye when text becomes unreadable. If the intended focal point is not among the first things noticed, the hierarchy needs adjustment.
Tony Astor
Tony writes about data visualization and the tools people use to build charts and dashboards. More about Data Illustrator