Population Pyramid: What It Shows and How to Read It
 By Tony Astor ·

Population Pyramid
A population pyramid is a paired bar chart showing the age and sex structure of a population, with age groups stacked vertically from youngest at the base to oldest at the top and males and females mirrored on either side of a central axis. Its shape reveals birth rates, mortality, migration, and historical events.
Table of Contents
Population Pyramid
A population pyramid is a graphical representation of the age and sex composition of a population. The chart takes its name from the triangular shape it often assumes when a population is growing rapidly, with a broad base of young people tapering to a narrow top of elderly individuals.
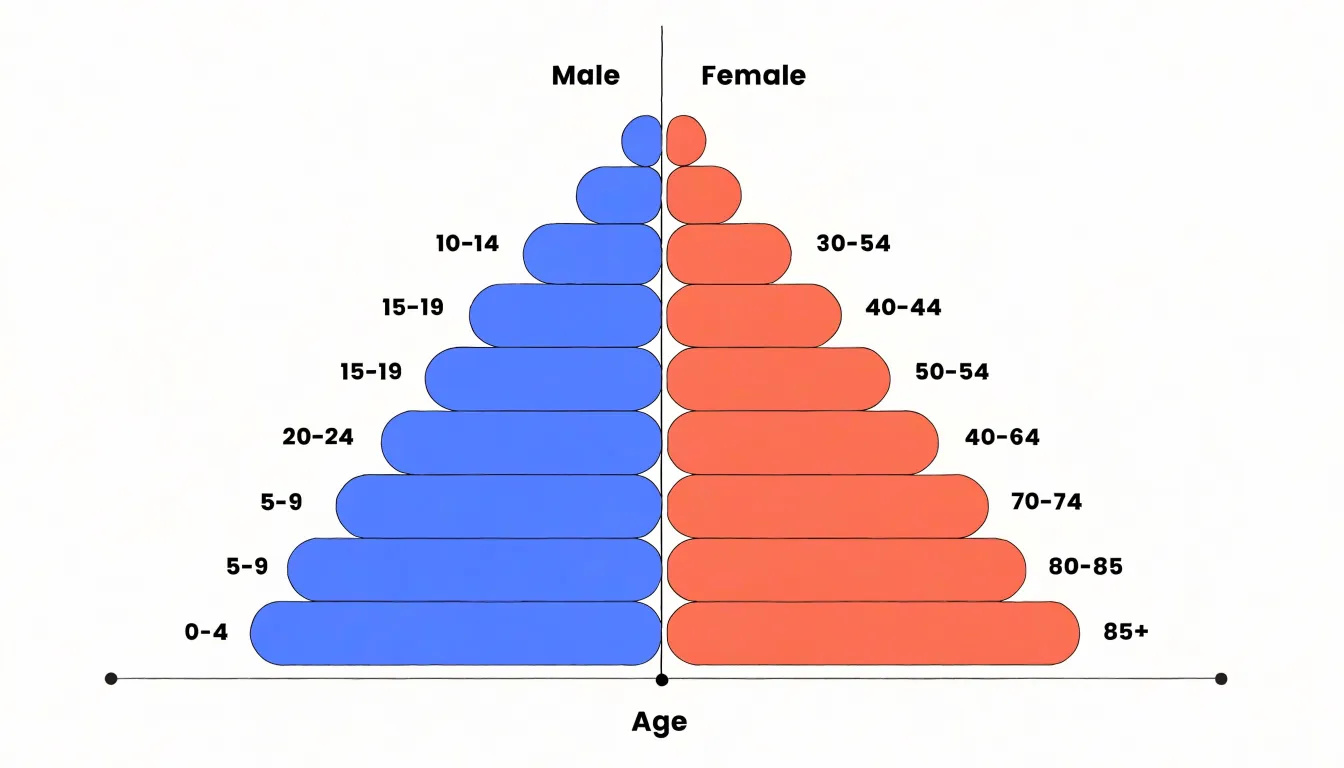
The vertical axis represents age groups, usually arranged in five-year bands such as 0–4, 5–9, and so on, with the youngest group at the bottom and the oldest at the top. The horizontal axis represents the number or percentage of people in each age group. This horizontal axis is typically split at the center, with one side displaying males and the other side displaying females, allowing readers to compare the two sexes at a glance within every age band.
When reading a population pyramid for the first time, several key indicators stand out:
- Base width: Reveals the size of the youngest cohort relative to the rest of the population, reflecting recent birth rates. A wide base signals high fertility, while a narrow base suggests declining birth rates.
- Slope of the sides: Shows how quickly each cohort diminishes with age, reflecting mortality patterns and survival into older age. A steeply narrowing shape points to high mortality or limited survival, whereas a more rectangular profile indicates longer life expectancy and a larger elderly population.
- Bulges or indentations: Often mark historical events such as wars, famines, migration waves, or baby booms that affected specific cohorts.
- Symmetry between sides: Highlights sex differences in survival, with women generally outnumbering men at older ages.
Together these features make the pyramid an efficient tool for summarizing a population’s demographic profile and anticipating its future needs.
Population Pyramid
A population pyramid arranges its horizontal bars so that males occupy the left side and females the right, a convention that has held steady across statistical agencies, textbooks, and census publications for well over a century. The layout draws on a long-standing graphical habit in which paired quantities are mirrored around a central axis. Placing the sexes on opposite sides lets the eye measure the symmetry or asymmetry of the shape without consulting a table. The choice of left for males and right for females is largely arbitrary in origin but has become standardized through repetition, and international bodies such as the United Nations publish their pyramid templates in this arrangement, reinforcing the convention wherever demographic data is taught or displayed.
Beyond the visual layout, the pyramid captures the sex ratio—the number of males per hundred females—and its typical patterns across the life course. At birth, boys slightly outnumber girls in most populations, with a ratio near 105 to 100, so the base of the pyramid often shows a marginally longer male bar.
Mortality then works in the opposite direction: males experience higher death rates at nearly every age, from infancy through middle age, because of both biological factors and behavioral ones such as higher rates of risk-taking and occupational injury. As a result, the male side of the pyramid tends to taper faster as age increases, and the female bars grow comparatively longer in the older cohorts. In populations with high life expectancy, women may outnumber men substantially among the elderly, producing a pronounced asymmetry at the top of the pyramid. Labor migration can also distort this balance when it skews toward one sex in particular age brackets, and these shifts appear clearly once the two sides are read together.
Population Pyramid
A population pyramid organizes age groups in a fixed sequence from the bottom to the top. The base represents newborns and the earliest years of life, and each successive horizontal band corresponds to an older interval, continuing through childhood, adolescence, the working ages, and middle age, until the final bands near the apex depict the elderly population in their eighties, nineties, and beyond.
Because the diagram is drawn on a vertical axis of age, the height of any bar’s position tells the reader immediately which life stage it describes, while the bar’s length records the number or share of people in that group. The result is a visual ladder of generations, with the newest arrivals forming the foundation and the oldest survivors occupying the summit. This base-to-top ordering mirrors the passage of time in a person’s life and gives the chart its distinctive silhouette. Reading the pyramid from the bottom upward traces a population’s age structure in a single sweep, showing at a glance where the bulk of people are concentrated and how the cohorts thin or swell toward the apex.
Population Pyramid
Rapid growth within younger populations is read most clearly at the base of the chart. When a pyramid displays a wide base, the youngest age cohorts contain a very large share of the total population relative to every group above them, because each successive year or five-year age band is adding more individuals than the band before it. The resulting triangular shape and steep upward taper show that the population is expanding quickly rather than holding steady.
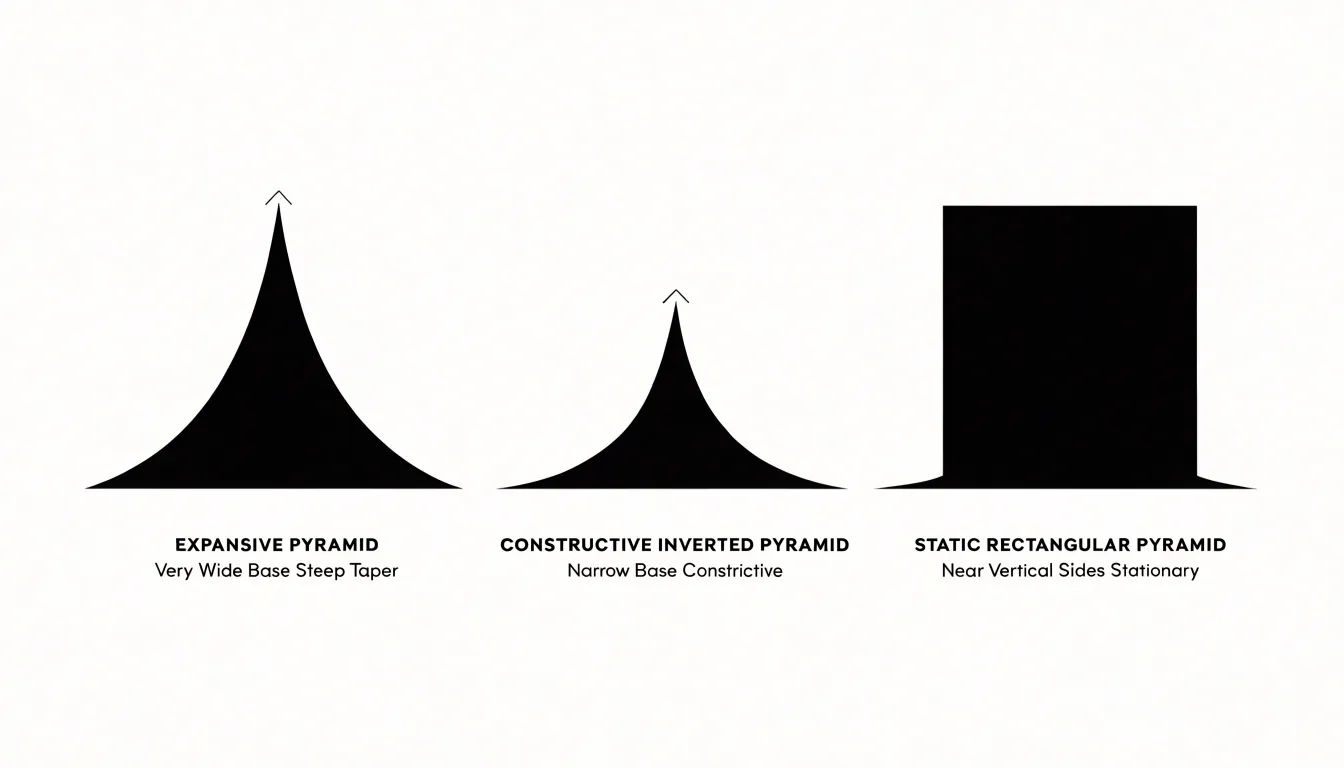
Reading this pattern involves comparing the width of the base with the bars immediately above it. A base substantially broader than the bars for the prime adult ages shows that recent generations are considerably larger than earlier ones, pointing to sustained high fertility over an extended period. Where birth rates remain high and childhood mortality is declining, the lower bars stay wide and may even grow wider across consecutive age bands, signaling that growth is accelerating rather than simply persisting.
The implications for overall population expansion follow directly from this structure. A large cohort of children will gradually move up through the age bands, and as they reach adulthood and begin forming families of their own, they add further numbers to the base in the next generation. This built-in momentum means that even if birth rates were to fall, the population would continue to grow for some time as the existing young cohorts age into their reproductive years. The wide-based pyramid therefore functions as a visual forecast, showing a society with a young age structure, a growing demand for schools and later for jobs and housing, and a population total on a trajectory of rapid increase.
Population Pyramid
When the base of the pyramid narrows relative to the middle and upper tiers, the visual effect is that of a structure turned upside down, with fewer young people supporting a growing elderly population above them. This inverted profile emerges when fertility rates fall below replacement level and persist there across successive generations, so that each new cohort entering the population is smaller than the one before it.
A narrow base signals that fewer births are occurring relative to the size of the adult population, while a widening midsection and a heavy top show that people are living longer and that the large cohorts born decades earlier are now advancing into old age. Demographers read such shapes as evidence of a society well into its demographic transition, where low birth and death rates produce an aging population with a shrinking share of children and a rising median age.
The consequences ripple through public planning, since a narrow base implies fewer future workers to fund pensions, healthcare, and elder care, while the expanding upper tiers increase demand for those very services. An inverted pyramid also concentrates its weight in age brackets that are exiting the labor force, which can slow economic growth and strain intergenerational arrangements. Observing how pronounced the inversion has become gives analysts a quick sense of how far a country has traveled along this path and how urgently it may need to adapt its institutions to a top-heavy age structure.
Population Pyramid
A population pyramid with a rectangular profile reflects a community where the numbers of people in each age band stay roughly consistent from one generation to the next. When the sides of the chart run almost vertically from base to peak, narrowing only gradually at the oldest ages, the shape tells us that births and deaths have both settled at low levels. This profile emerges once a population has moved through the earlier stages of demographic change. In the rectangular form, each cohort arriving at a given age is close in size to the cohort ahead of it, producing steady replacement rather than expansion or contraction.
Low mortality is visible in the height and width of the upper bars: when large shares of each cohort survive into older age groups, the pyramid’s top stays broad instead of collapsing to a narrow point. Low birth rates appear at the base, where the youngest bars are similar in length to those above them rather than jutting outward. Together these features indicate that families are having roughly enough children to replace themselves, with survival through childhood and adulthood high enough that most of those children eventually join the older cohorts.
A community with this shape faces a relatively predictable demand for schools, housing, and health services, since the size of each age group changes slowly. Workforce numbers remain comparatively stable, and the ratio of working-age people to dependents holds near a balanced level. The main long-term consideration is that the age structure is weighted toward older groups, so the proportion of elderly residents gradually rises even as total numbers hold steady. Recognizing the rectangular form helps analysts distinguish stable, balanced communities from those still growing rapidly or already contracting, supporting forecasts built on continuity rather than abrupt shifts.
Population Pyramid
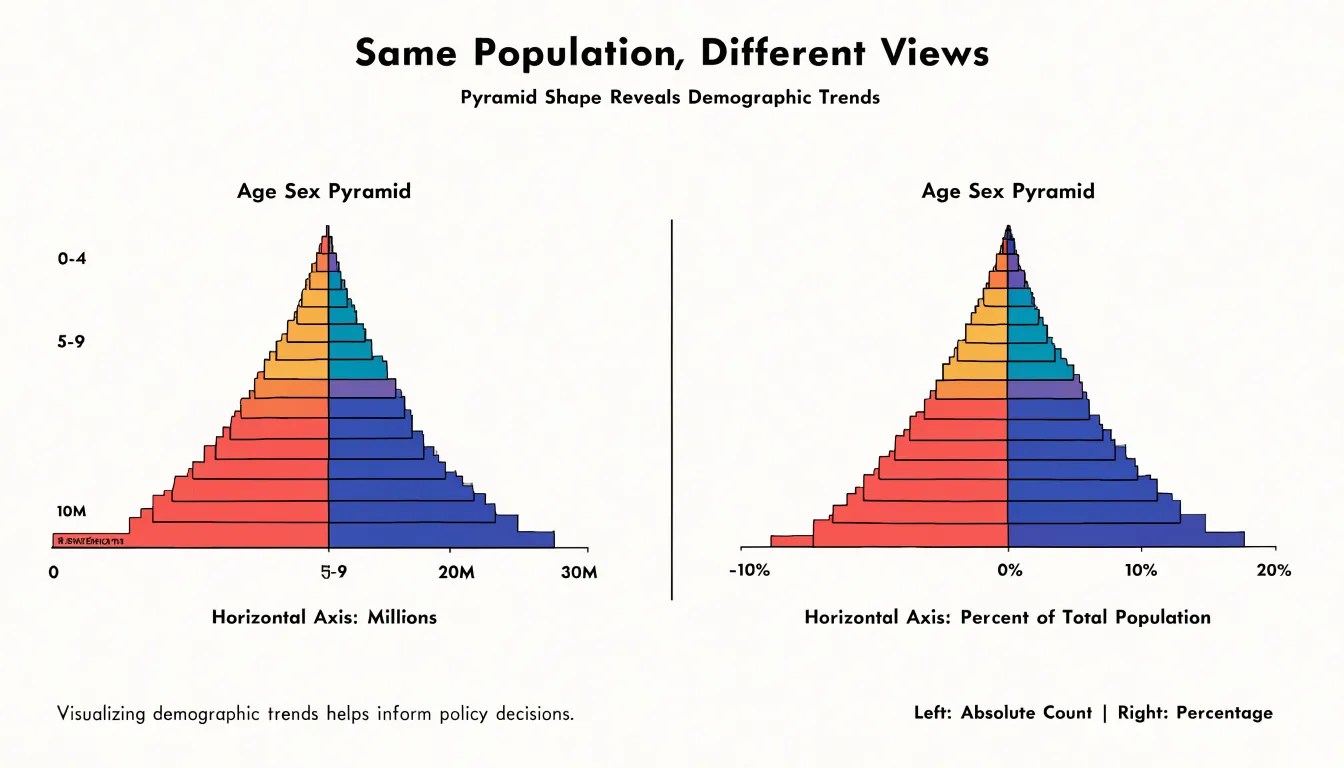
The horizontal axis of a population pyramid can be drawn in two fundamentally different ways, and the choice shapes every conclusion you draw from the chart. One version plots raw numbers: the absolute count of people in each age cohort, measured in thousands or millions. The other plots percentages: each age group’s share of the total population. Both display the same underlying data, yet they answer different questions and can support strikingly different interpretations.
Absolute counts tell you about scale and real-world demand. A cohort of two million children implies a specific number of school places, pediatric clinics, and eventually jobs and housing. Planners and budget analysts rely on these absolute figures because resources are allocated to people, not to proportions. Raw numbers also reveal the sheer momentum of a population: a large young cohort entering reproductive age will generate growth even if fertility rates fall, simply because of the number of people involved.
Percentages, by contrast, reveal structure. They show how the population is distributed across ages relative to itself, making it possible to compare the shape of a small country’s pyramid with that of a large one, or to track how a society is aging over time. A nation of fifty million and a nation of five million can have identical percentage pyramids, indicating similar demographic profiles despite vastly different absolute sizes. Percentage pyramids are also the better tool for spotting the classic shapes—expansive, constrictive, stationary—because they normalize for total population size.
The critical pitfall is confusing the two. A wide bar at the base of a percentage pyramid signals a high share of children, while a wide bar on an absolute pyramid may simply reflect overall population growth across every age group. Reading one while assuming the other can lead to misdiagnosing whether a population is genuinely youthful or merely large. Always check which metric the axis represents before drawing conclusions about aging, dependency, or future demand.
Population Pyramid
Demographers use the population pyramid as a longitudinal instrument, following specific birth cohorts as they advance through life stages. A cohort is a group of people born within a defined window, often a single year or a five-year band, and its initial size is fixed at birth. That size then travels upward through the pyramid as the cohort ages, appearing first along the base among infants and young children, later among school-age groups, then in the working-age bands, and eventually in the upper tiers of the elderly. Because each horizontal bar represents the cohort at a particular moment, demographers can trace a distinctive bulge or dip from one census to the next and read it as a continuous story rather than a snapshot.
Over a decade, a cohort’s bar shifts upward by roughly ten years of age. A large cohort born during a baby boom, for example, will appear as a wide band at the base, then among young adults, then among middle-aged workers, and finally among the elderly, changing the shape of the pyramid at each stage. A small cohort born during a period of low fertility leaves a corresponding notch that also travels upward, sometimes described as a demographic echo or shadow.
Cohort tracking informs planning in concrete ways. Education authorities anticipate school enrollment from the size of young cohorts, labor ministries estimate future workforce numbers, and health systems project demand for elder care as large cohorts reach older ages. By reading the pyramid as a record of cohorts in motion, demographers connect past births to future social and economic needs.
Population Pyramid
A population pyramid records demographic history in its silhouette, and the trained eye can read major events directly from its shape. When a generation passes through a war, an epidemic, or a period of prosperity, the effects appear as permanent features of the profile:
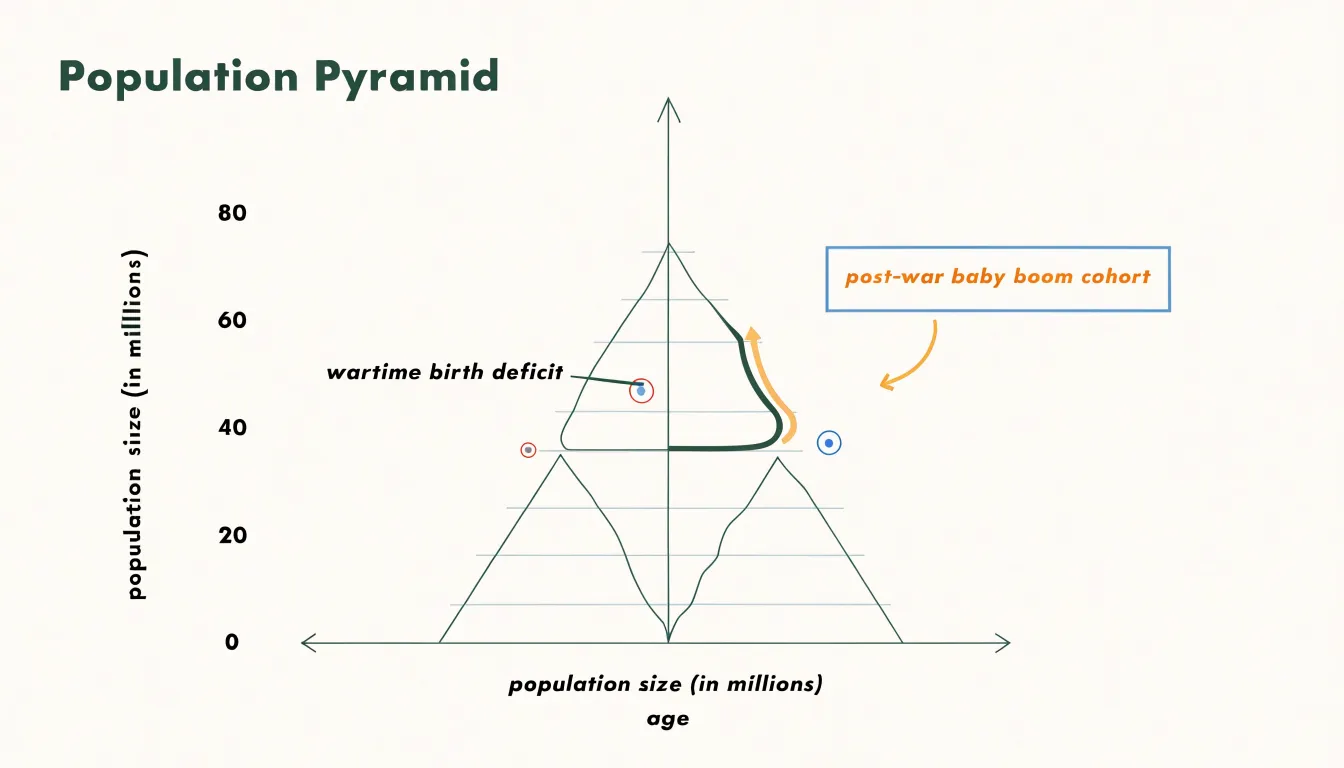
- Sharp indentations low on the pyramid: Usually point to a birth deficit—a year or several years when fewer children were conceived or survived infancy. Wartime mobilization pulls young men away from home, separates couples, and depresses marriage and birth rates, so the cohorts born during those years are smaller than their neighbors. The same pattern follows major famines and economic collapses, which raise infant mortality and postpone family formation.
- Notches higher up the pyramid: Epidemics can cut a notch in the middle age brackets when they strike adults disproportionately while leaving younger cohorts intact.
- Bulges: Tell the opposite story. In a post-war baby boom, returning soldiers, reuniting couples, and rising economic confidence produce a surge of births that travels upward as a swelling cohort. Public health campaigns and medical advances create similar bulges by sharply reducing child mortality, so that more members of a cohort survive into adulthood than in earlier generations.
Reading these features demands care, since a single indentation or bulge may reflect births, deaths, or migration combined, but the pyramid remains a clear visual record of how wars, disease, and prosperity leave demographic fingerprints that persist for generations.
Population Pyramid
A population pyramid becomes a practical analytical tool when used to compare working adults with the dependent age groups that rely on them. This comparison is usually expressed through the dependency ratio, a measure that sets the number of economically active people against the number of children and retirees not engaged in the labor force. To calculate it, demographers divide the population into age bands representing the working ages—typically 15 to 64—along with the young dependents below that range and the elderly dependents above it. The ratio of dependents to working adults is then computed, often multiplied by 100 so the result reads as the number of dependents supported by every 100 workers.
Evaluating economic contributors against children and retirees reveals the practical weight carried by the active population. Children require investment in schooling, healthcare, and everyday care, while retirees draw on pensions, medical services, and social support. When the working-age band is wide relative to the dependent bands, the pyramid shows a favorable ratio and a lighter burden on each contributor. When the dependent bands widen, the ratio climbs and the pressure on working adults increases.
The youth dependency portion and the old-age dependency portion can also be examined separately, since they carry different implications:
- High youth dependency ratio: Points to future labor supply and current spending on education and family services.
- High old-age dependency ratio: Points to rising pension and health costs alongside a shrinking pool of contributors.
Reading the pyramid’s shape alongside these figures gives planners a clear picture of how many dependents each working adult effectively supports, and how that balance is likely to shift as cohorts age.
Population Pyramid
Migration affects a population pyramid with a precision that differs from birth and death rates because it targets specific age brackets rather than acting across the whole population. Young adults in their late teens through their thirties are the most mobile group in most societies, driven by education, entry into the labor market, and the search for better wages. When a country or region attracts substantial inward migration, the effect is visible as a bulge in the working-age bands, especially the cohort between roughly 20 and 35. Areas with expanding economies, universities, or major employers often show this pattern, where the broadest bars sit comfortably above the base, reflecting an inflow of people who arrived after the local birth rate had already begun to fall.
Outward migration produces the opposite distortion in the sending region. When young adults leave to work elsewhere, the working-age bars thin out at precisely the point where they would normally be widest. The remaining population skews older and younger, leaving a hollow in the middle of the pyramid. Because the cohort that would typically supply the labor force, pay taxes, and form new households is reduced while the dependent groups above and below it remain, regions experiencing sustained outflows often face labor shortages alongside rising age-dependency ratios.
Selective migration also reshapes specific bars. Labor migration in sectors such as construction or domestic work is often dominated by one sex, making certain age bars noticeably asymmetric. Meanwhile, migration of families with children widens the bars at the bottom of the pyramid, while retirement migration in the opposite direction swells the bars at the top. In each case, the pyramid records migration not as a uniform shift but as a set of targeted pressures on particular age brackets.
Population Pyramid
Population pyramids for cities and the surrounding countryside often display markedly different shapes, revealing how geography shapes demographic structure. Urban pyramids tend to have a broad base and a bulging middle, reflecting the concentration of young professionals who move to cities for education, employment, and career advancement. These working-age adults cluster in the 25-to-45 age brackets, giving the urban pyramid its characteristic diamond or barrel profile. The narrow top of the urban pyramid signals a smaller share of elderly residents, since many older people either remain in rural areas or relocate to retirement communities outside metropolitan centres.
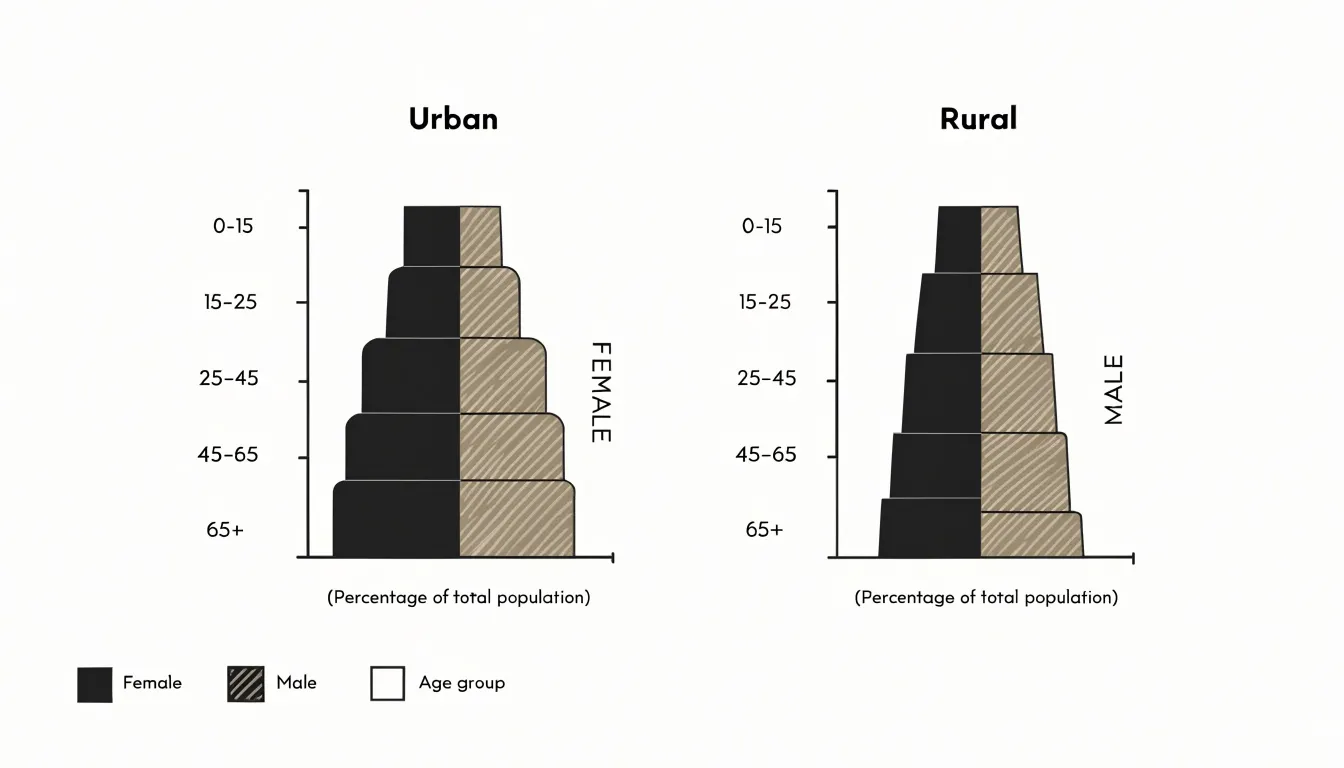
In contrast, rural pyramids frequently show a narrower base and a proportionally wider top. Lower birth rates in many rural regions, combined with the out-migration of young adults toward cities, thin out the younger cohorts. Each cohort of school-leavers moving to cities simultaneously widens the urban working-age band and narrows the rural one, leaving rural pyramids bulging in the middle-aged and elderly bands and tapering sharply at the bottom.
These structural differences carry practical implications. Urban planners must accommodate demand for housing, transit, and childcare driven by young families and single professionals, while rural authorities face pressures around healthcare, pensions, and elder care with a shrinking tax base. Over time, the contrast between the two pyramid shapes becomes a compact visual record of how opportunity, mobility, and ageing distribute themselves across the urban-rural divide.
Population Pyramid
A youth bulge describes a demographic structure in which a disproportionately large share of the population falls within young adult age brackets, typically the late teens through the thirties. This pattern usually emerges after a period of high fertility followed by declining infant mortality, so that a swollen cohort survives into working age while birth rates among their parents’ generation begin to level off.
In expanding economies, this configuration tends to produce a demographic dividend. A large cohort of young adults enters the labor force at the same time that dependency ratios fall, meaning there are proportionally fewer children and elderly people relying on each worker. Households can save more, businesses gain access to an abundant and adaptable workforce, and domestic consumption rises as new workers form families and purchase goods. Many of the fastest-growing economies of the past half-century have passed through this window, using labor-intensive manufacturing and services to absorb young workers and convert demographic momentum into sustained growth.
The same concentration of young adults carries social pressures that can strain institutions. Labor markets must generate enough jobs each year to absorb new entrants; when growth lags behind the size of the cohort, unemployment and underemployment among the young can rise quickly. Housing, schools, healthcare, and transport systems designed for smaller populations face sudden demand. Political systems also feel the weight of a large, educated, and connected generation with high expectations and limited patience for slow reform.
Managing a youth bulge therefore depends on investment in education, job creation, and urban infrastructure during the decades when the cohort is entering adulthood. Countries that harness this window often enjoy rapid expansion; those that leave young workers without opportunity may face unrest and wasted potential.
Population Pyramid
When the upper tiers of a population pyramid expand rapidly, an aging population places substantial fiscal strain on public institutions:
- Healthcare systems: Older cohorts typically require more frequent medical attention, manage multiple chronic conditions, and rely on labor-intensive, expensive long-term care services. Hospitals, clinics, and care facilities must expand capacity at precisely the moment when the working-age population that staffs them is growing more slowly.
- Pension systems: Pay-as-you-go schemes depend on a steady flow of contributions from current workers to support current retirees. When the ratio of contributors to beneficiaries narrows, governments confront difficult choices among raising contribution rates, trimming benefits, extending retirement ages, or drawing on general revenue.
- Labor markets: As the pool of available workers shrinks relative to dependents, recruitment tightens in key sectors and the tax burden carried by each employed person increases.
These pressures compound one another, since higher healthcare spending and pension obligations compete for the same public budgets that might otherwise fund education, infrastructure, or family support policies. Countries experiencing this shift often respond with a mix of measures, including incentives for higher birth rates, immigration policies that broaden the workforce, investments in automation and productivity, and reforms that encourage later retirement and greater private savings. Because demographic change unfolds gradually yet resists quick reversal, early and sustained policy responses are far more effective than sudden adjustments once fiscal strain has become acute.
Population Pyramid
Population pyramids give governments a visual forecast of who will need what, and when. A broad base translates into concrete educational planning: how many primary schools to build in the next decade, where to place them, and how many teachers to train, followed later by secondary schools and universities as the cohort ages. A narrowing base warns of shrinking school-age populations and the need to consolidate facilities rather than expand them.
Urban planning relies on these projections to match infrastructure with future demand. Cities examining their pyramids can estimate how many households will form in coming years, where housing pressure will concentrate, and what transport capacity new residential districts will need. A bulge in the 25-to-40 age bracket often precedes a wave of family formation, signaling demand for larger housing units, expanded public transit, and recreational spaces. Municipalities that read these signals early can phase construction to avoid shortages, while those that ignore them may overbuild or underbuild relative to actual need.
Governments also use population projections to plan water and energy supply based on expected household counts, and to target regional interventions—directing investment toward areas with growing young populations and adjusting services in regions experiencing decline. The chart connects today’s demographic reality to tomorrow’s fiscal and physical requirements.
Frequently Asked Questions
What is a population pyramid?
A population pyramid is a graphical representation of the age and sex composition of a population, with age groups on the vertical axis and the number or percentage of people on the horizontal axis. The horizontal axis is typically split at the center, with males on the left and females on the right to compare the sexes within each age band.
What does a wide base on a population pyramid indicate?
A wide base means the youngest age cohorts contain a very large share of the population relative to older groups, reflecting high fertility and rapid growth. It can also show built-in momentum, so the population may keep growing even if birth rates later fall.
What does a narrow base on a population pyramid mean?
A narrow base signals fewer births relative to the adult population and, when fertility falls below replacement level and persists, can produce an inverted profile with fewer young people supporting a growing elderly population. It also points to an aging population with a shrinking share of children and a rising median age.
What does a rectangular population pyramid show?
A rectangular population pyramid shows that births and deaths have both settled at low levels, with each cohort close in size to the one ahead of it. It reflects steady replacement rather than expansion or contraction, and a broad top indicates that many people survive into older age.
What is the dependency ratio in a population pyramid?
The dependency ratio compares economically active people with children and retirees not in the labor force, typically using working ages 15 to 64 and dependents below and above that range. It is often multiplied by 100 to show how many dependents are supported by every 100 workers, and youth and old-age dependency can be examined separately.
How does migration affect a population pyramid?
Migration affects specific age brackets, and young adults in their late teens through their thirties are the most mobile group, so inward migration can create a bulge in working-age bands. Outward migration can thin those bars, and sex-selective labor migration can make certain age bars asymmetric.
Tony Astor
Tony writes about data visualization and the tools people use to build charts and dashboards. More about Data Illustrator