Population Pyramid vs Butterfly Chart: How They Differ
 By Tony Astor ·

Population Pyramid vs Butterfly Chart
A population pyramid is a back-to-back bar chart showing age and gender composition, with age groups stacked vertically and male/female counts extending left and right from a central axis. Its shape reveals birth rates, mortality, and demographic trends. A butterfly chart uses the same mirrored layout but for discrete paired categories, not continuous age ranges.
Table of Contents
Population Pyramid
The population pyramid displays the age and gender composition of a population in a single view. Its structure rests on two perpendicular axes:
- Vertical axis: Carries age brackets, typically arranged in five-year intervals from the youngest group at the base to the oldest at the apex.
- Horizontal axis: Carries counts of people, expressed either as absolute numbers or as percentages of the total population.
The center of the chart forms a dividing line. Male counts extend to the left and female counts extend to the right, so each age bracket appears as a horizontal bar whose segment lengths correspond to the size of that group.
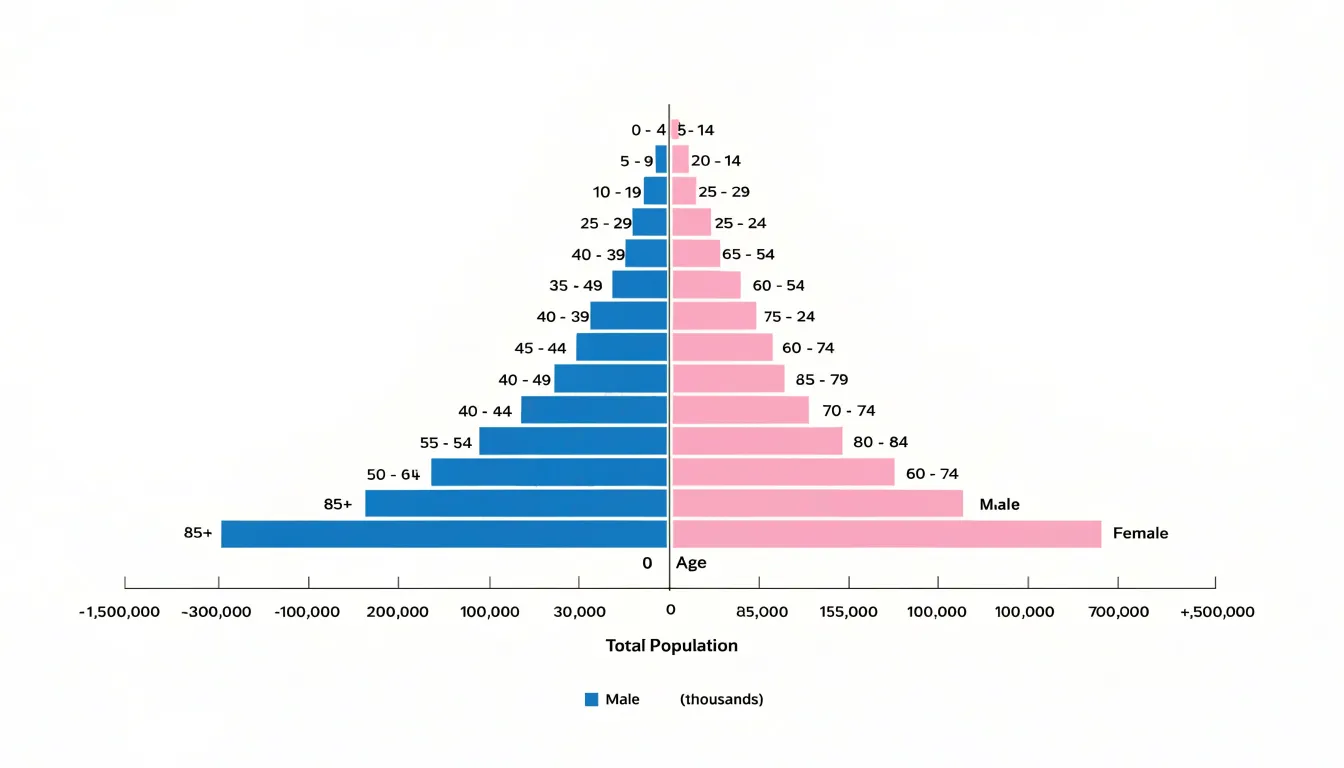
Reading the resulting shape gives an immediate impression of demographic structure. A wide base narrowing toward the top produces the triangular silhouette that gives the chart its name, indicating a young population with high birth rates and shorter life expectancy. A narrow base combined with a broad middle suggests an aging population with declining fertility. Bulges and indentations along the sides mark cohorts affected by historical events—such as wars, migration waves, or baby booms—which persist as irregularities as those cohorts age.
The side-by-side gender division adds a second dimension of comparison. Differences in the length of male and female bars at a given age reveal disparities in survival, labor migration, or mortality patterns. Because both distributions share the same vertical scale, these contrasts can be inspected directly at each age level without additional calculations. The format works best with aggregated, ordered data and requires careful attention to axis scales, since changing the horizontal unit can alter the visual weight of the shape considerably.
Pyramid Features
A population pyramid’s shape is defined by two dimensions: the width of its base and the height of its peak.
The base represents the youngest age group, typically ages 0–4, and its width relative to older cohorts indicates the share of the population in the earliest life stages. A wide base signals a high birth rate and rapid population growth. This pattern is common in many developing countries, where families tend to be larger and child mortality may be higher, though base width primarily reflects fertility. Moving up the pyramid, the bars typically shorten as cohorts shrink due to deaths over time. The rate of narrowing reflects mortality conditions: gradual tapering suggests relatively high life expectancy, while a sharp drop-off indicates high mortality at younger ages.
The peak, representing the oldest age groups, tells a complementary story. A tall, broad peak—where bars for the elderly remain wide relative to younger cohorts—indicates a large share of older people. When birth rates decline and life expectancy increases, more people survive into old age, giving the pyramid a rectangular or even inverted shape with a narrow base and a wide top. Conversely, a narrow, pointed peak shows that few people reach old age, often due to limited healthcare or widespread mortality. Reading base width and peak height together reveals whether a population is expanding, stationary, or shrinking, helping analysts anticipate social and economic challenges such as the need for schools versus elderly healthcare.
Demographic Shifts
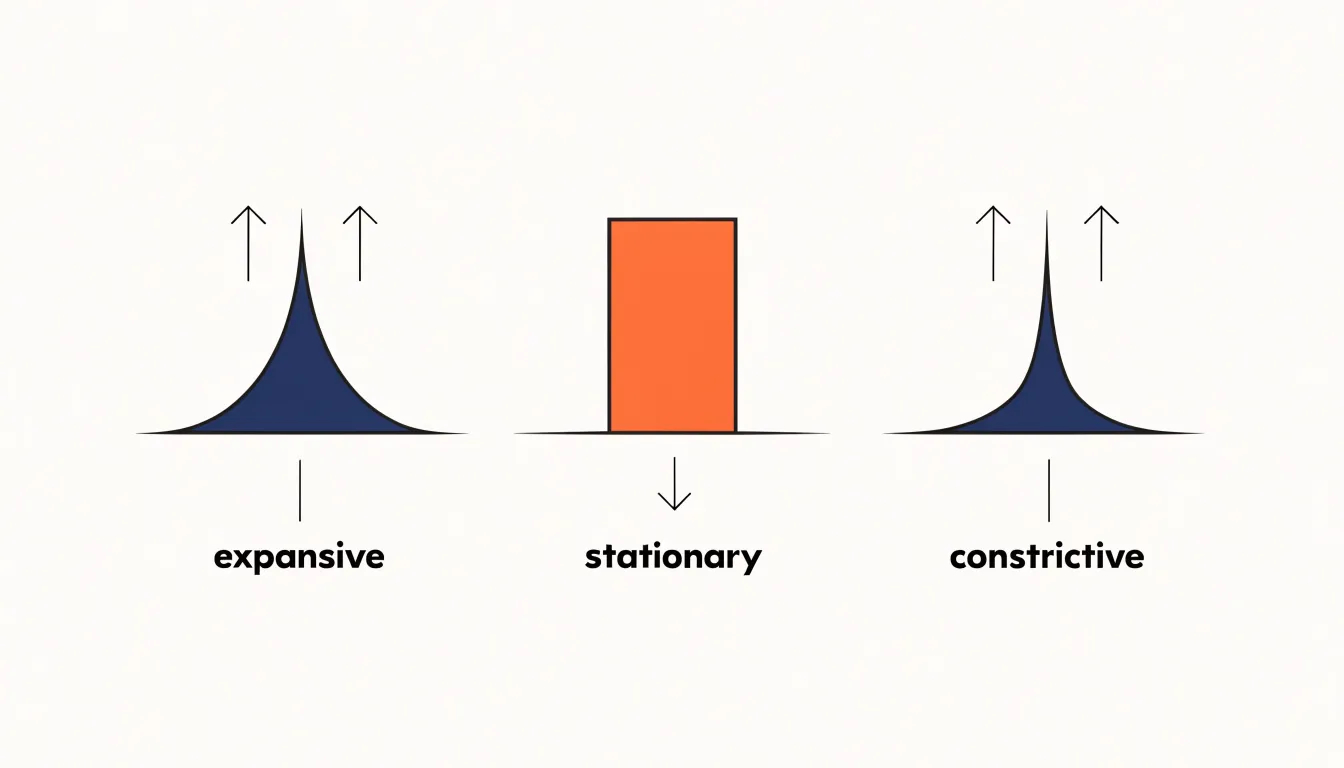
Demographic analysts classify population pyramids into three primary profiles to trace how a society grows or contracts over decades:
- Expansive pyramid: Shows a broad base that narrows sharply toward the top. Each new generation is larger than the one before it, creating momentum for continued growth. Many societies pass through this stage during early industrialization, when families are large and mortality among the young remains relatively high.
- Stationary pyramid: Presents a rectangular silhouette with sides that stay roughly vertical through the middle age groups before tapering at the oldest ages. Birth and death rates are balanced, so the population neither swells nor shrinks rapidly. This shape often appears in mature industrial economies where family sizes have stabilized and longevity has improved.
- Constrictive pyramid: Narrows at the base, indicating that fewer children are being born relative to the adult population. In this aging society, the working-age cohort shoulders a growing dependency burden and future labor supply may decline.
Comparing these profiles over time reveals a society’s demographic trajectory. A country moving from an expansive to a stationary shape is undergoing a fertility transition, while movement toward a constrictive base raises questions about workforce replacement and pension sustainability. Internal irregularities—such as bulges from baby booms or indentations from famines—add historical texture to these broad classifications.
Butterfly Chart
A butterfly chart takes its name from the symmetrical shape produced when two related datasets are plotted on either side of a shared central axis. A single column of labels runs down the middle of the figure, and two opposing horizontal bar series extend outward to the left and right, resembling a pair of wings spreading from a common body.
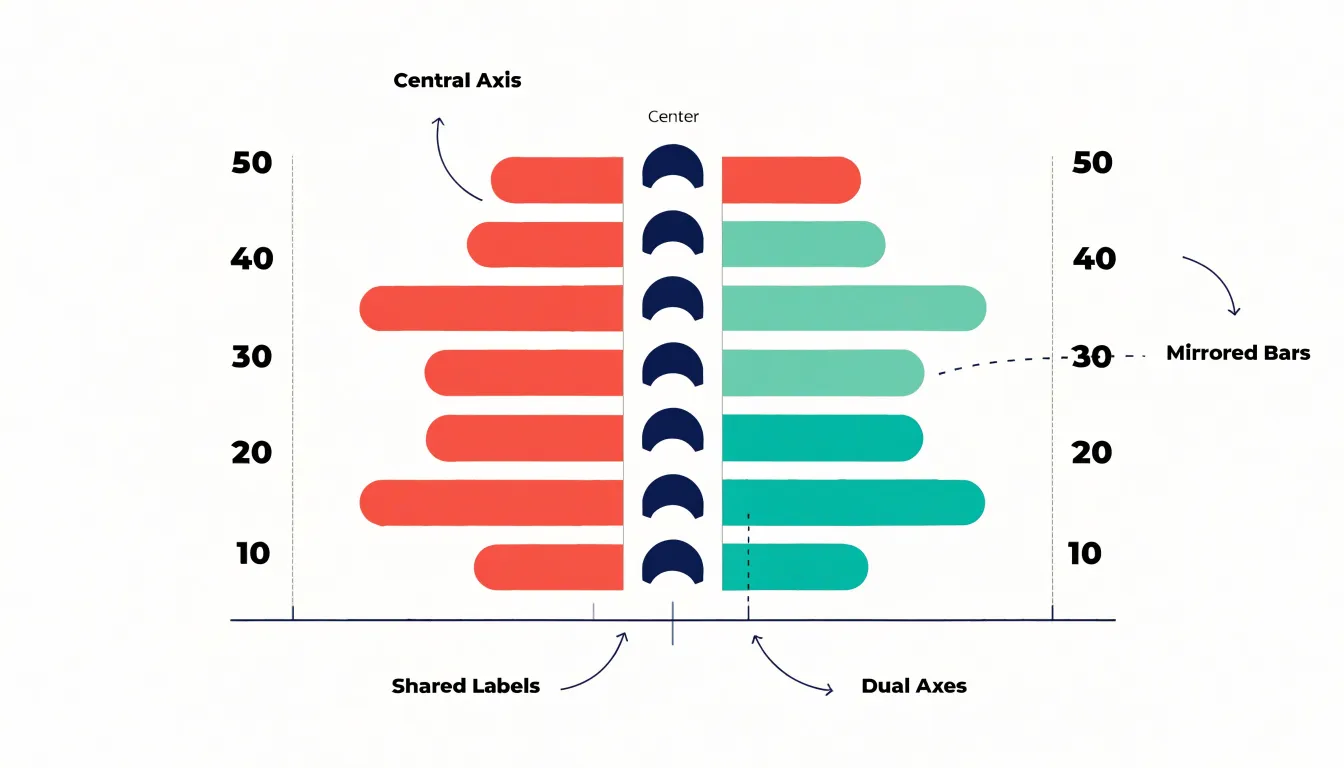
The central label column is the organizing spine of the chart. Each row corresponds to a category, group, or survey item, positioned between the left- and right-hand bars so the viewer never has to hunt for the pairing. Comparison happens along a horizontal line of sight from the end of one bar across the label to the end of the other. This arrangement suits two variables that describe the same subjects, such as imports and exports within each trade category, or the responses of two demographic groups to identical survey questions.
Butterfly charts handle survey data particularly well. When two groups answer the same questions, each question becomes a row label, and the percentage choosing a given response is plotted on either side. Divergences stand out as asymmetric wings, while agreement produces balanced bars. Consistent categories, matched or aligned scales, gridlines, value labels, and clearly worded central labels ensure that the back-to-back comparison remains legible and intuitive.
Butterfly Chart Design
The butterfly chart’s architecture combines four core components to create a compact, symmetrical footprint:
- Central vertical axis: Slices the visualization into two halves, providing a fixed baseline from which all comparisons radiate.
- Shared categorical labels: Run vertically between the two mirrored panels, eliminating redundancy so viewers can track a category across both halves without scanning back and forth.
- Dual horizontal axes: Extend to the left and right. Each axis is scaled independently but proportionally; while they share a central baseline, their tick marks and labels may diverge to reflect different ranges or units.
- Mirrored bars: Grow outward from the center and are typically color-coded to distinguish the two sides, allowing viewers to grasp differences without complex legends.
Structural Differences
Although population pyramids and butterfly charts share a mirrored, back-to-back form, their axis layouts follow different structural logics.
In a population pyramid, the horizontal axis represents a continuous scale divided into equal intervals extending symmetrically from a central zero, while the vertical axis orders continuous age cohorts in sequence. This uninterrupted structure lets the eye trace smooth gradients and compare adjacent cohorts, producing an overall silhouette that approximates a curve. The position of each bar along the vertical continuum matters as much as its length.
A butterfly chart uses discrete categorical rows on its vertical axis—such as product features or regional groupings—that do not follow a continuous progression. While the horizontal axis remains continuous, the vertical rows are separate and often arbitrarily ordered. The bars are typically uniform in height and separated by small gaps, reinforcing the independence of each category and directing attention to individual side-by-side contrasts rather than trends across a sequence.
Data Types
Choosing between the two formats begins with matching the chart to the underlying variable:
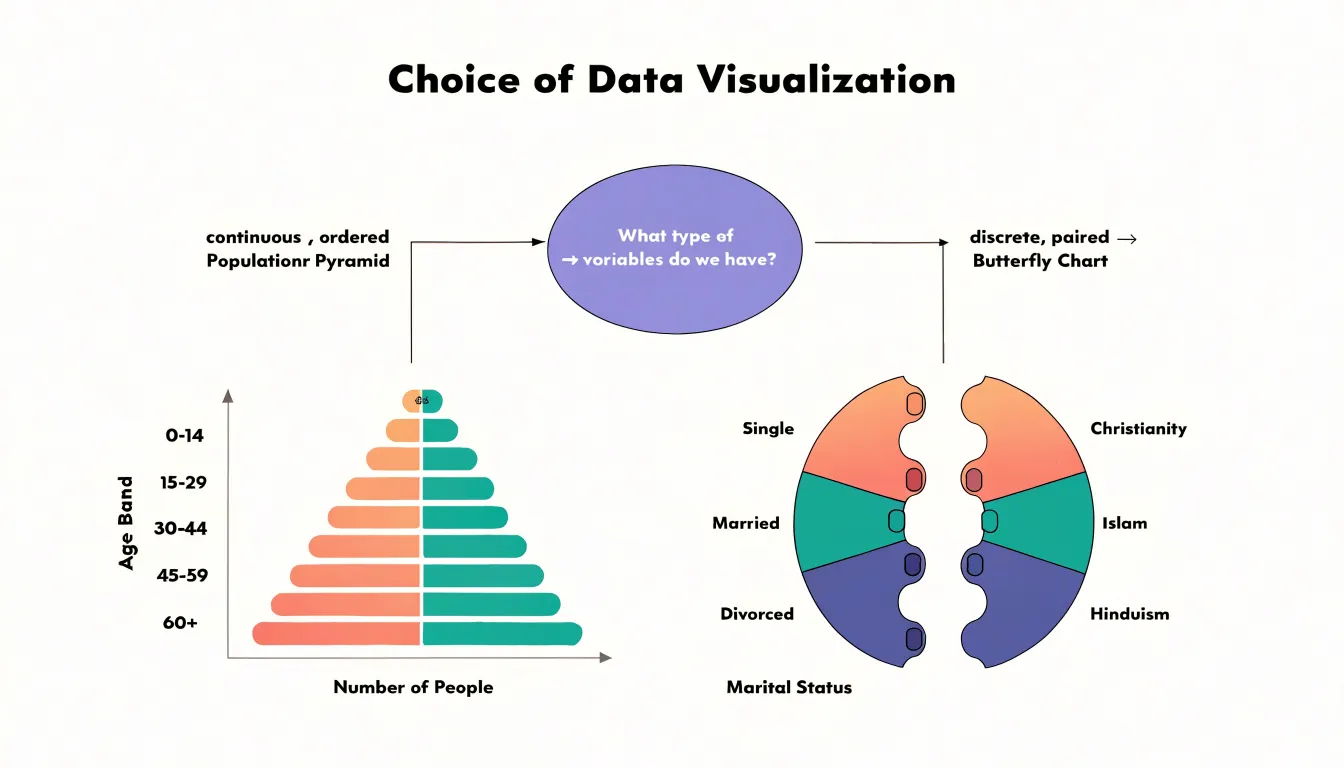
- Continuous range (Population Pyramid): Use when data is binned into ordered intervals, such as age groups with separate male and female counts, and you want to show the overall shape of a distribution across stages of life.
- Discrete paired metrics (Butterfly Chart): Use when comparing two related measurements on the same scale across distinct, non-ordered categories, such as the number of male and female employees in different job grades or the frequency of two events across categories.
Population Distributions
Because its vertical axis encodes the passage of time from youngest to oldest, the population pyramid makes generational dynamics immediately visible. A reader can compare cohort sizes at a glance to see whether a particular age band swells outward compared to the generations before and after it.
Dependency ratios follow from this same visual logic. The broad base of a young population and the wide top of an aging one stand in direct relation to the working-age middle, turning the proportion of dependents to earners into a visual comparison of widths along the vertical axis rather than a table lookup. Similarly, historic population shocks—epidemics, conflicts, or migration waves—leave notches and asymmetries at specific age bands that remain visible decades later as the affected cohort climbs the pyramid, helping demographers anticipate future pressure on schools, labor markets, and pensions.
Paired Metrics
Butterfly charts excel at comparing paired metrics that share a common scale across business and analytical scenarios:
- Pre- and post-campaign results: Plot key performance indicators such as brand awareness or purchase intent for the same audience, with pre-campaign values on the left and post-campaign values on the right. This shows the magnitude of change for each metric without requiring viewers to compare separate charts.
- Sentiment analysis: Place positive sentiment scores to the right and negative scores to the left across different topics or product attributes. Viewers can quickly identify which aspects are polarizing and which are uniformly positive or negative.
- Competitor feature evaluations: Compare your product against a competitor across a series of features, placing your scores on one side and the competitor’s on the other to reveal where you lead, lag, or match.
Symmetry and Asymmetry
In dual-sided graphs, symmetry and asymmetry serve as diagnostic tools for distributional equality and disparity.
Perfect symmetry indicates that the two groups or time periods have nearly identical distributions across the measured variable, with corresponding bars mirroring each other in length or area. Asymmetry draws attention to imbalances and variance. A pronounced skew on one side highlights segments with disproportionate representation, such as sex-specific mortality, migration patterns, or unequal resource allocation.
The degree of asymmetry conveys the magnitude of variance. Subtle deviations reflect minor fluctuations, while stark contrasts point to systemic differences. Examining the pattern across the entire graph reveals whether imbalances are localized to specific categories or pervasive throughout the distribution.
Design Pitfalls
Small layout decisions in split bar graphs can distort the comparison:
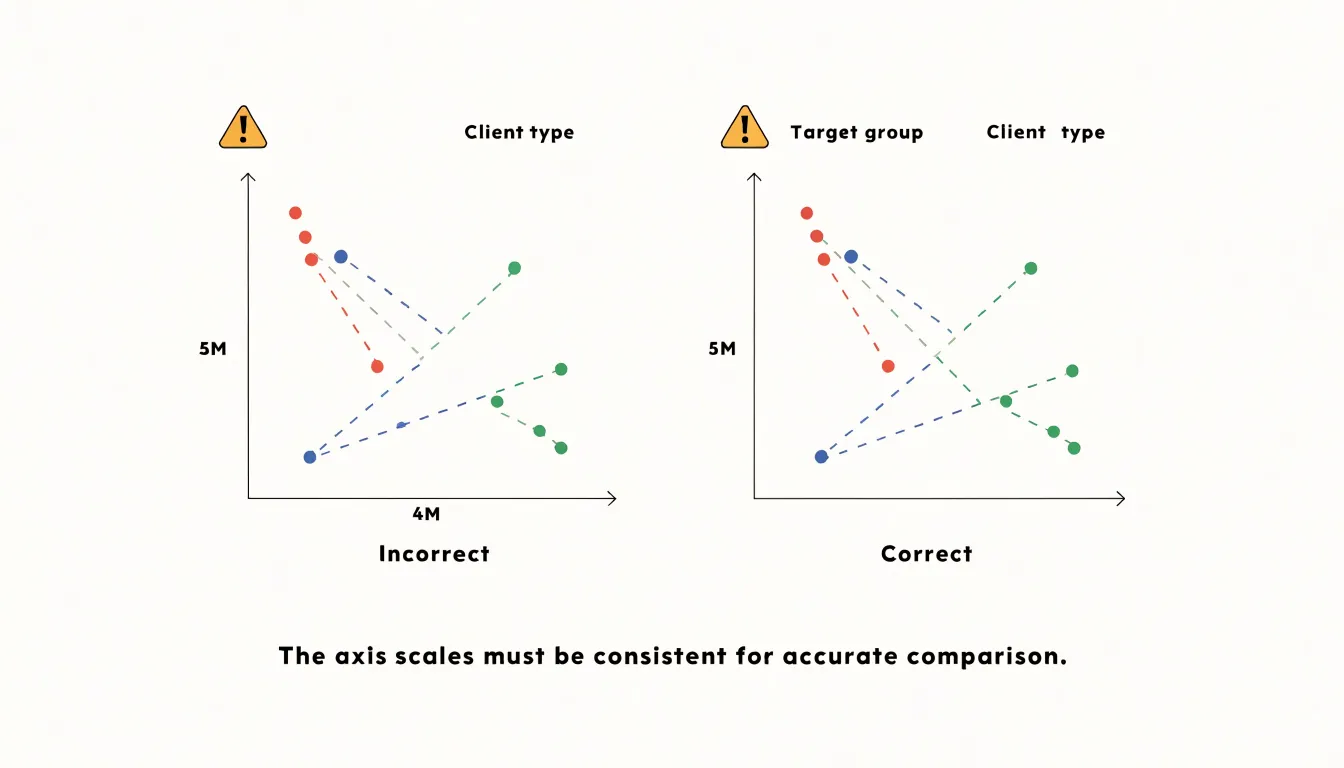
- Asymmetrical axis scaling: If the left arm extends to a maximum value of 5 million and the right arm to 4 million over the same physical distance, identical bar lengths will represent different quantities, introducing a false visual asymmetry. Setting both axes to an identical maximum—even when one side has shorter bars—keeps the comparison honest.
- Crowded central axis: Long category labels between the bar series squeeze both arms, while large value labels near the center collide with bars and each other. Reserve generous central space, keep category labels concise and left-aligned to the axis, rotate or abbreviate age bands, and move numeric annotations to the outer ends of the bars.
- Confusing color palettes: Using two saturated, high-contrast hues implies opposition and draws the eye to the uninformative center. Splitting bars by a third variable (such as urban versus rural) multiplies palettes further. Use restrained, related hues for the two sides with tints for subcategories, and order legend entries to match the left-right layout. Testing the chart at its final display size catches most of these issues before publication.
Real World Use Cases
In practice, the two charts serve distinct reporting contexts:
- National census reporting (Population Pyramids): Statistical agencies overlay successive pyramids across regular census intervals to track how a nation’s demographic structure shifts over decades, informing budget allocation, education planning, and labor market forecasts. The standardized layout gives census reports a consistent grammar across countries and languages.
- Corporate and business reporting (Butterfly Charts): Analysts compare revenue versus cost per product line, male versus female customer segments, or current versus previous period performance across departments. Market research teams compare brand satisfaction scores, while human resources departments display salary distributions by gender or headcount by function for executive and client presentations.
Selecting the Best Chart
Use three factors to decide between a population pyramid and a butterfly chart:
- Variable continuity: Choose a pyramid for continuous data divided into sequential ranges (like age), and a butterfly chart for discrete, non-ordered categories.
- Category counts: Population pyramids typically accommodate a moderate number of age groups—often 10 to 20—to maintain a clear visual progression. Butterfly charts can handle more categories, though clarity diminishes if the list grows too long.
- Messaging goals: Use a pyramid to highlight overall distribution shapes and demographic trends, and a butterfly chart to emphasize direct, row-by-row contrasts between two groups (such as male versus female preferences for various activities).
Overview
Both designs arrange categories along a central spine with opposing horizontal bars, yet they carry different conventions and structural constraints.
A population pyramid trades flexibility for instant recognition. Readers expect ascending age order, mirrored scales, and often a reference line or annotation for total population; breaking these conventions can confuse viewers. When your data concerns age and gender, this strict format lets viewers interpret proportions without a legend.
A butterfly chart operates as a general-purpose comparison tool—whether contrasting male versus female net worth brackets or survey responses split by cohort. It tolerates custom category orderings, uneven scales, and mixed units more comfortably than a strict pyramid, adding analytical flexibility at the cost of requiring clearer labels and annotations to keep the comparison accurate.
Frequently Asked Questions
What does a population pyramid show?
A population pyramid displays the age and gender composition of a population in a single view. Age brackets run on the vertical axis, while male counts extend to the left and female counts to the right on the horizontal axis.
How can you tell if a population is young or aging from a population pyramid?
A wide base narrowing toward the top indicates a young population with high birth rates and shorter life expectancy. A narrow base combined with a broad middle or a tall, broad peak suggests an aging population with declining fertility and more people surviving into old age.
What are the three main types of population pyramids?
The three primary profiles are expansive, stationary, and constrictive. An expansive pyramid has a broad base that narrows sharply, a stationary pyramid has a roughly rectangular silhouette, and a constrictive pyramid narrows at the base.
What is a butterfly chart best used for?
A butterfly chart compares two related datasets plotted on either side of a shared central axis. It works well for paired metrics such as survey responses from two groups, pre- and post-campaign results, sentiment analysis, or competitor feature evaluations.
What is the difference between a population pyramid and a butterfly chart?
A population pyramid uses continuous, ordered age cohorts on its vertical axis and highlights the overall shape of a distribution. A butterfly chart uses discrete, often non-ordered categories and emphasizes direct, row-by-row contrasts between two groups.
What are common design mistakes in split bar charts?
Asymmetrical axis scaling can make identical bar lengths represent different quantities and introduce a false visual asymmetry. Crowded central axes and confusing color palettes can also reduce legibility, so both axes should use an identical maximum to keep the comparison honest.
Tony Astor
Tony writes about data visualization and the tools people use to build charts and dashboards. More about Data Illustrator