Pie Chart: When It Works and When to Avoid It
 By Tony Astor ·

Pie Chart
A pie chart is a circular graphic divided into slices that each represent a category within a dataset, with all slices adding up to 100 percent of the total. It suits static part-to-whole composition with few categories, ideally five or fewer, and works best when categories are mutually exclusive and differences between slices are clearly visible.
Table of Contents
Pie Chart
A pie chart is a circular graphic divided into slices, where each slice represents a category within a dataset. Every slice is a portion of a single circle, and all slices together add up to 100 percent of the total. This makes the chart a natural fit for displaying static composition—showing how a complete entity breaks down into its constituent parts at a single moment without implying movement or change over time.
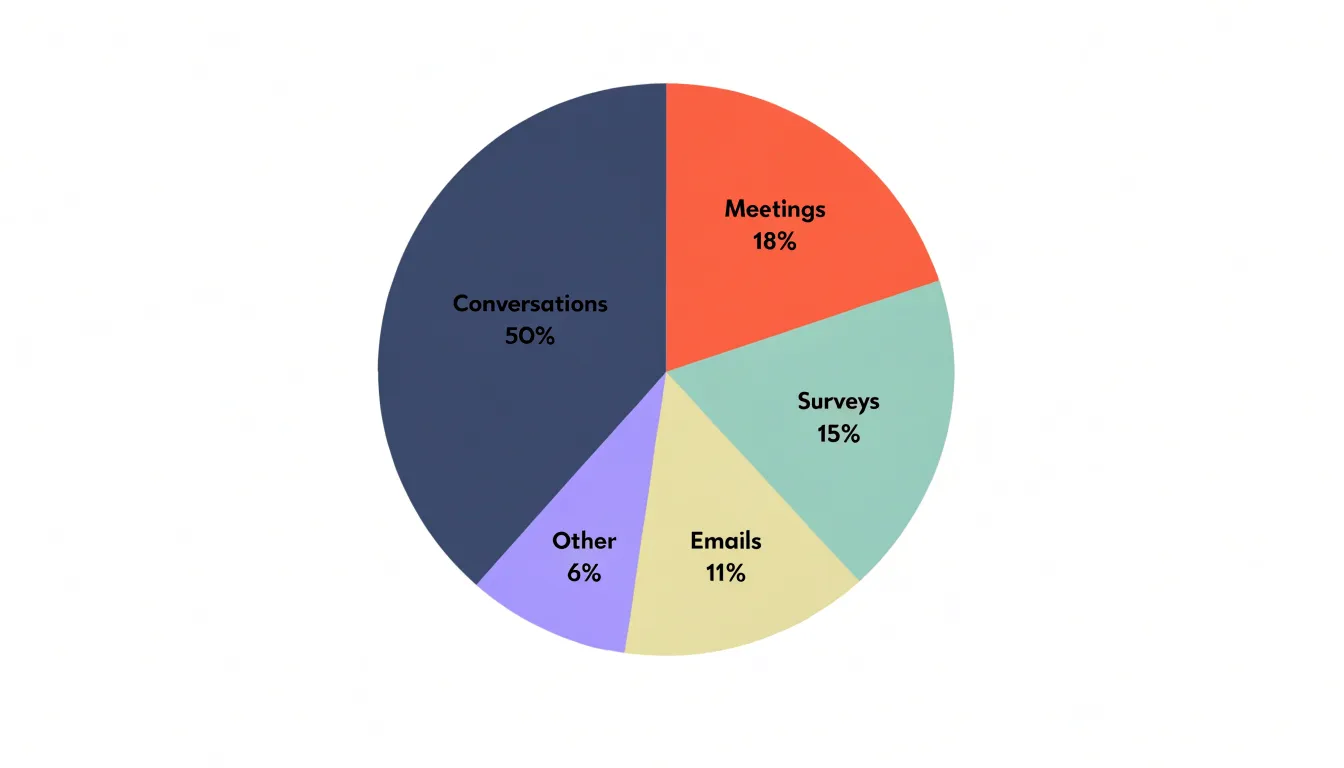
The full circle stands in for the entire dataset, and the size of each wedge corresponds to the share that a given category contributes to the overall total. Larger slices take up more arc length, central angle, and area, while smaller slices occupy proportionally less space, allowing viewers to gauge relative magnitude at a glance.
Because the chart is built around a fixed total, it works best when categories are mutually exclusive and together account for everything being measured. Typical examples include:
- The share of a budget allocated to different departments
- The distribution of a population across age brackets
- The percentage of sales attributed to different product lines
Because a circle reads as a complete and self-contained object, the eye can quickly compare wedge sizes to understand which categories dominate and which play minor roles.
Pie Chart
A pie chart earns its place when the audience needs to see how a whole divides into parts at a glance. The most dependable instance is a small set of categories, usually between three and six, where the differences in size are large enough to be seen immediately. A reader scanning a report, a slide, or a dashboard can register that one category accounts for roughly half the total while another takes a narrow slice, without reading a single number.
General audiences benefit most in communication contexts where the underlying data lives elsewhere. An annual review slide showing budget allocation, a newspaper graphic breaking down survey responses, or a classroom illustration of how time is divided across activities all let the pie chart carry one clear proportion that supports the surrounding narrative. When the question is simply which share is largest or whether one part approaches a quarter or a half, the circular format matches how people already think about portions of a whole.
Simple pie charts also work well when a table would force readers to compare fractions mentally. A table listing eight percentages invites arithmetic; a pie chart with three dominant segments lets the eye do the comparison instantly. This makes the format useful for executive summaries, public-facing infographics, and any setting where speed of comprehension matters more than precise values. Labels placed directly on the slices, with percentages rounded to whole numbers, reinforce this quick read for an audience that needs orientation rather than detailed analysis.
Pie Chart
Limiting a pie chart to five or six categories preserves clarity because each wedge remains large enough to judge against its neighbors. When more categories crowd the circle, small slices become hard-to-distinguish slivers, labels collide or require crisscrossing leader lines, and the reader’s attention splinters across too many comparisons. The practical remedy is to group the smallest categories into a single slice labeled “Other” or “Miscellaneous.” This keeps the chart readable while still accounting for every data point. The grouped slice should sit at the end of the ordering so it does not disrupt the visual flow of the major contributors.
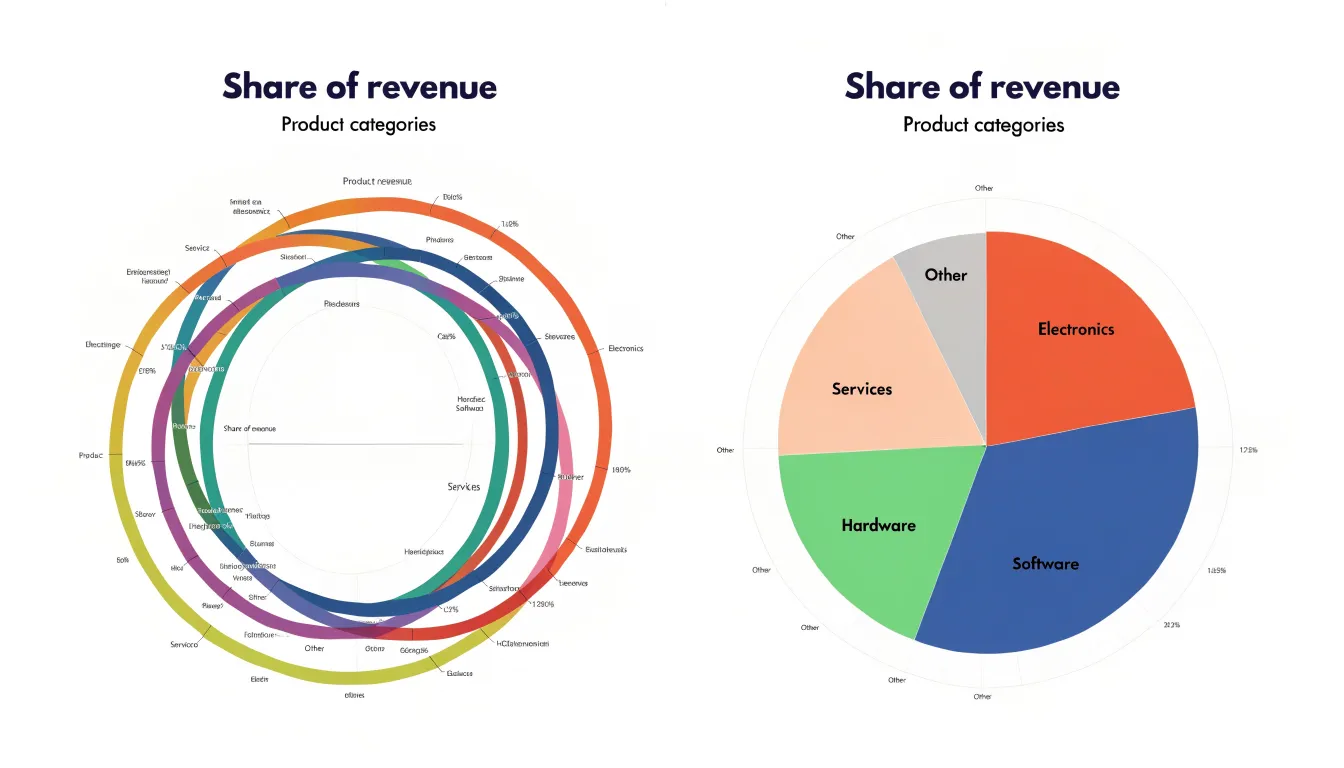
Equally important is verifying that the raw percentages sum to a complete total. Rounding is the usual culprit here: individual values such as 33.3, 33.3, and 33.3 display as three tidy thirds, yet their displayed sum reads 99.9 percent. Readers notice this discrepancy and begin to question the data.
A common fix is to adjust one slice—typically the largest or the grouped remainder—so the displayed figures add to exactly 100 percent. Alternatively, the chart can note that percentages may not total 100 due to rounding, though adjusting the values is generally cleaner since the circle implies a whole. Whatever method is chosen, check the underlying raw values before publishing and use consistent decimal places in labels so the total is easy to verify.
Pie Chart
When several slices of a pie chart carry nearly the same value, the chart’s central mechanism for communicating proportion begins to fail. Viewers judge pie slices by comparing the angles and arc lengths at the rim, and those comparisons become unreliable once two slices differ by only a few percentage points. A reader looking at a chart where one slice is 22 percent and another is 24 percent has no dependable way to rank them by eye, even though the underlying data may show a meaningful gap. The difficulty compounds when many slices cluster in a similar range, since small errors accumulate across fine angular judgments, making the ordering of categories appear arbitrary and leading readers to conclusions opposite to what the numbers support.
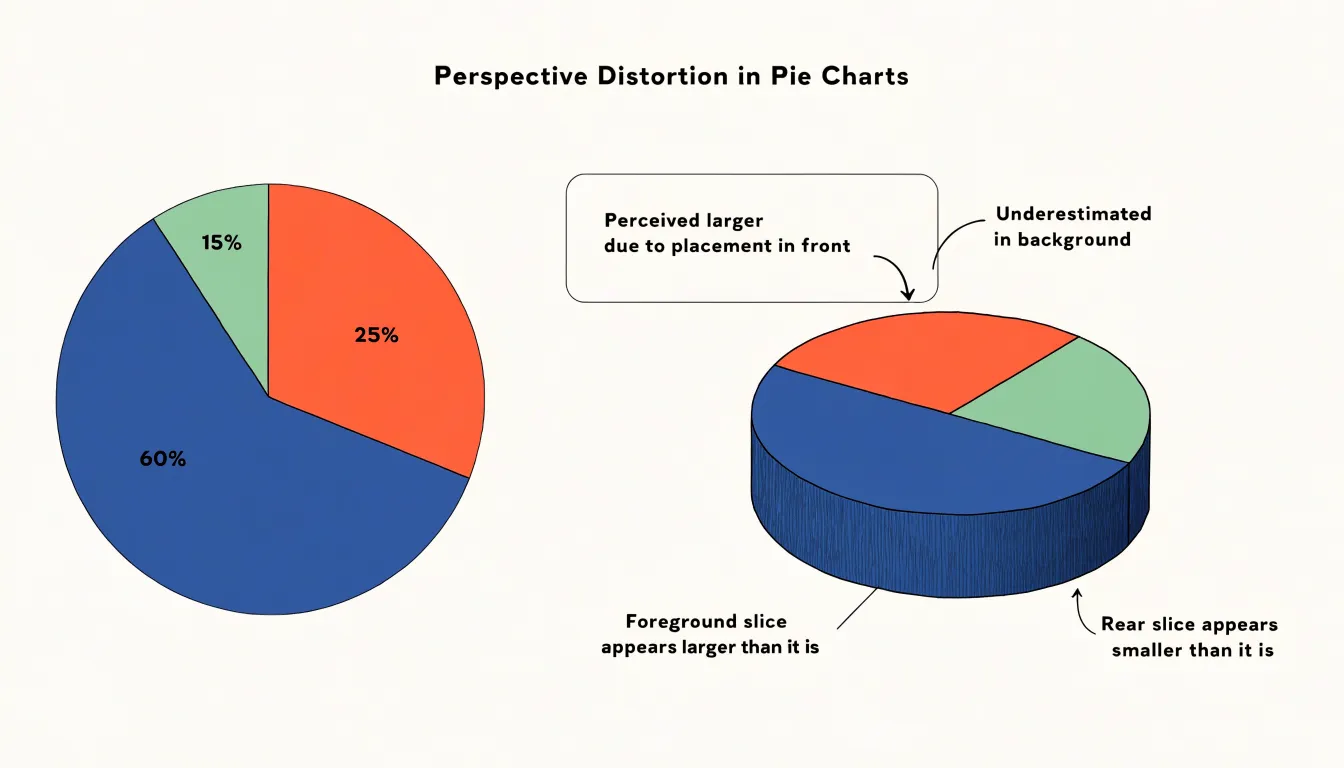
Three-dimensional effects introduce a separate and often larger distortion. Tilting a pie chart into an ellipse compresses the vertical axis, so slices positioned near the top and bottom of the ellipse appear foreshortened while slices near the sides retain more apparent width. A slice at the front of the tilted disc can look considerably larger than an equal slice at the back, purely because of perspective. Adding depth and a visible side wall worsens the problem, as the extruded area draws attention and lends extra visual weight to whichever slices happen to face the viewer. Studies of graphical perception have repeatedly found that viewers overestimate the size of foreground slices and underestimate those oriented away from them, with error rates that can exceed the actual differences between categories. Keep slices at genuinely distinct magnitudes and render the chart flat so that angle alone carries the comparison.
Pie Chart
Exploding slices—detaching a segment from the rest of the circle—introduces a specific kind of confusion that undermines a pie chart’s core purpose. Pulling a slice outward creates a gap that breaks the continuous geometry readers rely on to judge proportions. The eye no longer sees a single whole divided into parts; instead, it sees a collection of separate shapes competing for attention.
A pie chart communicates through the relative size of wedges that share a common center and radius. Once a slice is pulled outward, its boundaries shift, and readers have to mentally reconstruct the original circle to estimate how large the slice was relative to the others. This mental reconstruction is error-prone, especially when several slices are exploded at once. The gap adds white space that can make a segment appear larger or more significant than its true share, because the detached piece gains prominence through isolation rather than through measurable area.
Each exploded slice also adds visual clutter: another boundary, another shadow of a gap, and another point of visual interest that distracts from the overall pattern. Readers scanning the chart are drawn to the displaced segments first, which can imply a hierarchy of importance that the data does not support. In dense charts with many categories, multiple explosions can make the chart resemble a scatter of fragments. While a single exploded slice can highlight one category in a presentation context, for accurate reading of proportions, the detached segment trades clarity for decoration.
Pie Chart
When a report presents several pie charts side by side, the reader faces a quietly demanding task. Because human perception is better at judging lengths and positions than at comparing angles and arc areas, estimating proportions within a single pie is already approximate. Once individual pies are decoded, the reader must hold those several sets of proportions in memory and compare them across charts.
A slice that looks similar in two different pies may represent different absolute values, different totals, or a different position in the ordering of categories, and none of this is visible without deliberate cross-referencing. The reader effectively performs a mental join between several circular datasets, tracking which color corresponds to which category in each chart and reconciling the results. Working memory is occupied with remembering values from one pie while inspecting another, and the lack of a shared baseline between the circles gives the eye nothing stable to anchor the comparison. Small differences between slices are especially hard to detect and confirm across charts.
A bar chart removes most of this burden. All categories sit on a common axis with a shared scale, so corresponding bars line up directly and differences in length can be read at a glance along one dimension. For any question that involves comparing datasets, the bar chart asks far less of the reader and answers more reliably.
Donut Chart
The donut chart is a variation on the standard pie chart, distinguished by a circular hole in the center that transforms the solid disk into a ring. By removing the central area, the donut chart creates a natural focal point that can display key summary metrics—such as a total value, an average, a percentage, a label, or an icon—directly within the chart. The open center also provides a natural place for interactive elements, such as a hover effect that reveals details about a segment.
The hole reduces the visual weight of the chart, giving it a cleaner, contemporary appearance that works well in dashboards where space is limited. More importantly, removing the center angles allows viewers to focus on the length of each arc rather than the area of the wedge, which can make comparisons slightly easier.
Bar Chart
Bar charts rely on straight lines to represent values, with each bar’s length proportional to the quantity it encodes. Because length along a single consistent dimension is a well-calibrated perceptual channel, small differences between neighboring bars remain visible. A reader can rank categories accurately and estimate ratios with confidence, since doubling a value doubles the bar’s extent.
This quality matters most when comparing across distinct categories, such as sales figures for different regions, survey responses split among options, or populations of several countries. Because the bars share a common baseline, every value is measured against the same starting point, and the gap between any two bars reflects the true difference between their values. Readers can immediately identify the largest and smallest entries, then judge how far apart the middle values sit.
The linear encoding also supports annotation and reference lines without distortion. A target line drawn across the bars, or a labeled axis with regular tick marks, maps directly onto the lengths shown, so viewers can read approximate values off the chart and compare them against benchmarks. Grouped and stacked variants preserve this linearity within each segment, letting audiences compare both totals and their components in one view. For categories with long or numerous labels, horizontal bars keep text legible while maintaining the same straight-line measurement.
Stacked Bar Chart
A stacked bar chart extends the basic bar chart by dividing each bar into segments that represent sub-categories. The full height of each bar corresponds to the overall magnitude for that group, while the individual segments show how that total breaks down into its parts. This makes the stacked bar chart a useful tool for displaying part-to-whole ratios across several groups side by side, since a reader can compare totals between bars and simultaneously see how the mix of components shifts from one bar to the next.
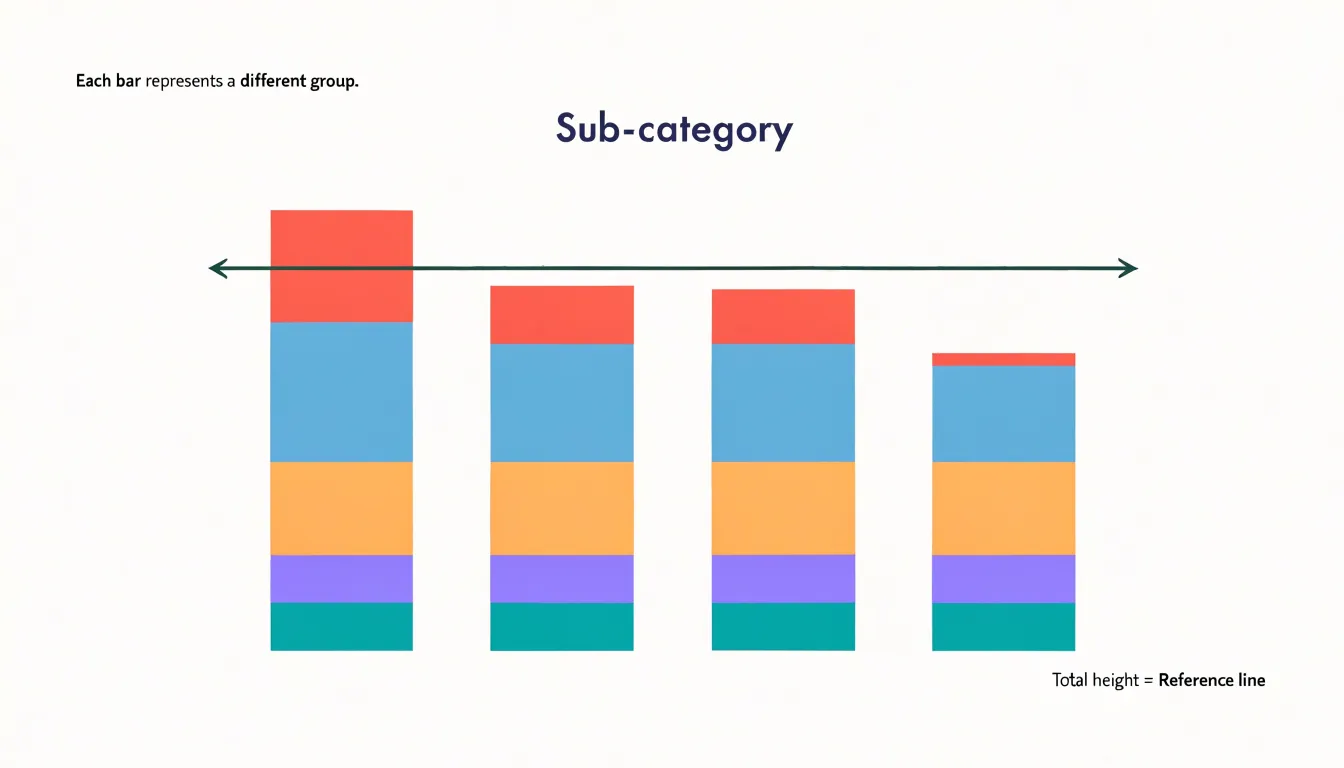
A common arrangement places categories along the horizontal axis, with each bar representing a group and each segment representing a sub-category within it. Segments are colored consistently across bars so that the same color always refers to the same sub-category. A segment that grows from left to right reveals a sub-category gaining share, while a shrinking segment signals the opposite.
Stacked bars work best when the number of segments stays modest, since too many thin slices become difficult to distinguish. Ordering the segments in a meaningful way, such as from largest to smallest or by a natural sequence, helps readers interpret the composition quickly. When the goal is to compare the size of individual segments rather than totals, a grouped bar chart may serve better, as unaligned interior segments do not share a common baseline.
Treemap
A treemap displays part-to-whole data through nested rectangles, where each rectangle’s area corresponds to a value in the dataset. The largest rectangle occupies the most space, and smaller rectangles fill the remaining area in proportion to their share of the total. This design makes treemaps especially effective when a dataset contains dozens or even hundreds of categories—a volume that would make a pie chart unreadable.
The real strength of a treemap lies in its hierarchical structure. Rectangles can contain smaller rectangles, so a top-level category such as a department can be subdivided into teams, and each team into individual projects. Viewers see the overall composition while tracing how sub-parts contribute to the whole. Color can reinforce the hierarchy, with shades distinguishing groups and subgroups.
Treemaps handle large quantities of part-to-whole data efficiently because they pack space tightly across two dimensions. Even small values remain visible as slivers and squares, and the overall footprint stays compact, making treemaps useful for dashboards, file storage breakdowns, and budget allocations within a limited screen area. Because viewers compare rectangle areas rather than lengths, and very small rectangles can be hard to label, adding tooltips, clear borders, and consistent color scales helps make the chart readable.
Pie Chart
Ordering pie slices from largest to smallest establishes a predictable hierarchy that readers can grasp almost instantly. Starting at the 12 o’clock position and moving clockwise creates a natural rhythm that aligns with how many readers scan visual information. Placing the largest slice first immediately communicates the dominant category, while subsequent slices arranged in descending order allow readers to compare relative sizes without hunting for the next largest segment.
Without a clear ordering principle, a pie chart can appear chaotic and force viewers to expend unnecessary mental energy deciphering the arrangement. Adopting the largest-to-smallest clockwise convention also aids memory and standardizes the reading experience across contexts: if multiple pie charts appear in a report following the same ordering rule, readers can more quickly locate and compare corresponding categories.
Pie Chart
In a pie chart, color is the first language a viewer reads, arriving before labels, legends, or numbers. Strategic color choices let an analyst draw immediate focal attention to the insight that matters most. A restrained palette establishes a calm baseline across the ordinary slices, while one saturated or unusually deep hue marks the segment worth noticing. This contrast works through value and saturation as much as through hue, so a single dark wedge among lighter neighbors pulls focus just as effectively as a vivid accent against muted tones.
Every extra color competes for attention, so thoughtful color hierarchy maps meaning onto appearance:
- Primary insight: Receives a distinctive, high-contrast treatment (vivid accent or deep value).
- Secondary categories: Share a common family of tones.
- Remaining elements: Recede into quiet neutrals.
- Sequential or ranked categories: Use progressive shades within a single hue to suggest order without adding visual noise.
Ensuring sufficient lightness contrast between adjacent slices and avoiding pairings that confuse viewers with color vision deficiencies keeps the highlighted insight legible to everyone. Treat color as a spotlight rather than decoration.
Pie Chart
Direct labeling places each category name, and often its value or percentage, next to or inside the corresponding slice. This eliminates the need for a separate legend, which otherwise forces the eye to travel back and forth between a color swatch and a slice—an error-prone matching exercise when similar hues appear.
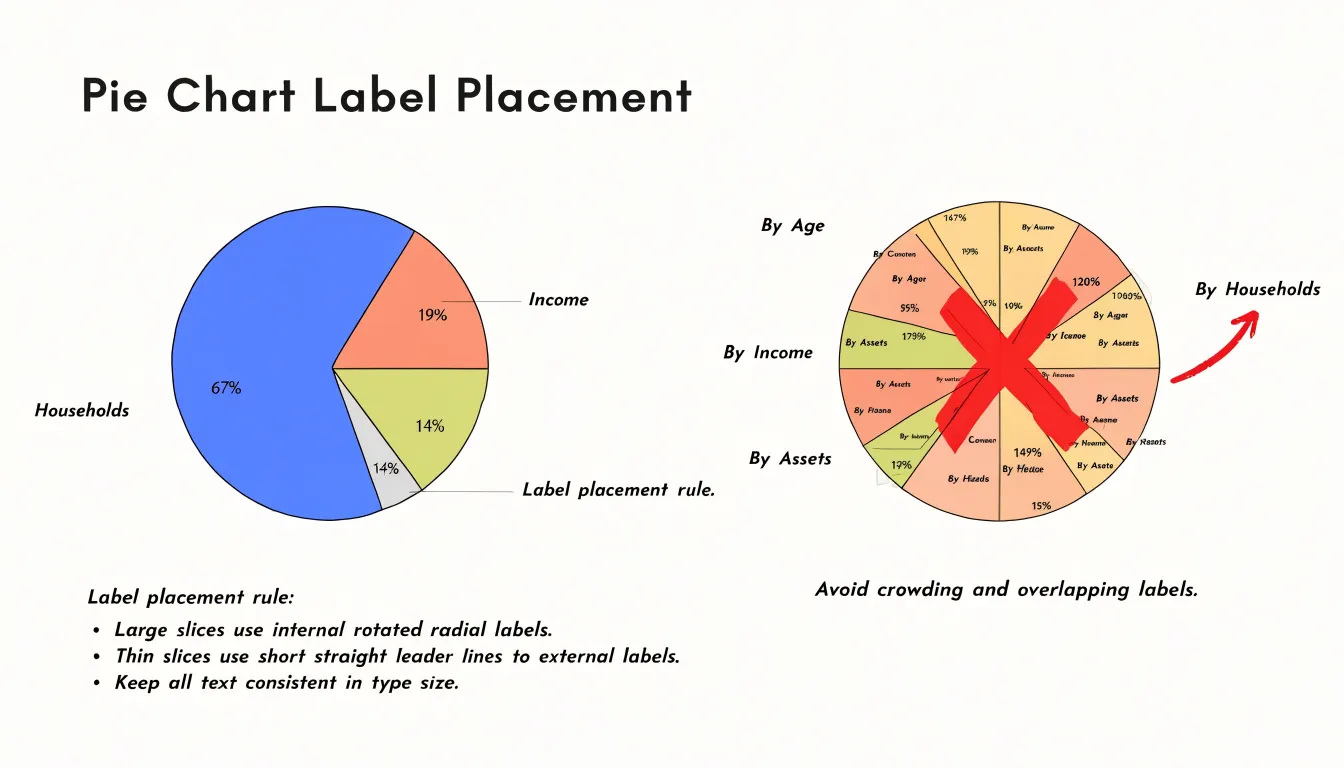
Match the label placement to the geometry of the wedge:
- Larger slices: Use an internal label set along the slice’s radius; rotating the text so it reads outward from the center keeps it aligned with the wedge.
- Thinner slices: Place an external label just beyond the arc to avoid squeezing text into a tight space, using short, nearly straight leader lines to connect the label to its slice without ambiguity.
- Dense annotations: Use line callouts (a short stroke or bracket) to tie a compact annotation to its target.
To prevent clutter when several labels crowd the same region of the circle, vary the radial distance of external labels so adjacent callouts do not overlap, and maintain consistent type size and alignment across all labels. Ordering slices by size and grouping the smallest categories into a single remainder slice further ensures that every wedge has enough room to be identified in place.
Pie Chart
Roughly one in twelve men and one in two hundred women experience some form of color vision deficiency, most commonly involving difficulty distinguishing red from green or blue from yellow. A pie chart that relies on a default rainbow palette risks collapsing several slices into an indistinguishable mass for a meaningful share of any audience.
Accessible palette standards offer a practical remedy: tools such as the Okabe-Ito palette, ColorBrewer’s colorblind-safe schemes, and the Viridis family provide sets of hues that remain distinguishable under deuteranopia, protanopia, and tritanopia simulations. Designers can test candidate palettes by running them through simulation tools or grayscale conversion, confirming that neighboring slices retain clear separation in both hue and lightness. Pairing darker and lighter tones within a scheme adds redundancy that survives even severe color vision deficiency.
Texture patterns supply a second channel of information so each slice can be identified by fill style as well as by hue. Diagonal hatching, dots, crosshatch, and vertical or horizontal lines can be assigned consistently across the chart and echoed in the legend if one is used. Keep contrast between the pattern and the slice background strong enough to read at small sizes, and keep pattern density low enough that the slice’s overall hue remains visible. Avoid fine patterns that shimmer on screen or blur when printed. Combining a tested palette with distinct textures, generous white space (or clear borders) between segments, and direct labeling ensures the data remain legible regardless of how a reader perceives color.
Pie Chart
Small design decisions in a pie chart can steer a viewer toward a conclusion the data does not actually support. Beyond the geometric distortions of 3D perspective and exploded slices, wedges drawn with rounded or irregular edges also warp the apparent central angle and area. Rotating the chart so that a favored slice lands at the top or on the right can inflate its perceived importance, since viewers tend to start reading at a familiar position and give that first wedge more weight. Similarly, applying a single saturated color against muted neighbors makes one slice dominate the visual field even if its numerical share is modest, while inconsistent label ordering forces the viewer to hunt and compare.
Selective scaling introduces a different set of biases. Because a pie chart implies that its slices represent parts of one whole, every slice must be measured against the same total. Mixing categories from different levels of a hierarchy, omitting small values without accounting for them in a labeled remainder, or grouping unrelated items into a single large wedge can make the overall picture misleading even when each individual number is accurate. Choosing whether to include or exclude a category changes the relative size of every other wedge in the circle. Keeping the geometry two-dimensional, enforcing a single shared total, and using honest color and ordering choices lets the data speak without visual interference.
Dashboard
When assembling charts into a dashboard, a summary decision tree helps match each dataset to the right visual form:
- Determine the nature of the data: categorical or continuous?
- If categorical, is the goal to show parts of a whole or to compare individual categories?
- Parts of a whole: Use a pie chart or donut chart when there are few categories (ideally five or fewer) and meaningful differences between slices. Use a stacked bar chart to compare part-to-whole composition across multiple groups, or a treemap for hierarchical data with dozens or hundreds of categories.
- Compare categories: Use a bar chart so values share a common baseline for precise length comparisons.
- If continuous, is the focus on distribution, trend over time, or relationship between variables?
- Distribution: Use a histogram.
- Trend over time: Use a line chart.
- Relationship between variables: Use a scatter plot.
Before publishing a report or dashboard, run through a final fit checklist to ensure visual balance and accuracy:
- Chart-to-data fit: Does each chart type align with the structure of the data and the specific question being answered?
- Mathematical integrity: Do part-to-whole charts represent mutually exclusive categories that sum to 100 percent without selective omission?
- Color economy and accessibility: Are colors used consistently across the dashboard, limited to a few distinct hues, and tested for colorblind accessibility and lightness contrast?
- Clear labeling: Are slices and bars directly labeled where possible, with uncluttered text and no unnecessary legends?
- Layout and hierarchy: Does the overall layout guide the eye logically from one element to the next, maintaining a balance that is neither cluttered nor sparse, with every chart contributing to the overarching summary without redundancy?
Frequently Asked Questions
What is a pie chart used for?
A pie chart is a circular graphic divided into slices that show how a whole dataset breaks into categories, and all slices together add up to 100 percent. It works best for displaying static composition when categories are mutually exclusive and account for everything measured.
How many slices should a pie chart have?
A pie chart works best with a small set of categories, usually between three and six, and limiting it to five or six preserves clarity. If more categories crowd the circle, group the smallest into a single “Other” or “Miscellaneous” slice placed at the end.
Why are 3D pie charts misleading?
Tilting a pie chart into an ellipse compresses the vertical axis, so foreground slices can look larger and slices oriented away can look smaller than they are. The article recommends keeping slices at distinct magnitudes and rendering the chart flat so angle alone carries the comparison.
Are exploded slices in a pie chart effective?
Exploding a slice breaks the continuous geometry readers use to judge proportions, and the gap can make the segment appear more significant through isolation. A single exploded slice can highlight a category in a presentation, but for accurate reading of proportions it trades clarity for decoration.
How can I make a pie chart accessible for people with color vision deficiency?
Roughly one in twelve men and one in two hundred women experience some form of color vision deficiency, so a default rainbow palette can make slices indistinguishable. Use tested colorblind-safe palettes, pair darker and lighter tones, add texture patterns, and use direct labeling to keep slices identifiable.
Should I use multiple pie charts to compare datasets?
The article says comparing several pie charts side by side makes readers hold proportions in memory and cross-reference categories, and small differences are especially hard to detect. A bar chart removes most of this burden because all categories share a common axis and differences in length can be read at a glance.
Tony Astor
Tony writes about data visualization and the tools people use to build charts and dashboards. More about Data Illustrator