Pie Chart vs Waffle Chart: Which Is Easier to Read?
 By Tony Astor ·
Pie Chart vs Waffle Chart
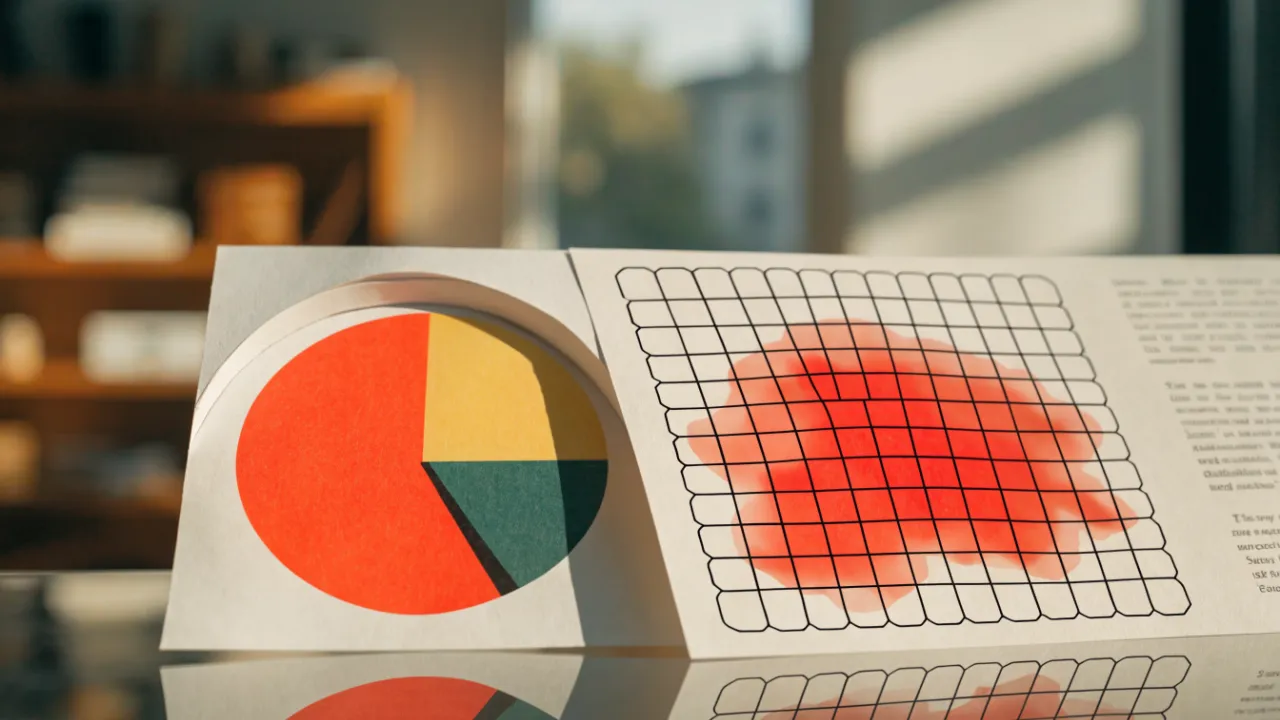
A pie chart shows part-to-whole data as a circle divided into slices, each slice’s angle proportional to its share of 100 percent. A waffle chart shows the same percentages as a 10x10 grid of 100 squares, where each square equals one percent, making values countable and small differences easier to compare accurately.
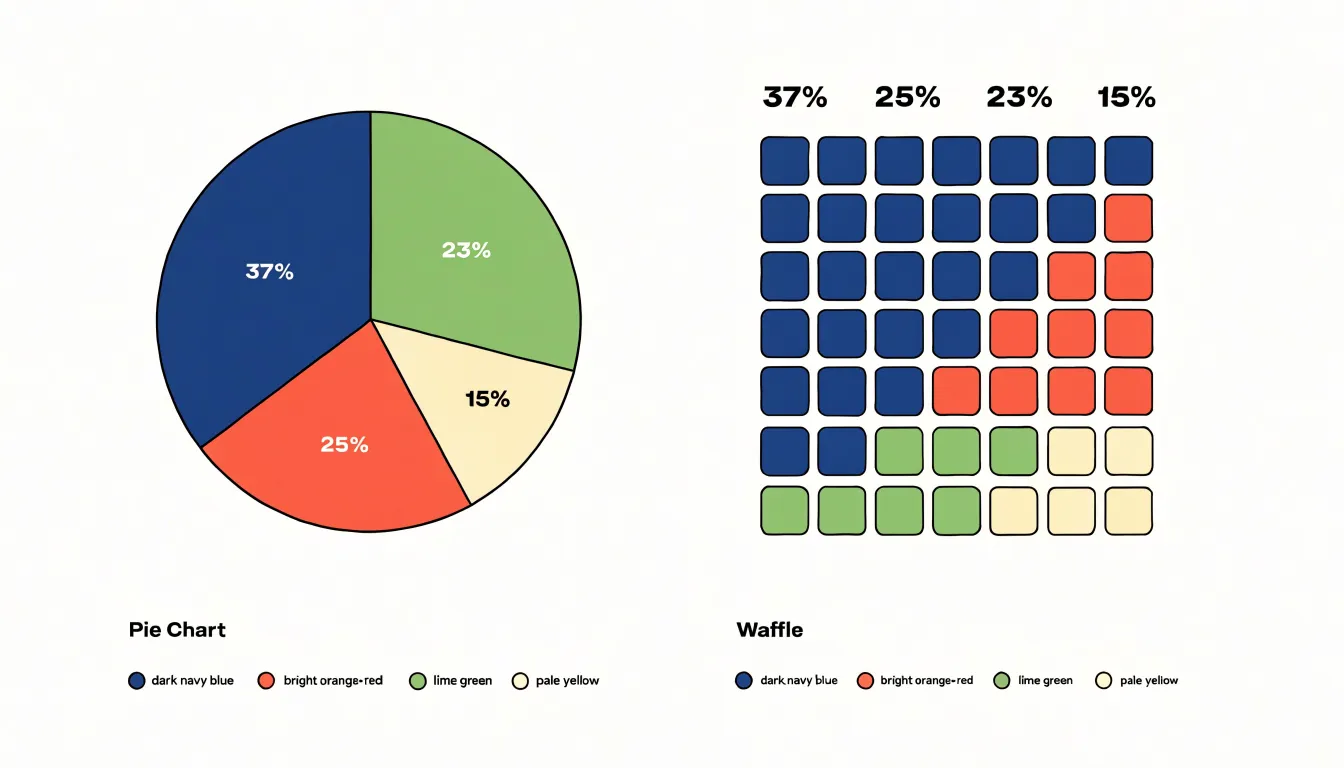
Table of Contents
Pie Chart
A pie chart represents a single categorical variable as a circle divided into slices, where the full 360 degrees corresponds to 100 percent of all categories combined. Each category occupies an angular wedge proportional to its share of the total. To build one, an analyst sums the values across all categories, then converts each individual value into an angle by multiplying its fraction of the total by 360 degrees. A category holding 25 percent of the total receives a 90-degree slice, while one holding 10 percent receives 36 degrees.
The circle gives readers an immediate, holistic sense of composition, making the form well suited to budget allocations, survey responses, or market share—data where a fixed quantity splits among a handful of named groups. Slices are conventionally ordered by size, starting from the twelve o’clock position and moving clockwise, and are distinguished by color with labels or a legend connecting each wedge to its category.
Because human perception judges angles less precisely than lengths, pie charts work best when categories are few and the differences between them are large. Under those conditions, readers can quickly identify the dominant slice and the general balance among the rest.
Waffle Chart
A waffle chart represents percentages through a compact grid of squares, most commonly arranged as a 10x10 layout containing 100 individual tiles. Each tile stands for one percent of the total, so the full grid represents a complete whole. To display 37 percent, 37 tiles are filled with color while the remaining 63 stay a neutral shade. Every unit of the percentage is physically present on screen, allowing readers to count or estimate the filled tiles to find the value.
The 10x10 structure makes counting intuitive. Because each row holds ten tiles, a completed row equals ten percent, and half a row equals five percent. Readers can scan the full rows and count the partial row to reach a precise figure. The grid imposes a fixed framework where each square occupies the same size and position, so changes across categories or time appear as tiles switching from empty to filled.
A single grid can also handle multiple categories by filling separate groups of tiles with different colors. This makes waffle charts useful for survey results, budget allocations, or progress toward a goal, where audiences benefit from seeing exact proportions rather than approximate areas.
Visual Perception
Research in visual psychophysics shows that people judge lengths and positions with high precision, while judgments of angle and area are considerably less reliable. When a viewer looks at a pie chart, they must compare circular sectors by estimating both the central angle of each slice and the area enclosed by its arc. Small angle differences are difficult to discriminate, and the curvature of the outer edge makes it hard to anchor a mental reference line. These limits are compounded by biases such as the tendency to overestimate acute angles and the difficulty of mentally aggregating curved regions. As a result, similarly sized slices frequently appear identical, or the wrong slice appears larger.
A waffle chart translates proportions into countable units. The viewer’s task shifts from geometric estimation to enumeration and rapid pattern matching. Detecting the boundaries of discrete objects, comparing aligned edges, and tallying repeated units are operations humans perform quickly and with low error. Because every square is identical, comparison reduces to counting, which is far less susceptible to optical illusion than area estimation. Viewers therefore read waffle charts more accurately and quickly than pie charts, particularly when proportions are close in value.
Comparing Small Differences
When two pie slices are close in size, such as 23% and 25%, the difference corresponds to just 7.2 degrees of arc. Two wedges that vary by only a few degrees look nearly identical at a glance, forcing viewers to rely on text labels rather than geometry. The circular layout compounds the problem: slices in different orientations are hard to compare directly, and the eye tends to anchor on the radius rather than the arc length. Small but meaningful shifts in share disappear into the overall shape.
In a 10x10 waffle chart, 23% fills 23 cells and 25% fills 25 cells, so the gap appears as exactly two distinct squares. Even a one-point difference is unambiguous. This makes waffle charts effective when the story lies in modest movements: a campaign that nudged a segment up two points, a product whose share crept up slightly, or survey results where respondents split into closely matched groups.
Handling Many Categories
A pie chart works best with two to five slices. Beyond that range, individual wedges shrink toward slivers, making small differences—such as a five percent slice versus a four percent slice—nearly invisible.
Labeling space also tightens quickly. Small wedges leave no room for internal text, pushing labels outside the chart where they connect via crisscrossing leader lines. The reader spends more effort tracing lines than understanding data. Color palettes face similar strain: a palette that distinguishes five categories comfortably often produces hard-to-distinguish shades when stretched to eight or ten.
The result is clutter that collapses the visual hierarchy, preventing readers from easily ranking categories or identifying extremes. A waffle chart remains legible across more categories because its grid of equal units preserves a countable number of cells even for small shares.
Space and Layout
Waffle grids fit naturally into report layouts because their rectangular footprint mirrors the geometry of the page. A 10x10 grid slots neatly into a column, aligning its outer boundary with text margins. In a fixed-width dashboard sidebar, a waffle chart expands or contracts in even steps, keeping its proportions intact and occupying a predictable block of vertical space regardless of how many categories it shows.
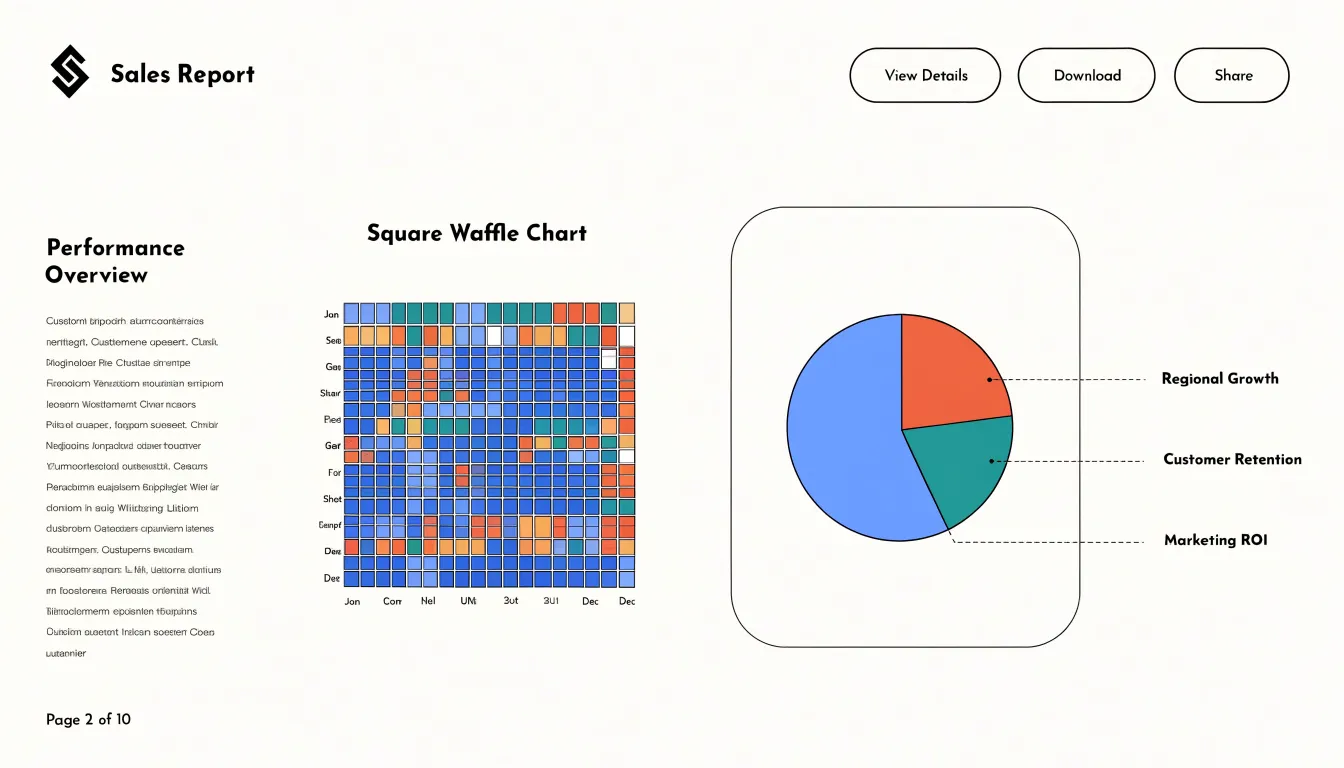
Circular pie charts demand more care. A circle inscribed in a rectangular frame leaves empty corners, which can make the chart look smaller than its allotted area or push body text uncomfortably close to the curved edge. Designers often compensate by giving the pie a generous bounding box, centering it against a text column, or floating it in a sidebar with ample breathing room. Segmented labels and leader lines extend the visual footprint further, requiring extra space beyond the disc itself.
At smaller scales, a waffle chart can sit inline beside a paragraph and remain legible because its cells still read as discrete units. Pie charts usually require a larger central position or dedicated panel to avoid cramped slivers. Using consistent gutters, shared baseline alignment, and matching outer dimensions keeps either chart type integrated into the page.
Mobile Viewing
On narrow smartphone displays, pie charts often become difficult to read as labels overlap and small slice angles blur together. Waffle charts scale down more responsively because their rows and columns provide a consistent reference frame even at reduced sizes.
The compact grid can be displayed without scrolling or zooming, and individual squares can be sized to serve as accessible tap targets for interactive tooltips. Designers can also apply responsive breakpoints, adjusting the number of squares per row to fit different screen widths while keeping the overall representation intact.
Accessibility
Relying solely on color to distinguish segments excludes viewers with color blindness or low vision. For both chart types, assign each category a distinct high-contrast pattern—such as diagonal lines, dots, or crosshatching—paired with strong luminance contrast against the background. In waffle charts, applying patterns to groups of cells differentiates categories without sacrificing granularity. Place high-contrast, large-font text labels directly on or adjacent to the segments.
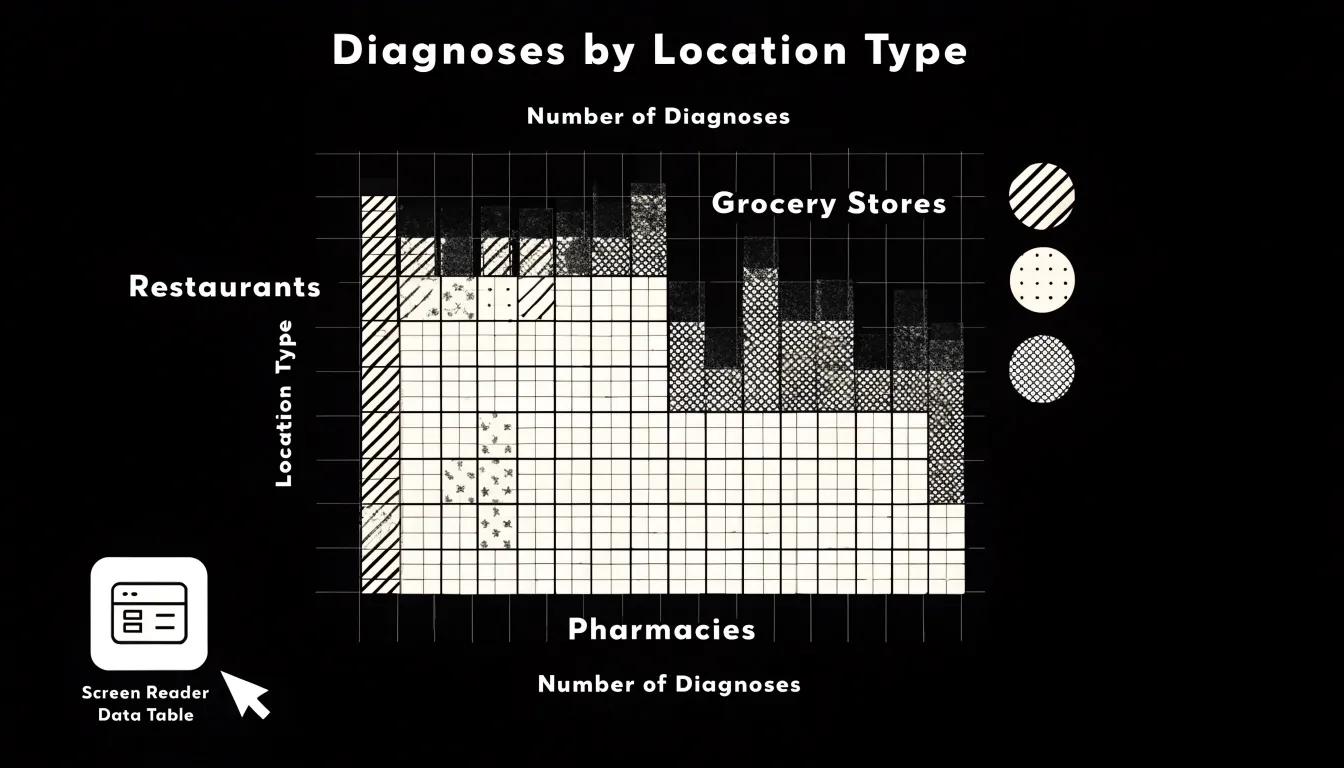
For screen-reader users, include alternative text (alt text) summarizing the key message, along with a detailed description in the surrounding text or a linked data table. For interactive web charts, implement ARIA (Accessible Rich Internet Applications) roles and properties: mark the chart as an image with a descriptive label, and ensure interactive elements like tooltips or filters are keyboard-navigable and announced by screen readers. Providing a hidden, screen-reader-accessible data table that lists each category’s label, value, and percentage is effective for both formats. Finally, test with actual screen readers and users with disabilities to verify the implementation.
When to Use Pie Charts
Pie charts work well in a narrow set of circumstances:
- Simple binary proportions: When one variable divides into two parts—such as yes/no survey responses or a single budget category against everything else—the reader only has to compare one arc against its complement.
- Familiar fractions: Viewers instantly recognize a 50/50 split, one-quarter, or three-quarters at a glance. Because the reader is recognizing a familiar shape rather than estimating a precise value, fine-grained accuracy is unnecessary.
- Small, distinct part-to-whole summaries: For annual budgets, survey distributions, or market share summaries with two or three categories and large differences between slices, the circle reinforces conceptual completeness and delivers its message without explanation.
When to Use Waffle Charts
Waffle charts are best suited for counting, tracking progress, and comparing multiple items:
- Progress tracking: If a project stands at 63 percent completion, showing 63 filled cells against 37 empty ones communicates both what has been achieved and what remains.
- KPI completion metrics: Discrete targets, such as 100 sales calls or 1,000 units shipped, map naturally onto a fixed grid where filling cells one by one shows distance to the goal.
- Multi-item comparisons: Stacking several waffle charts side by side lets viewers compare how colored segments shift across product lines, categories, or time periods while retaining a sense of actual counts.
Design Mistakes
Several common errors undermine proportional charts:
- 3D effects: Tilting a chart distorts the apparent size of slices or cells. Segments pulled toward the viewer look larger than they are, while added shading and perspective introduce visual noise.
- Overwhelming color palettes: Using a dozen bright or closely related hues forces readers to consult the legend repeatedly. Use a restrained palette with one accent color for the most important segment.
- Missing data labels: Omitting percentage values or category names forces readers to estimate proportions by eye or guess what each unit represents. State values directly on or beside the chart, and use plain category names in the legend.
- Poor ordering and sizing: Including slices too small to perceive, leaving excessive white space, or ordering categories randomly rather than by size turns a simple comparison into a puzzle.
Color and Contrast
Intentional color grouping clarifies structure in both formats: related categories can share a family of shades, while distinct segments receive clearly separated hues. In a waffle chart, shared tones allow clusters of individual squares to read as a single block; in a pie chart, hue or lightness separation prevents adjacent wedges from merging visually.
Strong contrast depends on lightness and saturation as well as hue. Placing a dark segment next to a light one creates a crisp edge, whereas two mid-tone colors of similar value blur together at small sizes or on projectors. A single saturated accent color against a muted palette draws the eye to the primary category or target value. To support readers with color vision deficiencies, vary lightness alongside hue and avoid red-green pairings.
Data Accuracy
Because a pie chart encodes value along a curved edge judged against an implied center point, even data precise to a decimal place is often read as a rough verbal category like “a quarter” or “a third.”
A waffle chart’s visible grid lines support exact retrieval. If one category is 37 percent and another is 41 percent, the four-square gap is unambiguous, and different readers counting the cells will arrive at the exact same figure. When audiences must extract specific numbers from the graphic itself, the grid ensures the values taken away match the dataset.
Dashboard Overview
On executive product dashboards, pie and waffle charts serve complementary roles. A pie chart suits a single, stable composition—such as active users by subscription tier or revenue across product lines—placed in a summary tile near the top of the page. A waffle chart works as a visual scoreboard for adoption targets, feature rollout coverage, or seat utilization, especially when placed directly beside its target value.
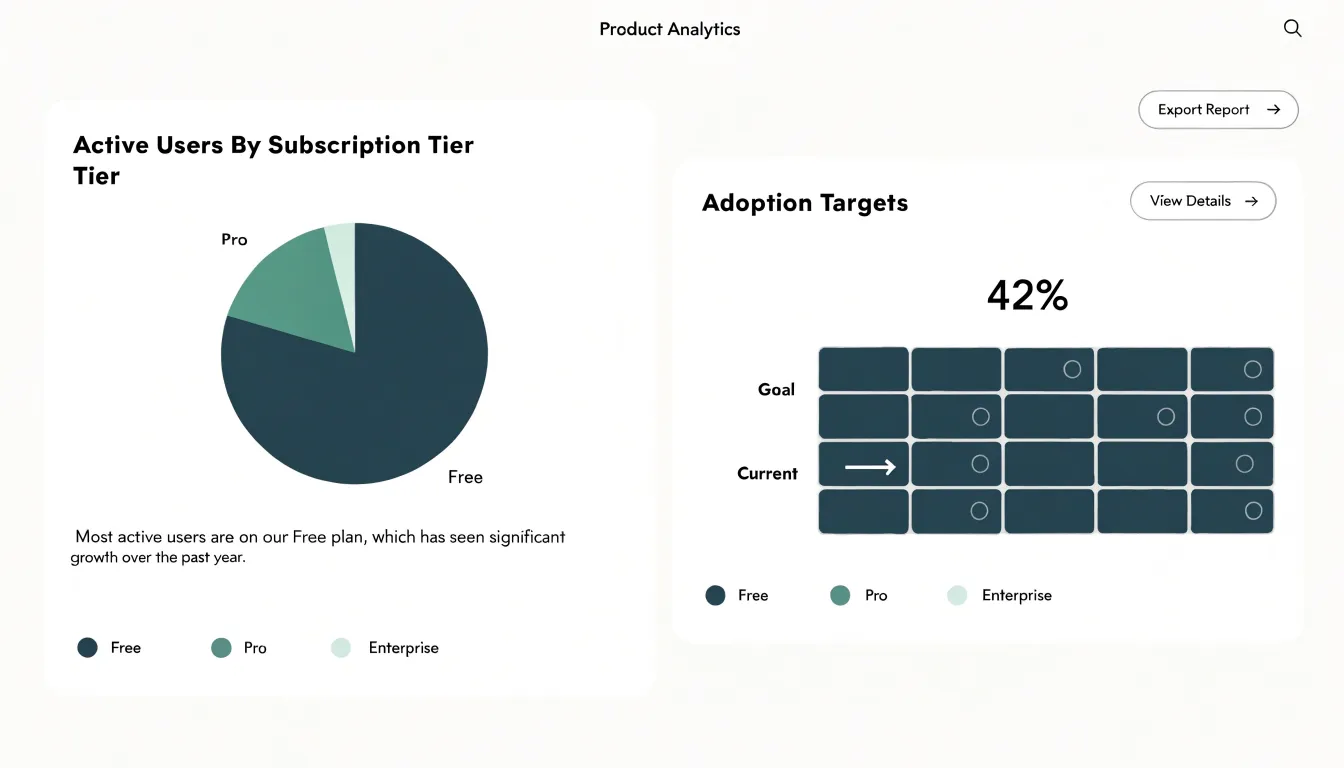
To integrate both formats cleanly, use shared color palettes, matching labels, and uniform legends so viewers do not have to relearn encodings between visuals. Position composition charts near headline metrics and progress grids near goal statements. Finally, annotate each chart with a short takeaway line—such as “Enterprise tier now holds 42 percent of active accounts”—to convert visual proportions into decision-ready statements.
Frequently Asked Questions
What is the difference between a pie chart and a waffle chart?
A pie chart represents a categorical variable as a circle divided into slices whose angles correspond to each category’s share of the total. A waffle chart uses a grid, most commonly 10x10, where each of the 100 tiles represents one percent of the total.
How do you read a waffle chart?
Each filled tile represents one percent, so 37 percent is shown as 37 filled tiles out of 100. Because each row holds ten tiles, a completed row equals ten percent and half a row equals five percent.
Which is better for showing small differences, a pie chart or a waffle chart?
A waffle chart makes small differences clearer because the gap appears as countable tiles, such as 23% filling 23 cells and 25% filling 25 cells. In a pie chart, a difference such as 23% versus 25% corresponds to only 7.2 degrees and can look nearly identical at a glance.
How many categories should a pie chart have?
A pie chart works best with two to five slices. Beyond that range, individual wedges shrink toward slivers and small differences become nearly invisible, while labels, leader lines, and colors become harder to manage.
When should I use a pie chart?
Pie charts work well for simple binary proportions, familiar fractions like a 50/50 split or one-quarter, and small, distinct part-to-whole summaries with two or three categories and large differences between slices.
Are pie charts and waffle charts accessible?
Relying solely on color to distinguish segments excludes viewers with color blindness or low vision, so both chart types should use distinct high-contrast patterns paired with strong luminance contrast and large text labels. For screen-reader users, include alt text summarizing the key message, a detailed description or linked data table, and ARIA roles and properties for interactive web charts.
Tony Astor
Tony writes about data visualization and the tools people use to build charts and dashboards. More about Data Illustrator