Pie Chart vs Donut Chart: Differences and When to Use Each
 By Tony Astor ·
Pie Chart vs Donut Chart
A pie chart shows parts of a whole as filled slices radiating from the center, while a donut chart removes the center to create a ring. Both use angles and arc length to show proportions. Donut charts add space for a total or KPI in the middle and feel visually lighter.
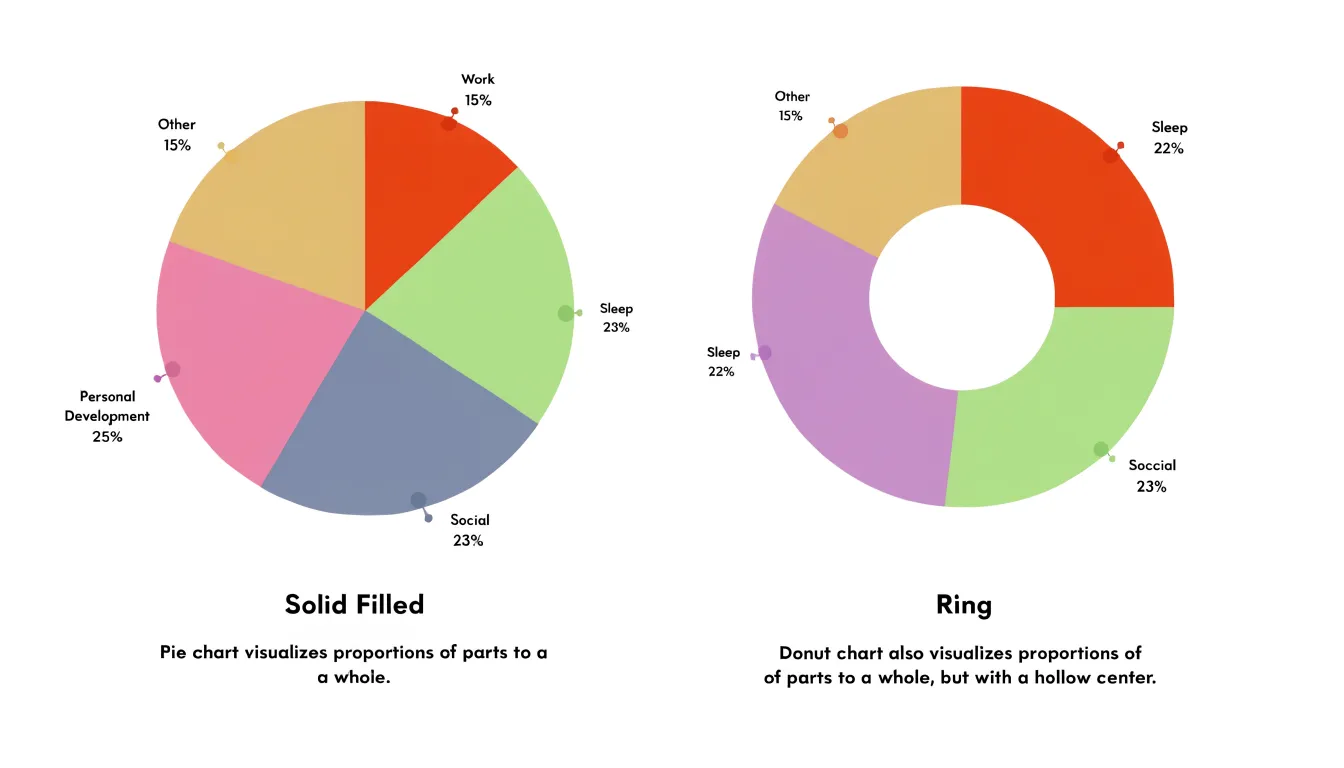
Table of Contents
Pie Chart
A pie chart represents a single dataset divided into slices, where each slice corresponds to a category and the entire circle stands for the total. The size of each slice is proportional to its value, so a category accounting for a quarter of the total occupies 90 degrees of the circle’s angle. This direct geometric mapping lets viewers grasp at a glance how a budget splits across departments, how market share distributes among competitors, or how survey respondents divide across answers.
The traditional pie chart works best when the data describes a single category broken into a small number of segments, typically five or fewer. Labels or percentage values placed directly on or beside each slice let the audience connect a category to its share of the total without consulting a legend or performing calculations. When the goal is straightforward—such as identifying the largest segment or confirming that two categories form roughly half the whole—the pie chart delivers that message cleanly.
Slices are usually arranged clockwise from largest to smallest, starting at the twelve o’clock position, giving readers a predictable path through the data. Because the human eye judges angles less precisely than lengths, a pie chart communicates broad proportions reliably while finer distinctions between similar slices become harder to resolve.
Donut Chart
A donut chart removes the center of a pie chart, creating a ring-shaped visualization that preserves the proportional relationships between slices. Removing the center does not alter how each segment’s angular measure and arc length correspond to its share of the total.
The open center provides a location for a summary metric, legend, or brief annotation without cluttering the chart area. Designers can also adjust the ring width for visual emphasis, making donut charts flexible enough for space-limited dashboards and reports where multiple charts appear together and a summary figure needs to be visible at a glance.
Visual Differences
The central cutout directly affects how viewers read the data. In a standard pie chart, each slice is a solid wedge radiating from the center. The eye is drawn to the full area of the wedge, and viewers compare categories by estimating the relative size of these filled regions. Because area increases with the square of the radius, even small differences in angle can produce noticeable differences in perceived slice size, especially when slices are large.
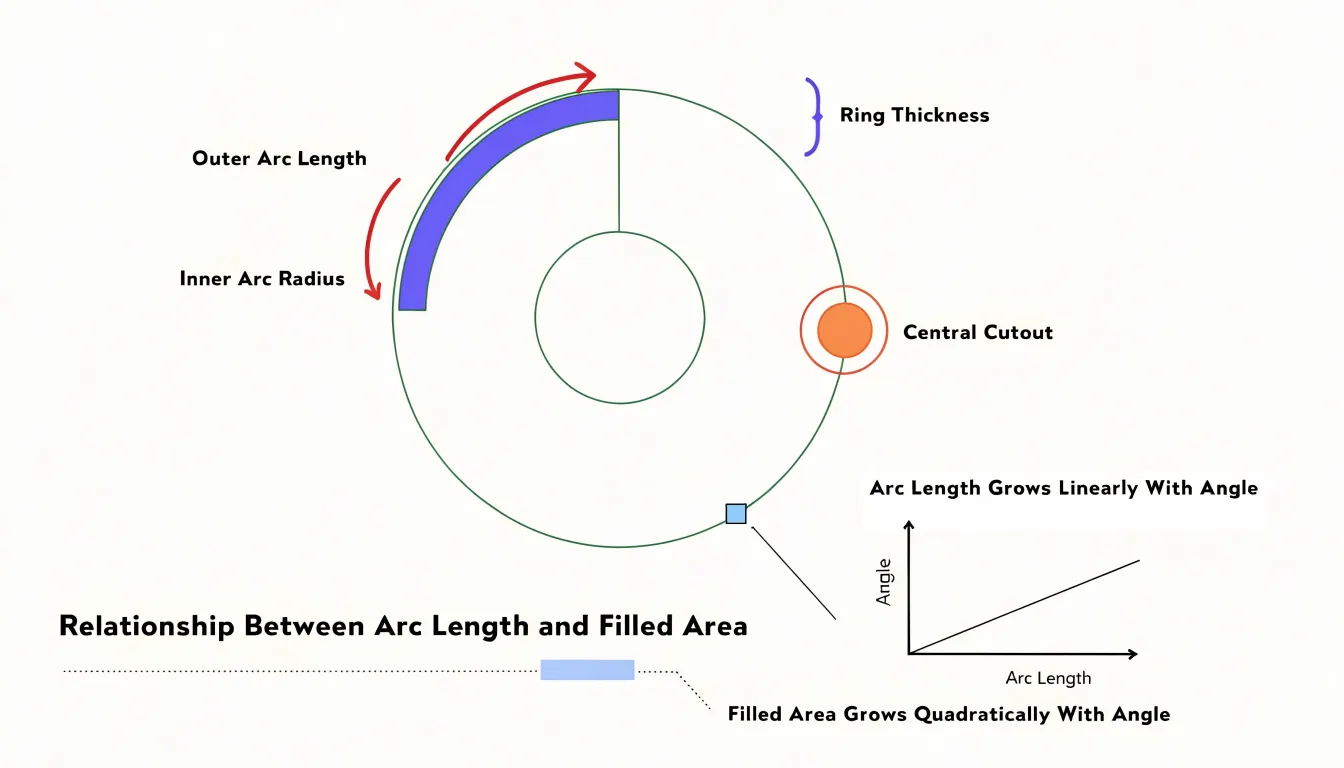
With the middle hollowed out in a donut chart, each segment becomes a curved band of uniform thickness. The dominant visual cue shifts from enclosed area to the length of the outer arc. This change tends to make small differences between categories easier to detect, since arc length grows linearly with angle while area grows quadratically.
At the same time, the empty center reduces the chart’s overall visual weight, making the display feel lighter and less dense. The hole also introduces an implicit reference circle, and viewers may unconsciously compare each arc against that inner boundary. In practical terms, the donut format encourages a scanning motion around the ring rather than a comparative glance across filled wedges, explaining why the two chart types often leave readers with different impressions of the same proportions.
Slice Limits
As the count grows past five or six categories, a circular chart turns into a puzzle that demands effort to decode. Each additional slice introduces another angle to compare, another color to identify, and another label to position without overlapping its neighbors. By the time a chart holds ten or twelve categories, the reader is forced to jump back and forth between the chart and a tall legend in a manual lookup exercise.
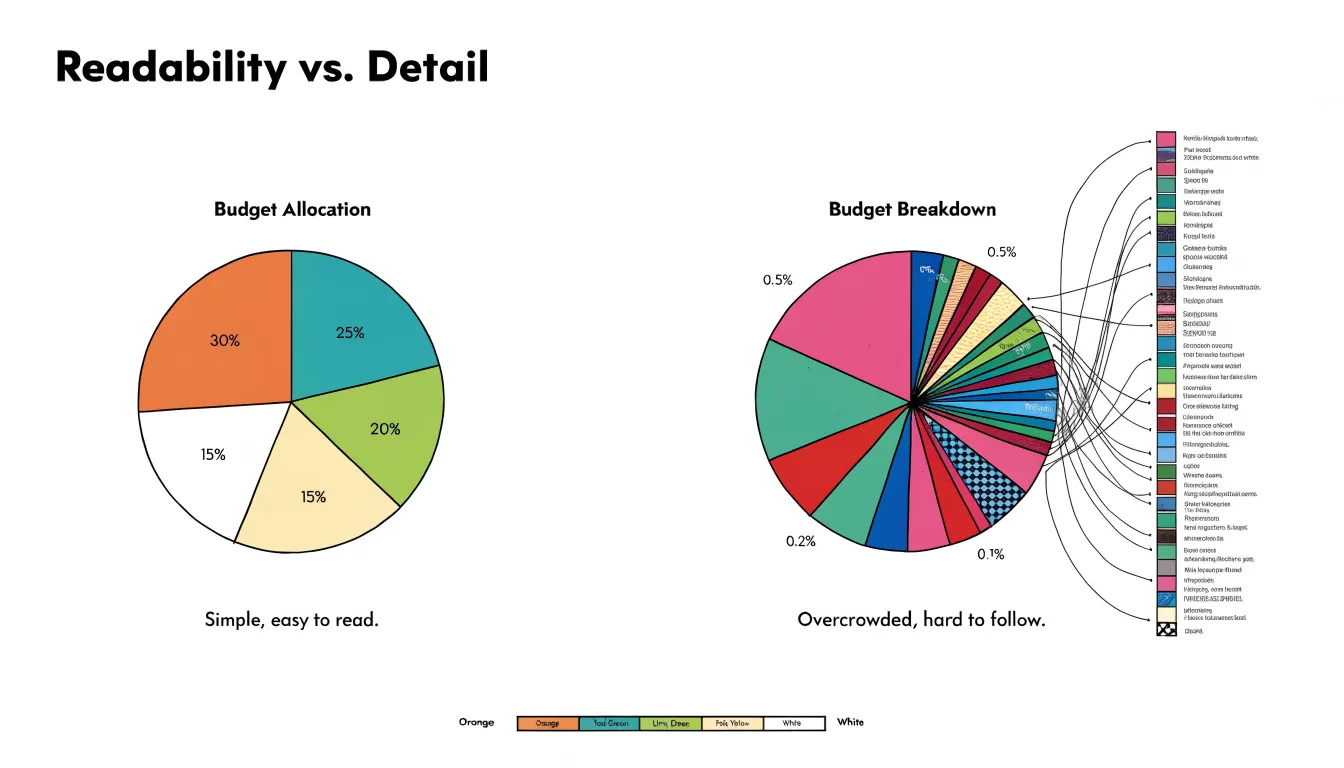
Visual crowding compounds the problem. Small slices produce thin wedges whose angles are nearly impossible to compare accurately. Labels for those wedges spill into surrounding space or scatter across the chart with crisscrossing leader lines, and colors multiply until shades become indistinguishable.
Restricting the chart to five or six categories keeps wedges large enough to register clearly, gives labels room to sit directly on or beside their slices, and allows for a small palette of distinct colors. When the data contains more categories, the standard remedy is to group the smallest ones into a single combined segment or switch to a bar chart.
Center Space
The hollow center of a donut chart transforms empty space into a functional element that supports the surrounding segments:
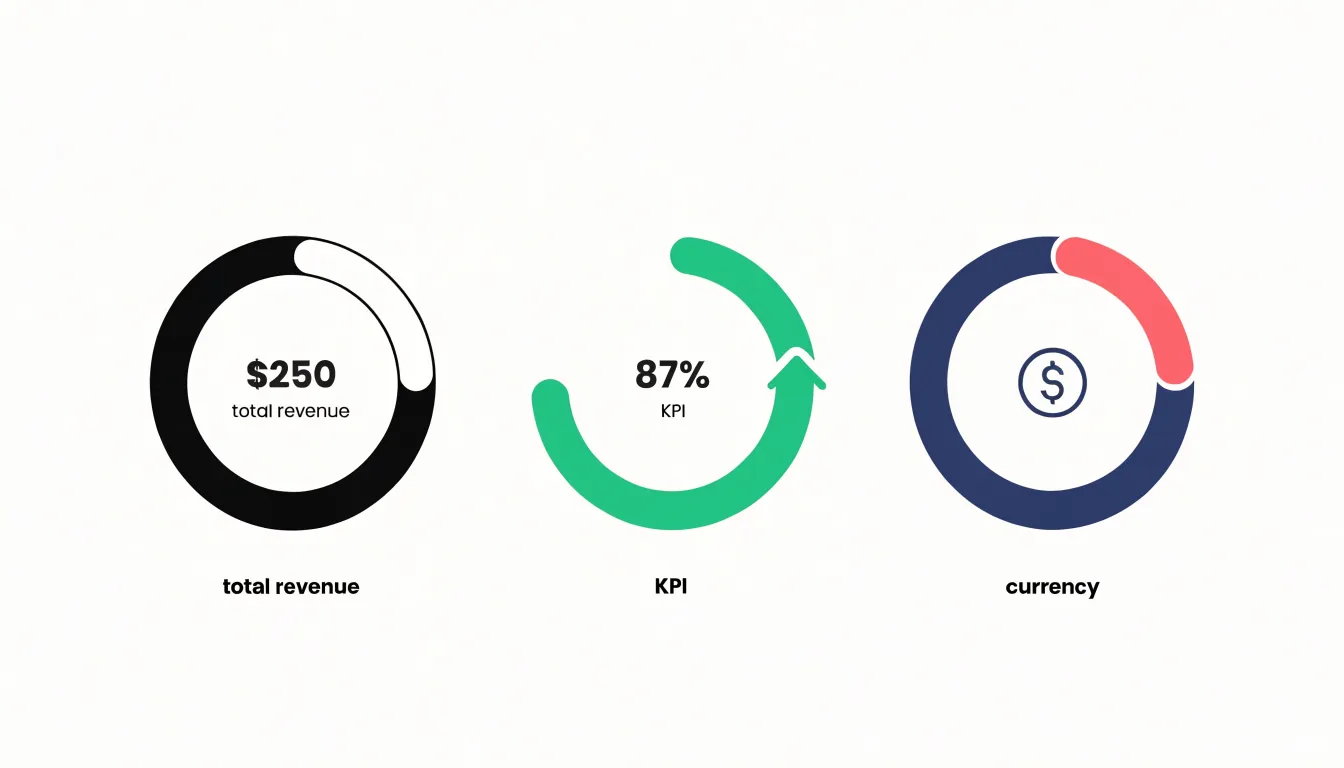
- Total values: Showing the aggregate figure in the middle gives readers an immediate anchor for the numbers in the ring. For example, a sales dashboard might show total revenue in the center while the segments represent regional contributions. Keeping that central number concise and visually distinct from the segment labels helps it read as a summary rather than another data point.
- Key performance indicators (KPIs): A short metric such as a percentage, growth rate, or target completion figure can serve as a focal point when the surrounding segments all relate to that single headline number. Designers should choose a KPI that stays legible at small sizes and avoid long strings of text that compete with the segments.
- Descriptive icons or short labels: A simple symbol, such as a currency sign or category glyph, can orient viewers quickly without requiring extra legend space.
Whatever the choice, the center should remain uncluttered, with enough padding around it to preserve the visual balance of the ring.
Readability
In a pie chart, the viewer evaluates the angle of each wedge at the center and the length of the outer arc. Because these two cues are directly linked, the eye can trace a wedge from its apex to its curved edge in a single sweep.
A donut chart requires the viewer to judge angular extent around the ring and the length of both inner and outer arcs while ignoring the empty middle. Removing the filled wedge reduces the visual mass that anchors the comparison. Research on graphical perception shows that while people estimate angles and arc lengths with reasonable accuracy, they tend to underestimate acute angles and struggle when segments are close in size. In fast-paced dashboards where users scan several charts in quick succession, these small errors compound.
Consequently, pie charts generally offer a slight edge in immediate readability for simple part-to-whole questions because the filled wedge gives a stronger, more cohesive shape to compare. Designers who prioritize speed of interpretation often lean toward the pie format, while accepting that neither style handles near-equal values well.
Use Cases
In business reporting, pie charts work well in executive summaries where space is limited. For example, a quarterly sales report breaking revenue down by four product lines can use a pie chart to immediately convey which product contributes the largest share, especially when differences between slices are substantial.
Donut charts fit scenarios where supplementary context or a lighter visual weight is needed, such as a budget allocation dashboard displaying the total budget in the center, or a series of charts where open centers reduce visual density. In design contexts, donut charts are often chosen for their modern aesthetic in minimalist interfaces, mobile apps, or web dashboards. Ultimately, the decision depends on the data structure, the need for a central metric, and the visual style of the surrounding content.
Mobile Displays
Circular charts present challenges on mobile displays due to limited screen real estate and touch interaction. On small screens, labels on charts with many slices can overlap or become too small to read. Responsive design techniques include reducing the number of displayed slices, aggregating smaller categories into an “Other” group, or switching chart types.
While a donut chart’s central label reduces the need for external labels, the ring thickness must be adjusted so segments remain distinguishable. Layout tweaks such as rotating labels, using leader lines, or placing labels in a legend below the chart can also improve mobile readability.
For touch interaction, segments must be large enough to tap easily, and interactive tooltips should be replaced with tap-friendly alternatives. The chart’s aspect ratio must also adapt to portrait orientation, often requiring a smaller diameter to fit within the viewport without horizontal scrolling. Because complex circular charts with animations or many segments can strain mobile browsers, simplifying visuals and limiting animations is advisable, followed by testing across device sizes and orientations.
Color and Contrast
Because adjacent slices share a border, the eye compares their fills directly; if two neighboring colors sit close together in hue or lightness, the boundary blurs. A reliable approach is to assign colors that differ clearly in both lightness and hue, since lightness contrast survives grayscale printing, small screens, and reduced vision. Ordering slices so that strong and muted tones alternate creates a steady rhythm that helps the eye track each segment.
A practical palette draws from a small set of base hues spaced around the color wheel, varied in saturation or brightness. Limiting the chart to six or seven distinct colors prevents similar shades from repeating. Contrast checkers can confirm that each fill stands out against the background and its neighbors, and testing in grayscale reveals whether lightness differences alone separate the segments.
Restraint matters as much as contrast. Applying saturated colors to every slice produces a busy surface. Many designers reserve the brightest, most saturated tone for an emphasized slice and use softer tints for the remainder, while keeping backgrounds, borders, and labels neutral.
Common Mistakes
- 3D effects: Adding depth distorts slice proportions, making some slices appear larger and others smaller than they truly are depending on perspective.
- Overcomplicating the legend: In donut charts, the central hole reduces space for internal labels, tempting designers to rely on a separate legend. A long legend increases cognitive load by forcing viewers to look back and forth.
- Displaying non-percentage data: Circular charts require parts of a whole summing to 100%. Using absolute values—such as counts or monetary amounts—without converting them to percentages misleads viewers about relative sizes.
- Unsorted slices and cluttered centers: Failing to sort slices by size hinders comparison, and cramming excessive text or icons into a donut’s center distracts from the data.
Accessibility
Roughly one in twelve men and one in two hundred women experience some form of color vision deficiency, causing reds and greens to collapse into similar muted tones and pastel palettes to become indistinguishable. Because pie and donut charts rely heavily on color to separate slices, designers should layer multiple visual cues:
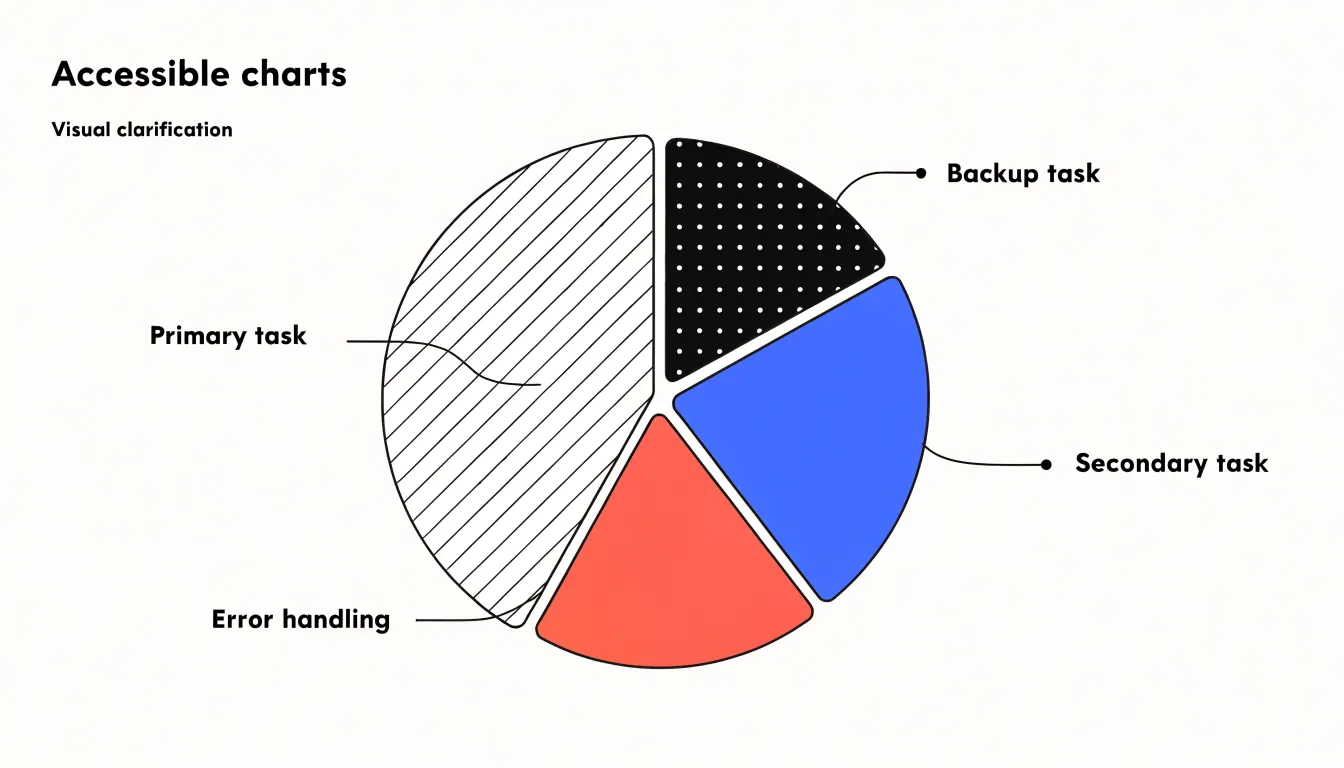
- High-contrast borders: A thin, consistent stroke in a dark or light neutral tone gives every slice a clear edge even when adjacent fills appear similar, in grayscale print, or on dim screens.
- Patterns: Filling segments with textures—such as diagonal lines, dots, or crosshatching—allows category identity to be carried by something other than hue. Patterns should be spaced widely enough to read at small sizes without creating dense visual noise.
- Direct data labels: Placing category names and values inside larger slices and outside smaller ones (with leader lines where space is tight) removes the need to match colors against a legend. Labels must also meet text contrast and size requirements.
Multiple Data Sets
Nested and multi-level circular charts attempt to pack several data series into a single graphic, which tends to overwhelm the reader. A common design is a donut chart with two or three concentric rings, each representing a different year, category, or dataset. Because the outer ring has a longer circumference than the inner rings, equal percentage slices appear as different physical sizes, leading the eye to make invalid comparisons. Adding labels, legends, and color variations multiplies the cognitive load, causing users to misattribute slices across rings.
Side-by-side pie charts present a related problem. Placing three pies in a row forces readers to hold values from one chart in working memory while scanning the next, making small differences and multi-period trends nearly impossible to detect. The arrangement also consumes substantial space by repeating full circles and legends.
Circular charts are built for showing parts of a single whole. When a comparison spans several wholes, a simpler table, a small multiple of bars, or a single line chart tracking each category communicates the trends with far less effort.
Better Alternatives
When a dataset contains eight, ten, or fifteen categories, or when specific comparison criteria apply, switching to a bar graph is the practical choice:
- Comparing individual values: Bar graphs place categories along a common baseline so lengths can be read directly against a shared scale, making ranking straightforward in both standard vertical and stacked versions.
- Preserving small categories: When a circular chart requires grouping slices into an “Other” category to stay readable, underlying detail is lost; a bar graph displays every category without crowding.
- Long category labels: Horizontal bar graphs offer room for readable text that circular charts cannot provide.
- Time series and multiple groups: Stacked bar graphs can show composition within each period while keeping trends visible across periods.
- Precision: When exact values matter, bars support precise reading far better than arcs and angles.
Final Selection Strategy
Use this step-by-step framework to evaluate your dataset:
- Define the primary question: If the goal is to compare individual slices against one another, lean toward a pie chart; if the goal is to spotlight overall magnitude or include a central KPI, consider a donut chart.
- Count the categories: Five or fewer slices fit cleanly in a pie chart. As the count approaches six, a donut chart provides visual breathing room, and beyond that, a bar chart is preferable.
- Examine value distribution: Evenly matched slices benefit from the solid center of a pie chart, whereas heavily skewed data with one dominant segment often sits more comfortably in a donut, where the ring keeps smaller slices legible alongside the large one.
- Consider the display context: Dashboards with multiple metrics benefit from a donut chart’s open center, while static reports and slide decks frequently favor the directness of a pie chart.
- Apply a consistency rule: Match the chart style already used elsewhere in the same report so readers do not have to re-learn the visual language.
- Preview at actual size: Check the chart at its final display scale; if labels crowd or slices blur, adjust the format.
Frequently Asked Questions
Are pie charts easier to read than donut charts?
Pie charts generally offer a slight edge in immediate readability for simple part-to-whole questions because the filled wedge gives a stronger, more cohesive shape to compare. The article notes that designers who prioritize speed of interpretation often lean toward the pie format, while neither style handles near-equal values well.
How many slices should a pie or donut chart have?
Circular charts work best with five or fewer slices, and restricting the chart to five or six categories keeps wedges large enough to register clearly. As the count grows past five or six, the article says to group the smallest categories into one combined segment or switch to a bar chart.
What should I put in the center of a donut chart?
The open center can hold a total value, a KPI, or a descriptive icon or short label. Whatever you choose, keep the center uncluttered with enough padding to preserve the ring’s visual balance.
How do I make pie or donut charts work on mobile?
On mobile, reduce the number of displayed slices, aggregate smaller categories into an “Other” group, or switch chart types. Adjust ring thickness, rotate labels or use leader lines and legends, make segments large enough to tap, and test across device sizes and orientations.
How can I make pie and donut charts accessible for color vision deficiency?
To support viewers with color vision deficiency, add high-contrast borders, fill segments with patterns, and use direct data labels so category identity does not depend on hue alone. Labels must also meet text contrast and size requirements.
What are common mistakes to avoid in pie and donut charts?
Avoid 3D effects because they distort slice proportions, and do not display absolute values without converting them to percentages for a parts-of-a-whole chart. Also avoid unsorted slices, cluttered donut centers, and overly long legends that force viewers to look back and forth.
Tony Astor
Tony writes about data visualization and the tools people use to build charts and dashboards. More about Data Illustrator