Pictogram vs Icon Array: How They Differ
 By Tony Astor ·

Pictogram vs Icon Array
A pictogram uses repeated or resized pictorial symbols to convey general magnitude at a glance, while an icon array is a fixed grid of icons representing individual cases, letting viewers read exact proportions and risks directly. Pictograms favor speed and broad audiences; icon arrays favor precision, accurate risk communication, and part-to-whole comparison.
Table of Contents
Pictogram
A pictogram is a graphic built from simple pictures that communicate rough amounts at a glance. Instead of presenting numbers in a table or a chart with axes, the designer draws a recognizable symbol — a person, a house, a car, a tree — and repeats or resizes it so that the quantity becomes visible before any careful reading takes place. The viewer sees the picture first and the number second, which makes pictograms especially useful when the audience is broad, distracted, or encountering the information in passing.
Two main techniques drive most pictograms:
- Repetition: A row of identical figures, each standing for a fixed unit, lets people estimate counts by eye. Ten little human shapes, where four are shaded, immediately conveys a proportion of roughly forty percent.
- Resizing: A single symbol scaled up or down shows general magnitude, such as a large shopping bag next to a small one to suggest relative spending. Some pictograms combine both approaches, repeating a base symbol while varying its size to emphasize differences among groups.

What makes pictograms effective is their restraint. They represent discrete categories — one symbol per group, one picture per concept — and communicate general magnitude rather than precise values. There are no gridlines, tick marks, or legends competing for attention, and no expectation that the reader will extract an exact figure. The symbol carries the meaning, the quantity registers as an impression, and the visual stays clean enough to work at small sizes, on signage, in slides, and across language barriers.
Icon Array
An icon array is a grid of individual icons that represents a fixed set of cases, such as one hundred or one thousand people, with each icon standing for a single person or event. Because the total number of shapes is set in advance, the viewer can count or estimate the filled shapes and read the exact proportion directly from the display. A grid of 100 figures with 15 highlighted communicates a 15 percent probability with a precision that a pie slice or a filled bar can only approximate. The individual shapes act as units of account, so the relationship between the highlighted icons and the total grid maps one-to-one onto the relationship between the affected group and the whole population.
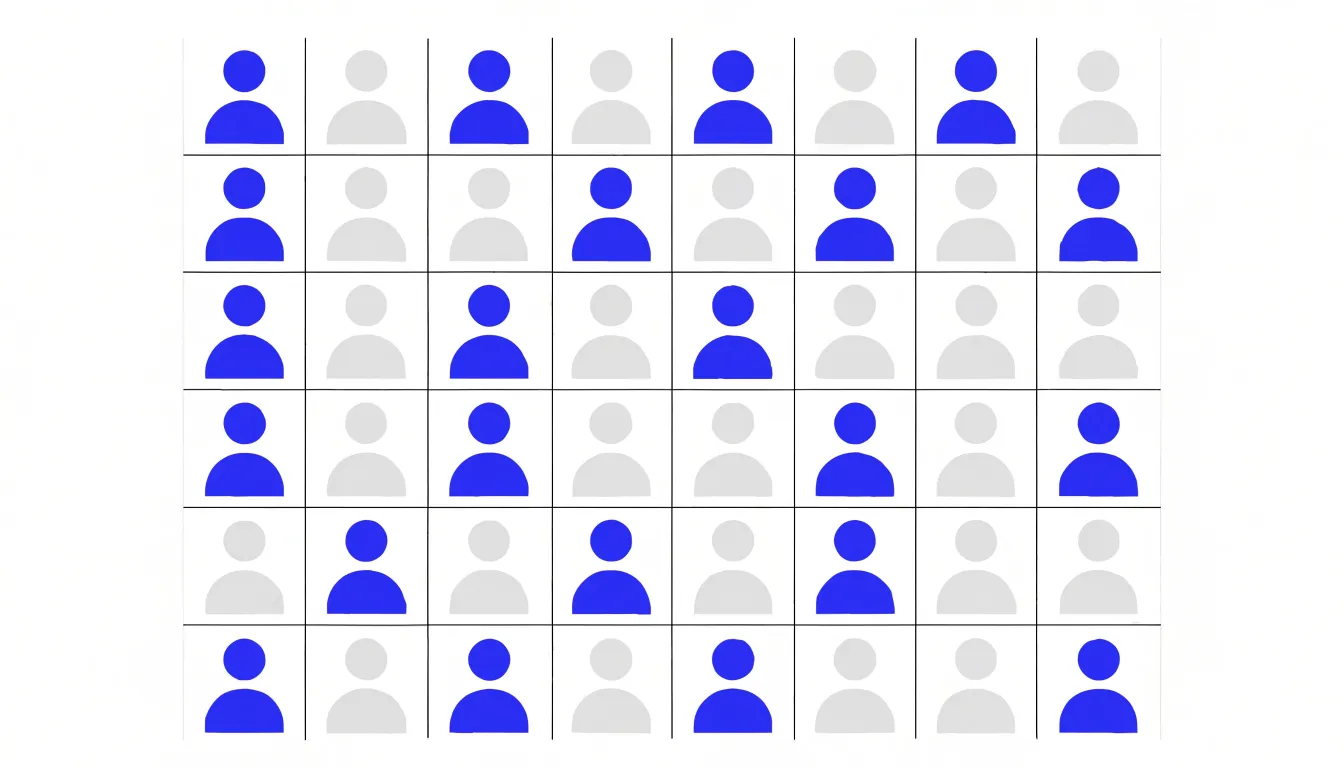
This structure gives icon arrays a particular strength for communicating risk ratios and statistical likelihoods. When two conditions are shown side by side, each as its own grid with the same total number of icons, a viewer can compare 8 highlighted icons against 20 highlighted icons and grasp the relative risk without translating percentages into quantities. The fixed grid keeps the denominators identical across panels, so the eye compares like with like and the ratio between the two highlighted groups stays visually honest.
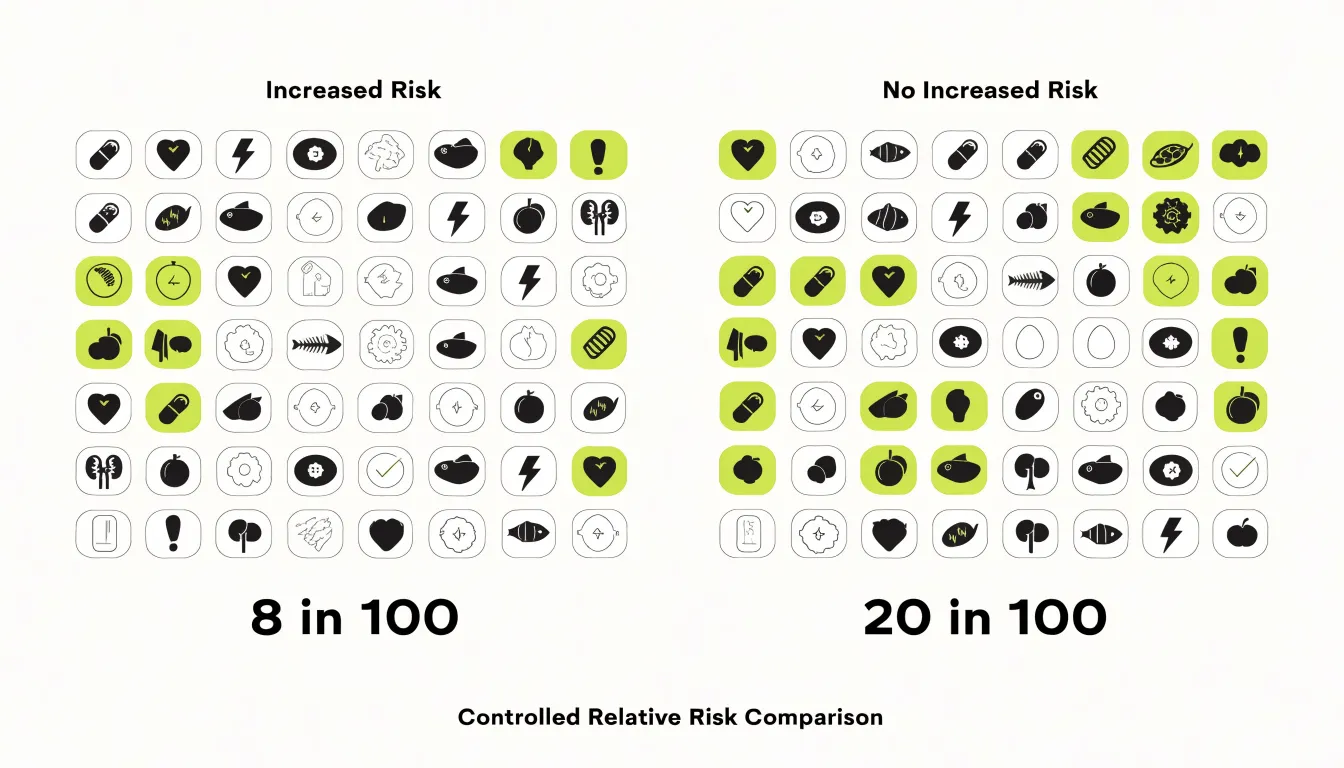
Each icon functions as a discrete token, supporting part-to-whole reasoning. Because the empty icons remain visible, the viewer sees the unaffected majority alongside the affected minority — an important feature when the probability being communicated is small. Rare events that vanish on a chart axis remain countable in a grid of a thousand squares, where a handful of colored shapes still registers as a tangible quantity. Frequency formats such as ten in one hundred align naturally with the array’s counting logic, letting the graphic and the accompanying text reinforce the same mental operation through enumeration rather than estimation.
Core Differences
Pictograms and icon arrays differ across three main dimensions:
- Layout construction: A pictogram typically arranges repeated pictorial symbols in loose groupings, rows, or clusters, using each symbol to stand for a fixed quantity such as one unit, ten units, or one percent. The layout often relies on partial symbols, where a fraction of an image stands for a proportional slice of the represented quantity. This makes the structure flexible, since symbols can be scaled, cut, or grouped to fit the space. An icon array instead builds a strict matrix grid, usually ten by ten, where every cell holds one identical icon and no partial icons appear.
- Unit representation: In a pictogram, readers must decode the relationship between the picture and the number it stands for, including any fractional shading, which demands a small interpretive step. In an icon array, the unit is a single filled square or figure within an ordered lattice, and the full array of one hundred icons is always visible as the denominator.
- Data complexity: Pictograms suit quick-read charts that carry one or two values, often a single comparison or a headline statistic, and can absorb illustrative detail without overwhelming the viewer. Icon arrays handle more mathematical content, supporting counts, percentages, and side-by-side comparisons within a consistent reference frame because the matrix imposes uniform order on every unit shown.
Scale and Ratio
Scale and ratio sit at the heart of how each format communicates quantity. In a resized pictogram, a single icon is stretched or shrunk to carry an arbitrary value. One figure might stand for a million units at a small size and several million at a larger size, with the difference read off the changing dimensions of the symbol. The eye compares the area or height of the drawing, and the mapping between physical size and underlying value is established by the designer rather than by a fixed rule. This flexibility lets a pictogram compress a wide range of magnitudes into a compact graphic, though it places the burden of interpretation on proportional perception.
An icon array works from a different premise. Each icon represents one fixed unit or a consistent multiple of that unit, and the ratio stays constant across the entire display. Ten icons always mean ten units, and every row or block preserves that same one-to-one correspondence. Where a scaled pictogram trades exactness for compactness across large scales by inviting estimation through area, an icon array trades compactness for a strict, unchanging ratio that invites enumeration through tally.
Medical Risk Communication
When a patient reads that a treatment reduces risk by a certain percentage, or that a disease affects a given proportion of the population, the interpretation of those numbers shapes real decisions about consent, adherence, and lifestyle. Icon arrays have emerged as a reliable tool for making these health numbers legible to people without statistical training.
Clinical research has repeatedly documented the advantages of this format:
- Treatment side effects: Patients presented with icon arrays more accurately estimate how many people out of a hundred will experience an adverse reaction, and they demonstrate better comprehension of the distinction between absolute and relative risk.
- Disease prevalence: Arrays reduce the tendency to overestimate rare conditions, because the sparse scattering of highlighted figures communicates smallness more intuitively than a decimal fraction.
- Survival odds: Patients reading icon arrays arrive at estimates closer to the actual figures and report greater confidence in their understanding.
Beyond raw accuracy, icon arrays address the emotional dimension of health information. A number such as a five percent risk can feel either trivial or alarming depending on how it is framed. Seeing five highlighted figures among a hundred provides a concrete reference point that tempers both undue fear and false reassurance, helping patients weigh benefits against harms in a balanced way.
Public Infographics
Public infographics in media outlets and casual reporting channels are a natural home for pictograms. When a news organization wants to communicate a statistic about household spending, vaccination rates, or recycling habits, a pictogram replaces abstract numbers with recognizable objects: a shopping cart for groceries, a syringe for immunization, a bottle for waste. Readers encountering these graphics while scrolling through a feed or skimming a printed page get an immediate visual anchor for consumer-facing topics involving familiar objects and everyday experiences.
Media outlets also benefit from the engaging, shareable character of pictorial visuals. Designers can adapt the choice of icon to match the story’s tone, selecting friendly imagery for lifestyle pieces or more serious symbols for public health reporting. The format balances clarity with visual appeal, reaching audiences who might otherwise overlook a conventional chart or skip past a column of numbers.
Reading Speed
Reading speed is one of the clearest ways the two formats diverge in practice. When a viewer encounters a pictogram, recognition is nearly immediate. Because the pictogram functions as a unified perceptual object, the brain matches the overall silhouette against stored patterns rather than parsing individual elements. Studies of visual processing consistently show that this holistic recognition occurs within a fraction of a second, which is why pictograms work so well in signage, transit maps, and interfaces where decisions must be made quickly.
Icon arrays operate on a slower rhythm. The viewer must first register the individual units, then scan across the array to estimate proportions or totals. This deliberate scanning takes measurably longer than single-symbol recognition, often requiring several hundred milliseconds more as the eye moves across rows and columns. The additional time reflects genuine cognitive work: counting, comparing filled and unfilled icons, and translating the visual distribution into a proportional judgment. For audiences unfamiliar with the format, processing can extend further as they work out what each icon stands for.
Designers weighing the two formats should consider how much time their audience will spend with the graphic and whether the goal is instant recognition or precise comparison of quantities.
Accuracy Concerns
When pictograms are scaled, a common mistake is to adjust only the height of the image while keeping the width proportional. Because area increases with the square of the height, a twofold increase in height results in a fourfold increase in area. Readers, however, often perceive the area as representing the value, leading them to think a doubled value has increased four times. This distortion is particularly problematic in medical or financial contexts where accuracy is paramount.

Icon arrays avoid scaling distortions entirely because the number of icons directly corresponds to the quantity, and each icon remains the same size. Moreover, icon arrays can incorporate color or other markers to denote categories or subgroups without compromising accuracy, ensuring the visual representation aligns with the underlying data.
Denominator Awareness
Denominator awareness refers to the viewer’s ability to grasp the total reference population against which a risk or rate is being reported. Many communication formats present only the numerator — such as the number of people affected by a side effect or the number of successes in a trial — while leaving the base population implicit. When the denominator remains hidden, audiences tend to evaluate the numerator in isolation, a tendency known as denominator neglect. A statement that a treatment carries a risk of four events can sound alarming or reassuring depending on whether those four events occur among one hundred patients or among ten thousand. Without a visible reference population, viewers frequently anchor on the raw count and form impressions that diverge sharply from the underlying probability.
Icon arrays address denominator neglect by keeping the complete reference population on screen as a fixed grid. A viewer does not need to perform mental division or recall an unstated base rate; the proportion can be read directly by comparing shaded and unshaded figures. Research on graphical risk communication has found that this explicit portrayal of the full population supports more accurate probability estimates, particularly among viewers with limited numerical skills. When comparing two arrays that share the same grid dimensions, holding the denominator constant also clarifies whether a difference reflects a true change in risk or simply a change in the size of the population under discussion.
Audience Comprehension
Selecting between a pictogram and an icon array depends heavily on the numeracy of the audience. A simplified narrative image suits audiences with lower numeracy or limited time and attention. By reducing the cognitive workload, pictograms work well for general-public communication, patient information leaflets, or awareness campaigns where the priority is a clear, memorable takeaway.
An icon array rewards a more numerate readership. Audiences accustomed to statistical information — such as clinicians, policy analysts, or engaged stakeholders — can extract more detail from this format and may find simplified pictograms too coarse for their needs. The matrix layout supports careful counting and comparison, which matters when the audience wants to verify a claim rather than simply absorb it.
Practical decisions begin with a demographic profile of the intended readers, considering their educational background, familiarity with health or financial statistics, and whether they will encounter the chart in a quick glance on a poster or during sustained reading in a report. Testing comprehension with a small sample from the target group can confirm whether the chosen format communicates the intended message.
Color Application
Color application in pictograms and icon arrays directs attention and encodes meaning within a compact visual space:
- Accent colors: Reserve saturated hues for a small number of high-priority elements, such as the subgroup representing the outcome of interest. A single saturated hue against a muted background of neutral tones creates an immediate focal point. When several colors compete at equal intensity, the eye loses its anchor and the chart becomes visually noisy.
- Shading: Lighter tints can represent lower likelihoods or secondary categories, while deeper shades signal higher probabilities or primary groups. Consistent shading rules across a series of charts help viewers carry their understanding from one figure to the next.
- Accessibility: Pair color with position or shape cues, and select palettes with sufficient luminance contrast so that distinctions remain visible in grayscale printing and to viewers with color vision deficiencies.
- Backgrounds and borders: A neutral or lightly desaturated field keeps accent colors vivid by comparison, while a busy background dilutes their effect. Borders, outlines, or subtle drop shadows can further separate key icons from surrounding ones without introducing additional hues.
Always test the final composition at a small scale to verify that the intended contrast survives reduction, since many pictograms occupy only a fraction of a screen or page.
Common Mistakes
Even well-intentioned visual displays can undermine their own purpose when common design pitfalls go unchecked:
- Overcrowded icon grids: Packing too many symbols into a small space causes individual shapes to blur together. When each icon represents a single unit rather than a rounded group, dense arrays become visual noise, forcing readers to count rather than perceive.
- Ambiguous symbol choice: A stylized figure may read as a person, a category, or a generic marker depending on context. When an icon’s meaning is not immediately obvious or carries unintended associations, audiences interpret the display through their own assumptions.
- Inconsistent ratio keys: If one section of a graphic uses a key of one icon per ten units while another silently shifts to one icon per five, viewers comparing the two will draw false conclusions. The same risk applies when icon size, partial icons, or cropped symbols are used without clear rules for how they map to quantities.
Because visual displays are processed quickly and holistically, readers rarely pause to verify the key before forming an impression. Preventing confusion requires limiting the number of visible units, testing symbols with real viewers, and applying a single consistent ratio key throughout, supported by clear labeling, generous spacing, and an explicit legend.
Real World Examples
Public health campaigns and investigative journalism show how practitioners deploy each format to match the needs of a story.
During vaccination drives and disease-prevention campaigns, public health agencies use icon arrays to communicate coverage rates and risk levels to audiences with varying numeracy. Conversely, safety and hygiene campaigns rely on pictograms, where simplified figures communicate recommended behaviors such as handwashing or mask use quickly across languages and literacy levels.

In investigative journalism, newsrooms reporting on large datasets — such as casualty counts, budget allocations, or demographic shifts — turn to icon arrays in which each dot stands for a fixed number of incidents, making abstract magnitudes tangible. Pictograms appear regularly in explanatory graphics accompanying long-form investigations, where repeated silhouettes convey who is affected and in what proportions. Across both domains, health communicators tend to favor precise proportional encoding, while journalists often balance accuracy with narrative impact.
Smart Selection
Choosing between formats becomes systematic when you evaluate three factors in order:
- Assess the dataset: Count the variables, note how many categories each variable contains, and identify whether the values represent parts of a whole, a comparison across groups, or a change over time. The shape of the data sets the outer boundary of sensible options.
- Define the communication goal: Write the intended takeaway in one sentence before choosing a format. A single share of a total requires an immediate proportion; a comparison between several values requires side-by-side judgment; a trend requires a clear path for the eye to follow.
- Account for the presentation medium: A dense written report rewards close reading and carries more detail. A live presentation slide demands instant legibility from the back of the room, while a mobile screen compresses everything into a narrow column, constraining label size, color range, and element count.
Document the reasoning as you go so that future revisions can revisit the trade-offs.
Overview
This summary reference outlines the ideal use cases, trade-offs, and core design rules for pictograms and icon arrays:
- Pictograms: Best for communicating a single statistic or simple proportion in public-facing materials, infographics, and presentations. They trade precision for emotional resonance and appeal, obscuring fine distinctions and detailed distributions. Design rules: Use universally recognizable icons that accurately represent the concept, and scale by area rather than height alone when resizing a single symbol.
- Icon arrays: Best for conveying exact part-to-whole relationships, risks, and side-by-side group comparisons in scientific communication and medical decision aids. They trade compactness for transparency and accuracy, requiring more space and risking visual overload if the total count is too large. Design rules: Keep the total number of icons within a perceptible range (often 100 or fewer), maintain consistent icon design and spacing, group icons meaningfully, and provide clear labels and legends.
Frequently Asked Questions
What is the difference between a pictogram and an icon array?
A pictogram uses repeated or resized simple pictures to communicate rough amounts at a glance, while an icon array uses a fixed grid of individual icons to represent a set number of cases, such as 100 people. Icon arrays allow viewers to count or estimate filled icons and read an exact proportion directly.
When is a pictogram better than an icon array?
A pictogram is best for communicating a single statistic or simple proportion in public-facing materials, infographics, and presentations. It suits audiences with lower numeracy or limited time and attention, trading precision for emotional resonance and appeal.
How do icon arrays help communicate medical risks?
Icon arrays keep the complete reference population visible as a fixed grid, which helps address denominator neglect and supports more accurate probability estimates. The article notes that patients using icon arrays more accurately estimate treatment side effects and better understand the distinction between absolute and relative risk.
Why are icon arrays more accurate than resized pictograms?
Icon arrays avoid scaling distortions because the number of icons directly corresponds to the quantity and each icon remains the same size. When pictograms are scaled, adjusting only the height while keeping width proportional can make a twofold increase in height appear as a fourfold increase in area.
How does reading speed compare for pictograms and icon arrays?
Pictogram recognition is nearly immediate and can occur within a fraction of a second because the brain matches the overall silhouette against stored patterns. Icon arrays take longer because viewers must register individual units and scan across rows and columns, often requiring several hundred milliseconds more.
What common mistakes should be avoided with icon arrays and pictograms?
Common mistakes include overcrowded icon grids, ambiguous symbol choices, and inconsistent ratio keys. Preventing confusion requires limiting the number of visible units, testing symbols with real viewers, and using a single consistent ratio key with clear labeling, spacing, and an explicit legend.
Tony Astor
Tony writes about data visualization and the tools people use to build charts and dashboards. More about Data Illustrator