Pictogram Chart: How to Show Data With Icons
 By Tony Astor ·

Pictogram Chart
A pictogram chart uses repeated icons, each representing a fixed quantity, to display data like a bar chart. Partial icons show fractional values. The symbol must be proportional, consistent in size, and clearly linked to the data. State the unit in a legend, keep one scale throughout, and use color or labels for clarity.
Table of Contents
Pictogram Chart
A pictogram chart replaces the conventional rectangular bar with a series of repeated icons, where each symbol stands for a fixed quantity and partial symbols represent fractional values. Because length or count still maps directly to the underlying numbers, the chart preserves the ordered, comparative structure of a bar chart. What changes is the surface of the mark. A row of shopping carts, trees, or coffee cups conveys the subject before the viewer reads a label, shortening the distance between seeing the graphic and understanding what it describes.
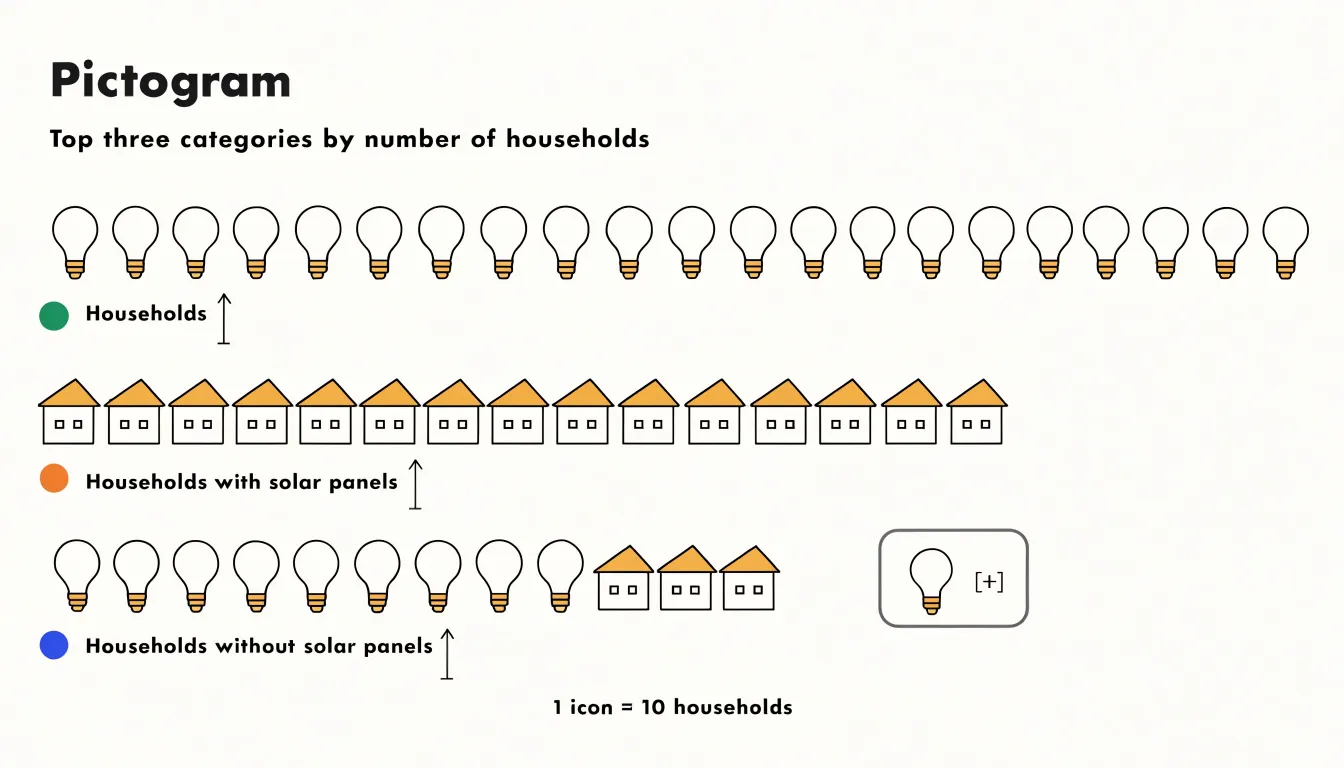
This thematic fit drives engagement. Readers encountering a chart about household energy use respond differently to rows of lightbulb icons than to gray rectangles; the symbols anchor the eye and connect the data to lived experience. Repeating a single recognizable shape also creates a rhythm that invites scanning across categories, while partial icons at the end of a row communicate fractions intuitively.
Visual hierarchy survives this substitution because the underlying grammar of the chart is untouched. Categories remain sorted along a shared axis, magnitudes stay comparable, and the eye can rank entries at a glance. Designers can reinforce that hierarchy through icon size, spacing, and color, letting the most important category lead without abandoning the familiar reading pattern. The one discipline required is proportion: every icon must occupy consistent space and represent the same value, or the symbolic appeal will distort the comparison.
Icon Selection
Icons should have a direct, unambiguous connection to the data they represent—a car for transportation, or a heart or medical cross for health.
Cultural and contextual factors also matter, as some symbols carry different meanings across cultures. A thumbs-up gesture, for instance, is positive in many places but offensive in others. To avoid misinterpretation, rely on universally recognized icons such as those for male and female, home, or search. Standard icon libraries like Material Icons or Font Awesome offer sets tested for clarity. When in doubt, choose simple, literal representations over abstract ones.
Icons must remain distinguishable at small sizes. Avoid intricate details that get lost when scaled down; solid shapes with clear outlines work best. Keep style consistent across the chart, as mixing outlined and filled icons creates visual noise.
Test candidate icons with a sample audience by asking people to identify what each symbol represents without seeing the labels. If they hesitate or disagree, revise the icon.
Unit Counting
Setting values for each symbol is the foundational decision in any pictogram chart, because every choice about layout and scale flows from it. A practical starting method is to divide the total value by the number of icons you can comfortably display. For a dataset of 640 survey responses, assigning 10 responses to each symbol produces 64 icons. Rounding this unit to a clean number keeps the chart legible and lets readers perform quick mental arithmetic.
Readability constrains unit size. The per-symbol value should remain small enough that differences between categories stay visible, yet large enough that no category degenerates into a cloud of tiny shapes. When one category demands 90 icons while another needs only three, the chart collapses into visual noise on one side and awkward emptiness on the other. Adjusting the unit upward, grouping symbols into blocks of five or ten, or splitting the chart into panels restores balance.
Maintain a single scale across the entire chart. Mixing units between categories or silently changing the scale midway undermines trust. State the chosen unit plainly in a legend or caption so readers know what one icon represents before interpreting the pattern.
Partial Icons
Partial icons represent non-integer values while preserving the visual scale. Two common techniques are cropping and shading:
- Cropping: The icon is clipped vertically or horizontally to reveal only the proportion corresponding to the data value. If each icon represents 10 units and the value is 25, display two full icons and one cropped to 50% height. Crop along a consistent axis (usually bottom-up for vertical bars) so the fractional part aligns with the full icons.
- Shading: The icon is drawn in full, but a portion is filled with a solid color or pattern to indicate the fraction.
The shaded or cropped area must be visually proportional to the value. For instance, shading 25% of an icon’s area should correspond to 25% of the unit value, which may require adjusting for complex icon shapes. Never enlarge or shrink the fractional icon relative to full icons.
To reduce confusion, apply the same cropping or shading method uniformly across the chart. Use a clear visual cue, such as a dashed line or a contrasting color for the partial segment, and consider adding a label or tooltip for exact values.
Color Use
Because each pictogram icon occupies limited space, the shade applied to it carries substantial weight. Assigning a saturated, high-contrast hue to a target value, an outlier, or an urgent metric—while surrounding icons recede into muted grays or pale tints—creates a clear visual hierarchy. Human vision responds rapidly to differences in hue and luminance, so a single vivid mark among subdued marks reads as significant before any label is processed.
Stepping through a graded sequence of shades encodes magnitude or progress. Lighter tones might represent early stages or lower values, with progressively deeper shades marking growth toward a goal. Once a color is assigned a meaning, such as red for below-target performance or green for achieved goals, keep that association consistent across every chart in a series.
Data Accuracy
Data accuracy hinges on proportional representation. A common error is using area or volume to represent linear quantities: doubling the height and width of an icon quadruples its area, exaggerating the difference. When scaling single icons instead of repeating them, scale by the square root of the value for area, or by the cube root for volume, so perceived magnitude matches the underlying number.
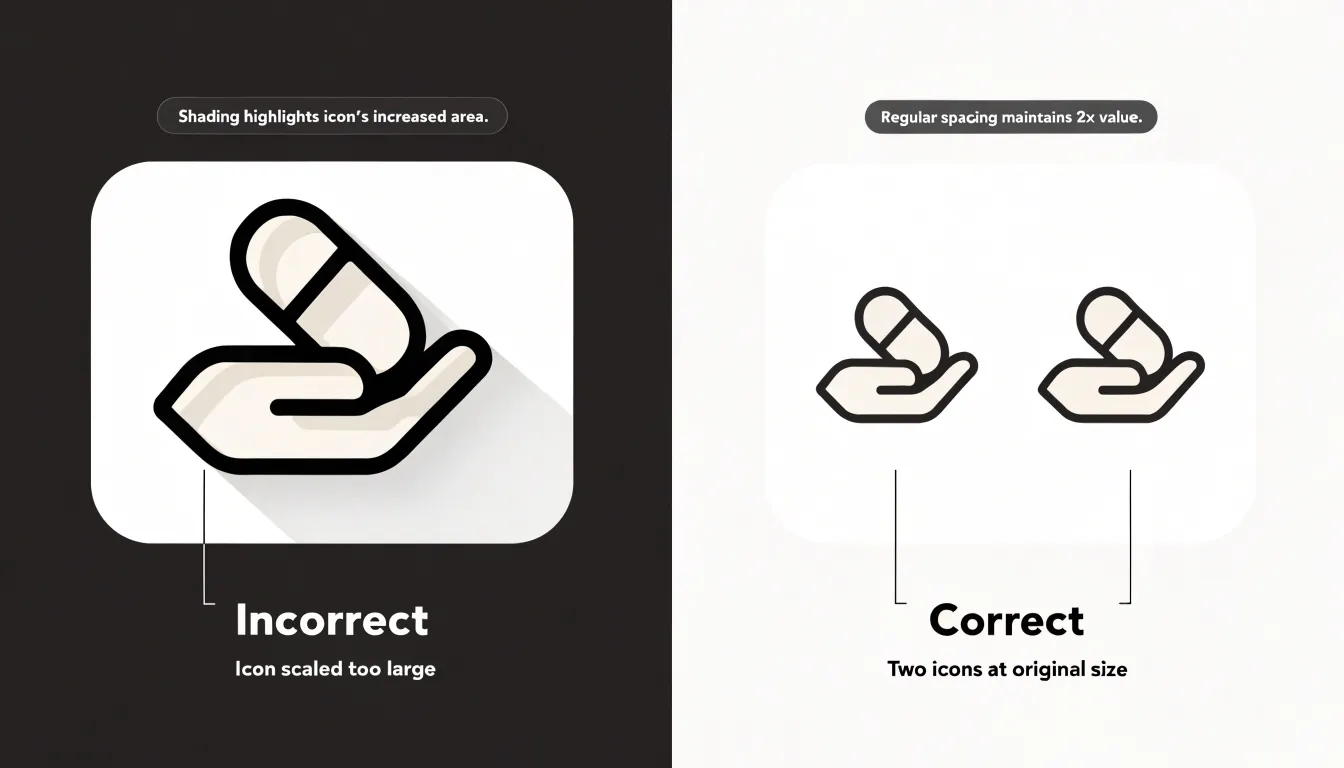
To maintain visual integrity:
- Anchor baselines at zero and avoid truncated axes that amplify small differences.
- For stacked or grouped pictograms, verify that each segment’s area corresponds to its share of the total.
- Use fractional icons rather than rounding up or down, which introduces bias.
- Use gridlines or reference shapes to help viewers gauge proportions, and audit the chart by comparing representative icon area ratios against the raw data.
Layout
Layout arranges symbols so viewers can compare rows, columns, or categories without conscious effort. Every symbol in a row should anchor to the same horizontal baseline, and every column should share a common vertical axis, allowing counts to be read by scanning row length.
Whether the chart uses a fixed matrix of repeated icons or variable-length rows, the underlying grid should be uniform, with each cell holding one unit of meaning. This one-symbol-per-cell discipline lets a viewer perceive quantity as physical length or area.
Spacing provides visual grammar. Keep the gap between symbols within a group small and constant to signal that they belong to the same series, and make the gap between separate groups visibly larger to signal a change of category. Include sufficient padding around the chart frame so edges do not compress the grid, and align labels, axes, and symbols along shared reference lines.
Common Pitfalls
Crowded layouts occur when too many icons are packed into a limited space, causing rows to overlap or shrink below legibility. To fix overcrowding, cap the number of icons per row, adjust icon size to the available canvas, consolidate categories, or move detailed breakdowns into a supplementary table.
Misleading scales are equally damaging. Over-scaling icons by height and width simultaneously makes a twofold increase look fourfold, and starting a baseline at a non-zero value distorts visual ratios between categories. Previewing the chart at small sizes and testing it with real users helps catch these spacing and scaling issues early.
Audience Fit
A symbol that reads instantly to a domain expert can leave a general audience guessing. Tailoring icon complexity and metaphors to viewer expertise is a core design decision:
- Expert audiences: Leaner symbols work well. A single abstract glyph, schematic outline, or standard industry mark conveys precise meaning because the viewer supplies the context. Specialists scan quickly and appreciate density and shorthand, so detailed metaphors add noise. An analogy drawn from a specialist world, such as a valve or a circuit trace, lands well with engineers.
- General audiences: Use concrete, literal imagery. Everyday objects, familiar silhouettes, and metaphors rooted in common experience—such as a light switch or a door—reduce interpretive work. Use only as much detail as the viewer needs to identify the concept.
A pictogram that depends entirely on its label has not done its job. When a single chart must serve mixed audiences, layer the information by pairing a simple primary symbol with a short caption or legend.
Comparison Charts
Placing two or more sets of pictograms side by side lets the eye move across columns and register differences instantly. A taller stack of icons next to a shorter one conveys expansion or contraction at a glance, and repeating the same icon type across periods anchors the comparison.
Demographic shifts fit this structure well. Placing age brackets or population groups in parallel columns lets viewers track how group composition changes over time, using different colors or shapes to distinguish cohorts. Viewers can scan down a column for totals and across rows for contrasts to spot which segment is growing or shrinking fastest. Regional sales, survey responses, and program participation follow the same logic, provided categories are ordered for direct comparison.
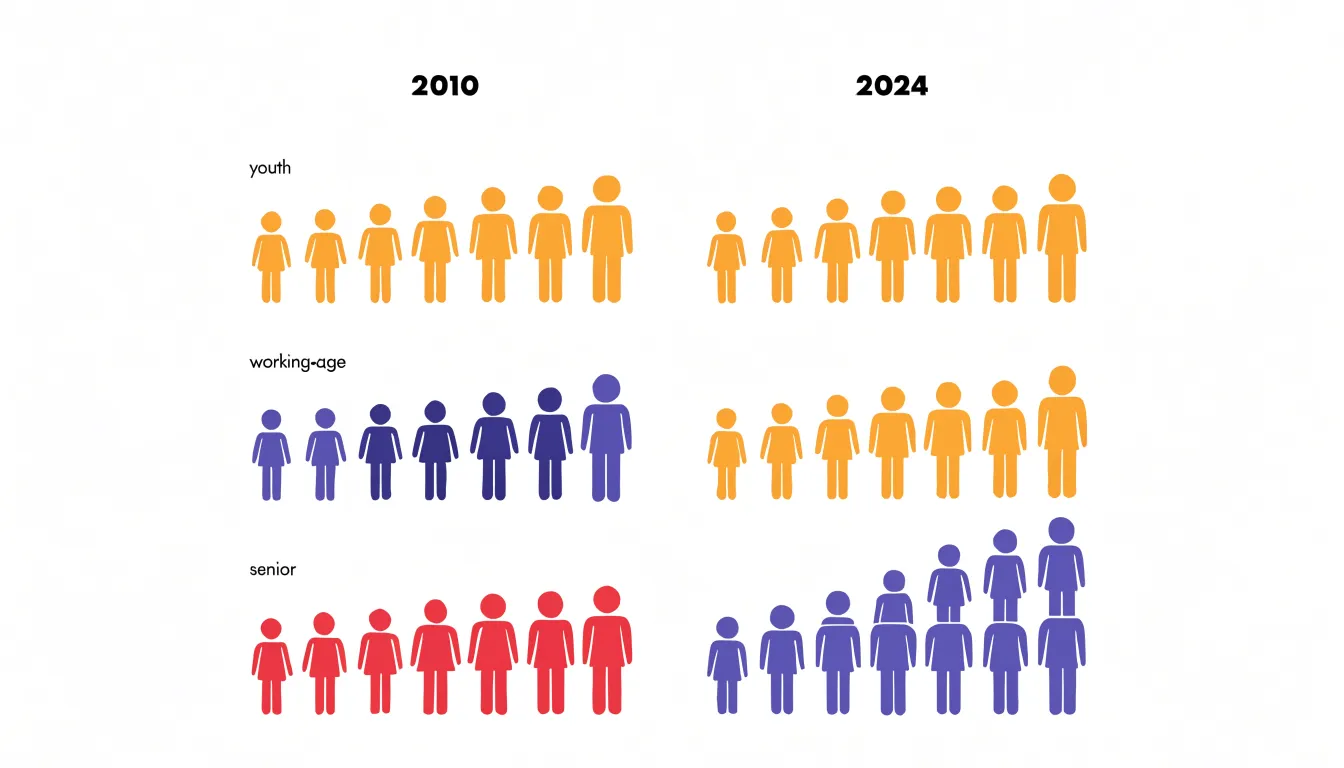
Give each column a heading that names the set and time period, and keep spacing between columns wide enough to separate the sets while allowing the eye to travel easily between them.
Mobile Formatting
On a small screen, an icon grid that looks balanced on a desktop monitor can collapse into crowded rows where symbols blur together. A responsive design strategy begins with setting a minimum icon size that keeps each pictogram legible at arm’s length. Individual icons should rarely fall below 20 to 24 pixels; below that threshold, fine details inside a glyph disappear and shapes read as noise rather than distinct units.
Color Accessibility
Roughly one in twelve men and one in two hundred women have some form of color vision deficiency. A palette that looks distinct to a designer may collapse into near-identical tones for these viewers. Designing for accessibility means building redundancy into every visual encoding so information survives the loss of hue discrimination.
High-contrast palettes form the first layer of defense. Choosing colors that differ sharply in lightness as well as hue keeps categories separable across most forms of color blindness. Designers can verify distinguishability using simulators for deuteranopia, protanopia, and tritanopia, and start from tested palettes like the Okabe-Ito scheme. WCAG guidelines call for a contrast ratio of at least 3:1 between graphical objects and their backgrounds so shapes remain visible under low-vision conditions, on projectors, in print, and on mobile screens.
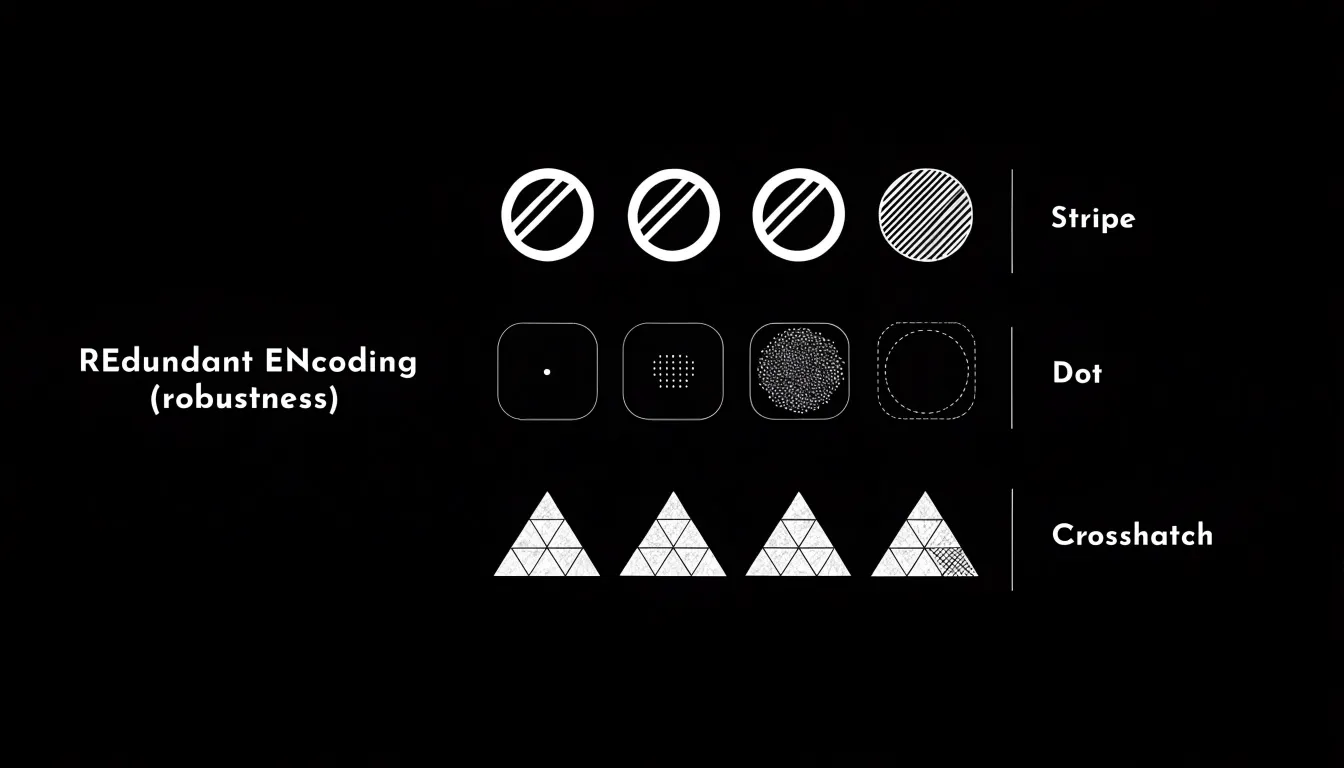
Patterns and shape cues add an independent channel of meaning. Filling pictogram units with stripes, dots, crosshatching, or solid tones—or assigning distinct shapes like circles, squares, and triangles to different series—lets viewers separate categories without relying on hue. Direct annotations and legends that pair each pattern or shape with its category name ensure the chart communicates through texture, form, and text simultaneously.
Labels
While icons draw the eye first, labels state what the symbols mean and how much each represents. A concise, descriptive title anchors the chart’s purpose without using full sentences that compete with the graphics. Place the unit key in a fixed corner using consistent typography and color logic.
Numerical callouts attached to individual icons or rows add precision where visual estimation falls short. Align callouts along a consistent edge or baseline close to the symbols they describe, and use uniform units, decimal places, and label widths so text does not look ragged against the icon grid.
Clutter comes from adding too much text: repeating the unit on every icon, crowding callouts into narrow spaces, or layering long annotations over artwork. Remove each label in turn and ask whether the chart still communicates clearly; cut anything that can go without loss of meaning. Keep remaining labels visually subordinate through lighter font weights, muted colors, and generous white space.
Business Reports
In executive summary slides, where attention is limited, a pictogram can communicate a headline metric immediately. Instead of presenting a revenue target as a spreadsheet percentage, a row of human or product icons can show progress using filled icons for completed units and outlined icons for the remaining gap.
Within dashboards, pictograms anchor key performance indicators in recognizable imagery. A supply chain dashboard might use truck or warehouse icons for goods in transit, while a customer service summary could use headsets to compare open and resolved cases. These cues help viewers move between metrics without losing their place.
In recurring business reviews and quarterly presentations, numbers alone tend to blur together across meetings. A pictogram showing that three out of ten regional teams met their sales goals is easier for stakeholders to recall and discuss than a table ratio, driving stronger engagement during financial and operational reviews.
Best Practices
Consistency across a multi-chart presentation requires a shared visual vocabulary:
- Unified icon family: Select one icon family with a common drawing style, level of detail, and orientation for the entire presentation. Reusing the same symbols across slides and dashboard tiles builds audience familiarity and reduces cognitive effort.
- Uniform stroke weight: When icon outlines vary in thickness from chart to chart, viewers may interpret the accidental variation as meaningful. Apply a standard stroke weight to all pictograms, grid lines, axis rules, and annotation strokes for coherent line quality.
- Defined spacing rules: Set standard increments for gaps between repeated icons, margins around chart areas, and distances between labels and symbols, then apply them everywhere to maintain an even visual rhythm.
Documenting the icon family, stroke weights, and spacing increments in a simple style guide keeps anyone building or updating charts aligned with the system.
Frequently Asked Questions
What is a pictogram chart?
A pictogram chart uses repeated icons instead of rectangular bars, with each symbol representing a fixed quantity and partial symbols showing fractional values. It preserves the comparative structure of a bar chart while using thematic symbols to make the subject easier to recognize.
How do I choose icons for a pictogram chart?
Choose icons with a direct, unambiguous connection to the data, and prefer simple, literal representations over abstract ones. Keep icons distinguishable at small sizes and test them with a sample audience by asking people to identify what each symbol represents without labels.
How do I decide what each icon represents?
A practical starting method is to divide the total value by the number of icons you can comfortably display, then round the unit to a clean number. Keep a single scale across the entire chart and state the chosen unit plainly in a legend or caption.
How should partial icons be displayed in a pictogram chart?
Partial icons can use cropping, where the icon is clipped to reveal only the proportion corresponding to the data value, or shading, where a portion of the full icon is filled with color or pattern. The partial area must be visually proportional, and the same method should be applied uniformly across the chart.
How can I make a pictogram chart accessible for color vision deficiency?
Use high-contrast palettes that differ sharply in lightness as well as hue, and verify distinguishability with simulators for deuteranopia, protanopia, and tritanopia. Add patterns and shape cues so categories can be separated without relying on hue alone.
What makes a pictogram chart misleading?
Using area or volume to represent linear quantities can exaggerate differences, such as doubling height and width to make a value look four times larger. Maintain proportional representation, anchor baselines at zero, and use fractional icons rather than rounding up or down.
Tony Astor
Tony writes about data visualization and the tools people use to build charts and dashboards. More about Data Illustrator