OHLC Chart: Open, High, Low and Close Explained
 By Tony Astor ·

OHLC Chart
An OHLC chart plots four prices per trading period—open, high, low, and close—as a single vertical bar, with the range shown by the bar’s height and the open and close marked by short horizontal ticks. Traders use it to read volatility, momentum, reversals, and support and resistance across any timeframe.
Table of Contents
Bar Charts
A bar chart translates each trading session into a single vertical line, giving traders a compact visual summary of price movement over a chosen period. The vertical line spans the full range of the session: the top marks the highest price reached, and the bottom marks the lowest. This range is often the first thing traders read because it shows how far price traveled and how much volatility the session carried. A long bar signals a wide range and active trading, while a short bar suggests a quiet session with limited movement.
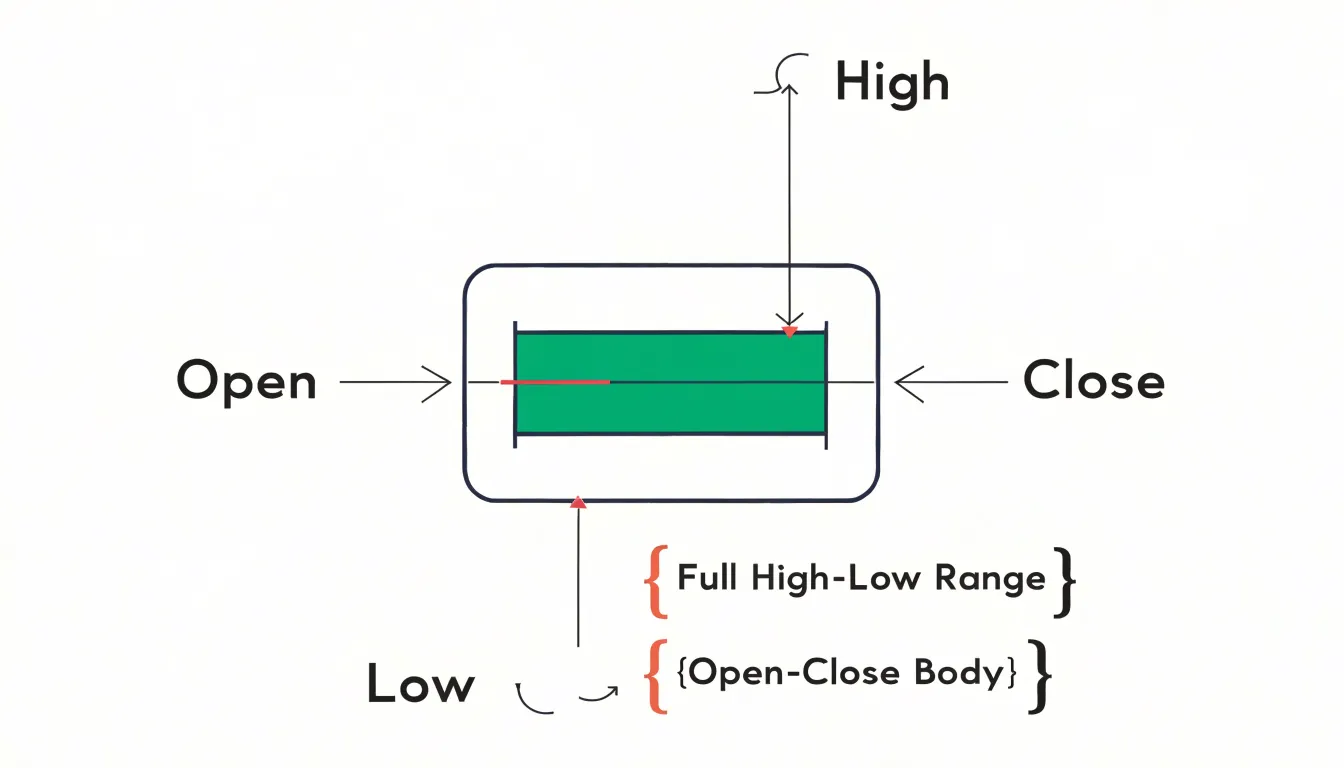
Two short horizontal ticks extend from the vertical line to mark the opening and closing prices. On a standard bar, the left tick represents the open and the right tick represents the close—though some data providers reverse this orientation, so it pays to check the convention in use. The relationship between these two ticks reveals the session’s directional bias: when the close sits above the open, buyers held the upper hand; when the close sits below the open, sellers dominated.
Traders also read the position of the ticks within the overall range. A close near the top of the bar shows buyers pushed price to the highs by the end of the session, while a close near the bottom shows sellers finished in control. The distance from the open to the high, and from the low to the close, adds further context about the intraday struggle. Condensing four data points into one shape lets traders scan ranges, momentum, and shifts in control across many sessions at a glance.
Candlestick vs OHLC
Traditional OHLC bar charts and Japanese candlesticks encode the same four data points for each period, yet they arrange those values in visually distinct ways. While a bar chart uses a single vertical line with open and close ticks to create a compact, linear glyph, a candlestick converts those figures into a body and wicks (or shadows). The body occupies the space between the open and close, while thin lines extend above and below to the high and low. Filled or colored bodies indicate direction, giving each period a sense of mass and momentum that a bar chart leaves implicit.
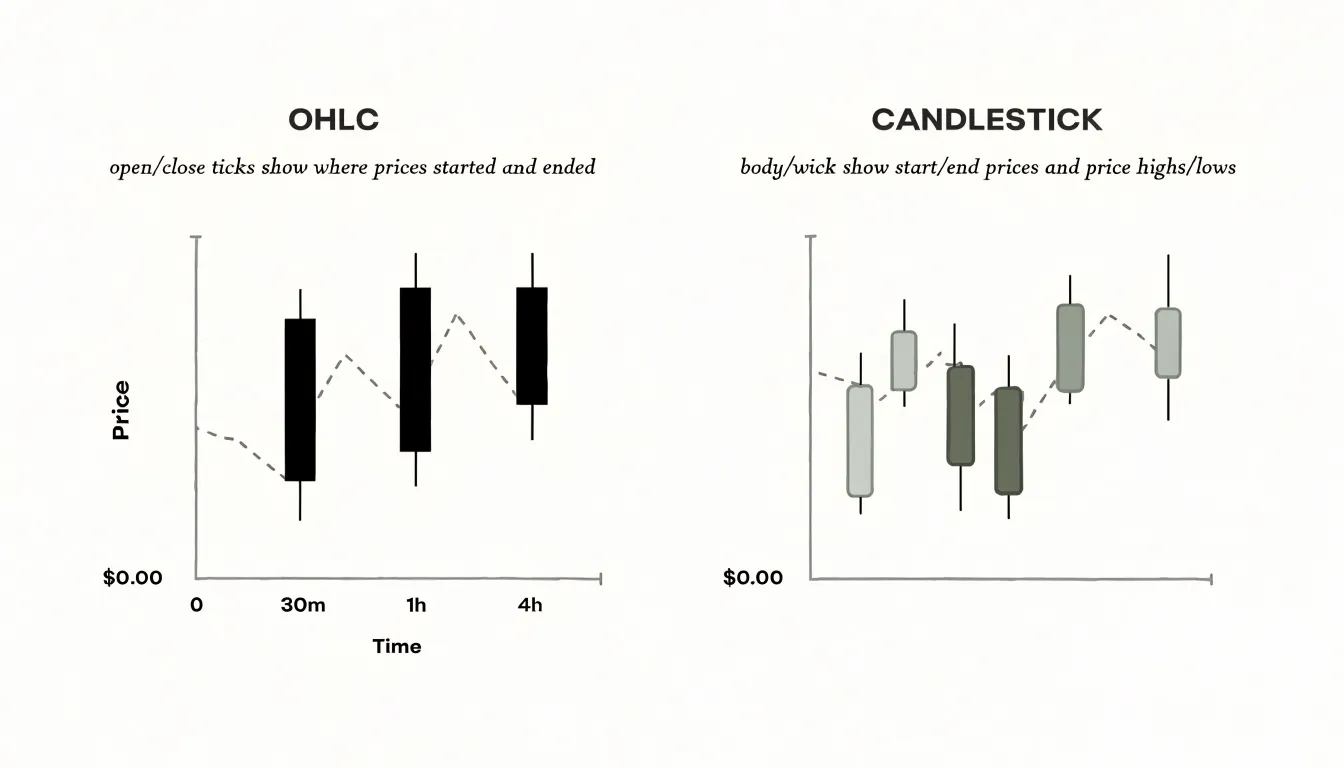
This structural difference shapes how a trader reads a chart. Bar charts produce a cleaner, more neutral field of lines, which helps when a screen holds many periods or when the focus is on support and resistance levels drawn from high and low extremes. The open and close ticks remain visible without filled shapes competing for attention. Candlesticks, by contrast, make the relationship between open and close the dominant feature. A large body signals strong conviction during the period, while a small body with long wicks suggests indecision. Patterns such as doji, engulfing formations, and hammer shapes arise naturally from this layout and are harder to spot on bars.
Many traders choose candlesticks for short-term analysis, where sentiment and reversals matter, and switch to bars for broader overviews or when overlaying dense indicator sets. The choice often comes down to personal visual habits and the timeframe being studied.
Color Codes
On most modern charting platforms, color instantly communicates whether a trading period was bullish or bearish. A bullish period (close higher than open) is typically colored green or white, while a bearish period (close lower than open) is colored red or black. This convention allows traders to scan a sequence of bars or candles and quickly gauge market sentiment, trends, reversals, and consolidation without examining individual price values.
While default schemes are standardized across tools like TradingView, MetaTrader, and Bloomberg, most platforms allow color customization to suit personal preferences or accommodate color vision deficiencies. Some platforms also use shades or patterns to indicate additional information, such as the strength of a move or whether the close sits above or below the previous period’s close. This visual shorthand is especially valuable in fast-moving markets, where rapid pattern recognition informs timely decisions.
The Four Price Points
Each of the four OHLC data points captures a distinct moment in the struggle between buyers and sellers during a trading session:
- Open: Records the first agreed-upon price when the session begins, reflecting the overnight accumulation of orders, news, and sentiment carried over from the previous close. A gap between yesterday’s close and today’s open often signals a shift in conviction before any intraday trading occurs.
- High: Marks the peak price reached during the session, showing where buying pressure was strongest and where sellers began to overwhelm demand. The distance between the open and the high reveals how far buyers managed to push the market before meeting resistance.
- Low: Captures the opposite extreme—the trough where selling pressure climaxed and buyers stepped in to absorb supply. Together, the high and low define the session’s full trading range, measuring the intensity of the battle between bulls and bears.
- Close: Arguably the most scrutinized of the four, the close represents the final price at which the market settled and the consensus valuation participants agreed upon before the session ended. Comparing the close to the open produces the session’s net change, while the relationships among all four points reveal whether the session trended decisively, reversed sharply, or traded in a narrow band.
Timeframes
Selecting a timeframe is one of the first decisions a trader makes when reading an OHLC chart, as the length of the period determines how much price action is compressed into one visual unit:
- Short timeframes (e.g., one-minute or five-minute charts) print dozens of bars within an hour, exposing micro-movements, precise entry and exit points, tight stop placements, and the rhythm of intraday liquidity. This granular view suits scalpers and day traders.
- Medium timeframes (e.g., daily charts) condense an entire session into a single bar, filtering out the noise of individual ticks to highlight broader directional flow.
- Longer timeframes (e.g., weekly or monthly charts) fold weeks of trading into one compact shape. They smooth out erratic swings and make support and resistance zones, trendlines, and moving averages more reliable, which benefits swing traders and position holders tracking macro trends.
A pattern that looks significant on a five-minute chart may be trivial on a daily chart, and a breakout visible on a weekly chart may unfold over months rather than hours. Many traders combine multiple timeframes, using a higher one to establish context and direction while a lower one refines execution. Matching the timeframe to the intended trade duration prevents the mismatch that arises when decisions made on short-term signals are held against long-term expectations.
Volatility
Reading the vertical lengths of OHLC bars in sequence gives traders an ongoing picture of volatility conditions, which tend to move in cycles of quiet compression and energetic expansion.
Expansion appears when successive bars grow longer than those that came before. This lengthening often accompanies a burst of directional conviction, a reaction to news, or the release of pent-up energy after a quiet stretch. Contraction works in the opposite direction: bars shrink as price coils into a tighter range, reflecting indecision or a temporary balance between opposing forces.
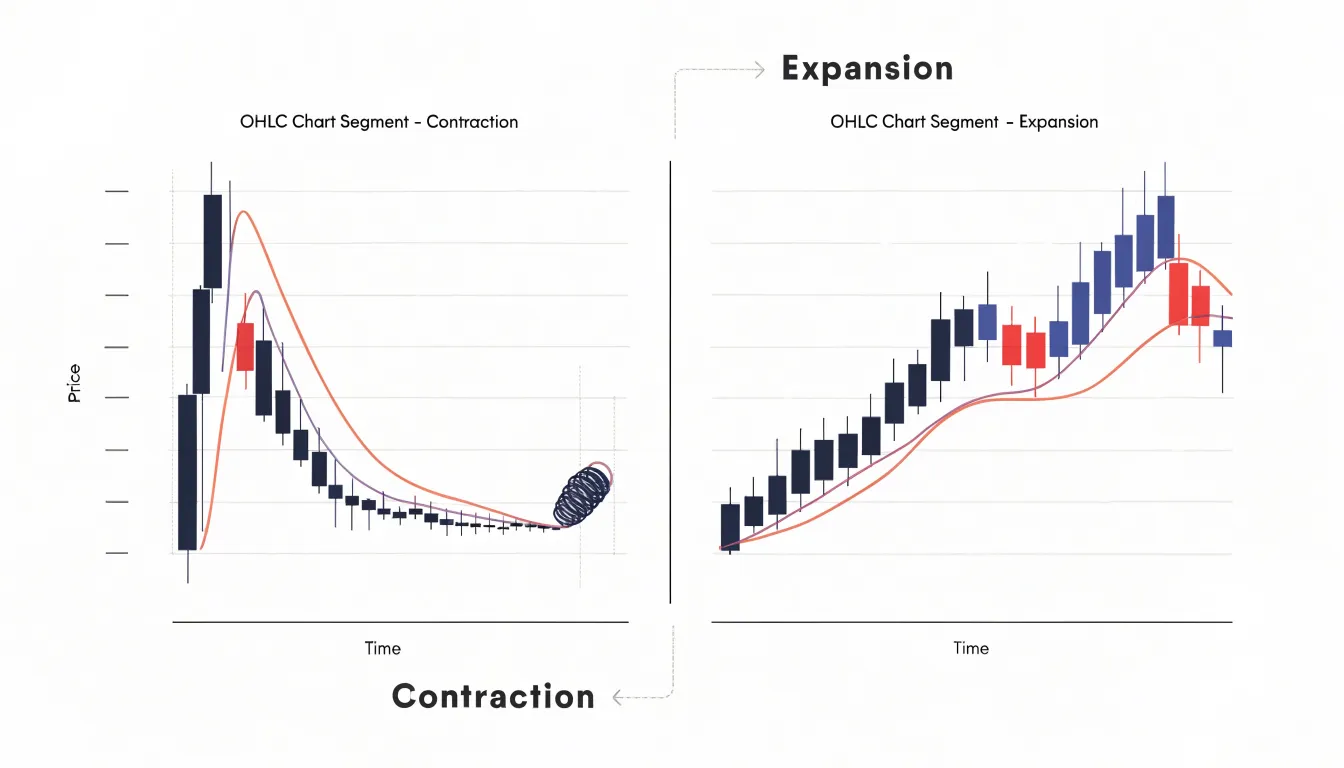
Comparing the bar’s total length to its body (the open-to-close range) adds nuance. A long bar with a small body indicates a wide range that ended close to where it began, hinting at rejection or churn, whereas a long bar with a large body shows sustained directional movement. Comparing the current bar’s length against an average of recent bars helps contextualize whether present conditions are unusually quiet or active.
Bar length also directly informs risk management. Wider bars imply larger potential swings and warrant wider stops or reduced position sizes, while compressed bars suggest tighter ranges and different trade structures.
Price Reversals
Reversal signals emerge when the relationship between a bar’s extremes and its closing price changes character after an extended move.
A bar that pushes to a new low but closes near its high tells a story of seller exhaustion: selling drove price down, yet buyers absorbed the pressure and forced the close back into the upper portion of the range. This long lower shadow (or tail) suggests a downtrend may be losing fuel. The mirror image appears at market tops, where a bar spikes to a new high, then closes near its low as buyers fade and sellers step in, hinting that upward momentum is tiring.
Bars with small bodies and disproportionate shadows near market extremes often precede turning points. However, location gains meaning through context: a close near the high carries more bullish weight at the end of a sustained decline than in the middle of a trading range. Because a single bar rarely marks a durable turn on its own, traders treat close location as an early warning and look for confirmation from volume, support and resistance levels, and follow-through on subsequent bars.
Chart Patterns
Because OHLC bars record unsmoothed price behavior, classic reversal and continuation patterns emerge directly from the alignment of their highs, lows, and closes:
- Double Top: Appears as two successive bars or clusters of bars reaching similar highs, separated by a moderate pullback, with the close of the second peak failing to push decisively beyond the first. The highs mark resistance, while the intervening lows trace the trough (neckline) between the peaks.
- Head and Shoulders: Shows up as three consecutive peaks along an upward- then downward-sloping sequence. The middle peak prints higher bar highs than the shoulders on either side, and the closes begin to weaken as the right shoulder forms.
- Flags and Pennants: Continuation patterns that appear as tight clusters of small-range bars following a strong directional move, with highs and lows converging into a narrow channel before price breaks out in the direction of the prior trend.
Traders often confirm a pattern only once a bar closes beyond the neckline or trendline drawn through the relevant highs or lows, treating that close—rather than an intraday spike—as the trigger.
Support and Resistance
Support and resistance levels are price zones where buying or selling pressure has historically been strong enough to halt or reverse a trend. Support acts as a price floor where demand overcomes supply; resistance acts as a ceiling where supply overwhelms demand.
OHLC data is particularly useful for mapping these levels because it captures intraday extremes that closing-price line charts miss. When the high or low ticks of multiple bars cluster around a similar price, they form a visible barrier. For instance, a series of bars with long upper wicks hitting the same price suggests strong resistance, as sellers repeatedly push price down from that level.
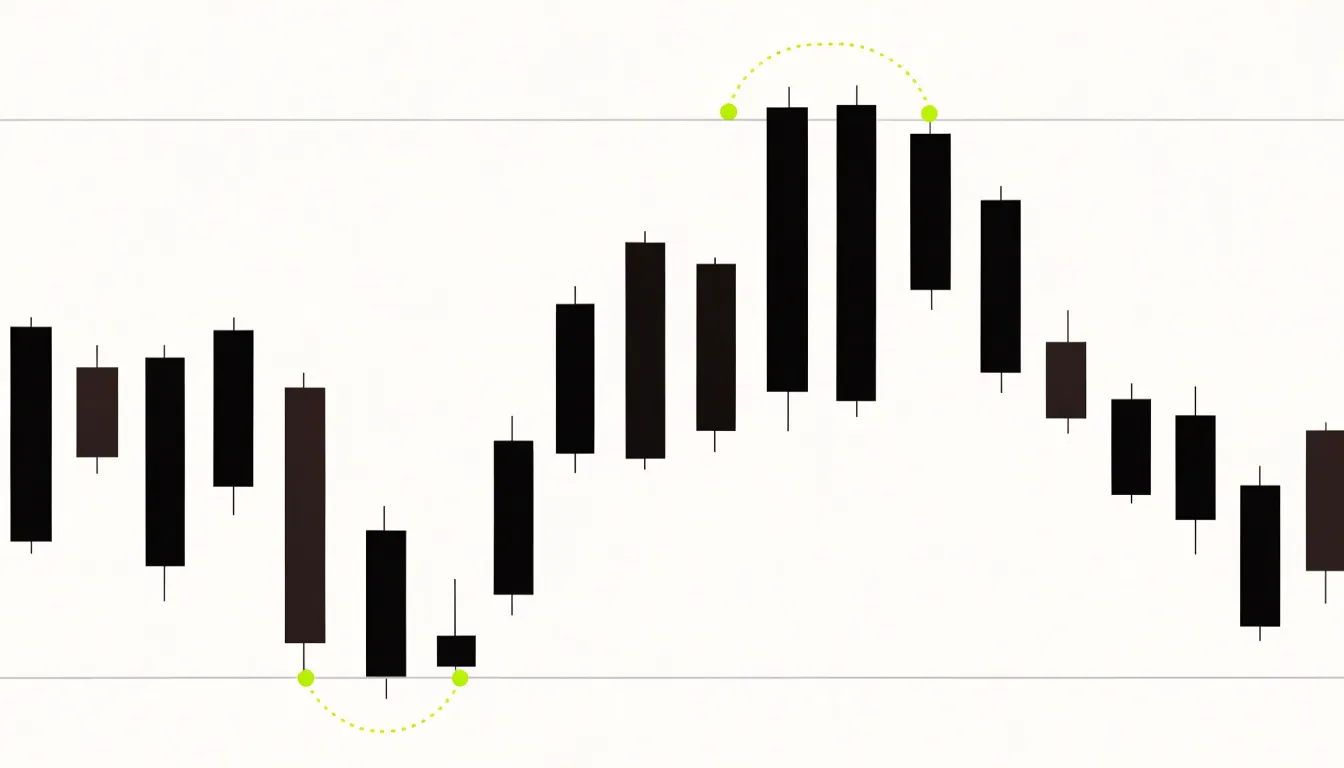
These barriers are zones rather than exact lines, as price often overshoots slightly before reversing. The more frequently a zone is tested and holds, the more significant it becomes for setting entry and exit points, placing stop-losses, and confirming trends.
Volume and Price Action
While a bar’s range shows how far price traveled, volume measures how many shares or contracts changed hands during that same period. Pairing the two reveals whether a price move carries genuine conviction or merely reflects thin, temporary trading.
Traders watch for volume spikes—moments when activity rises well above its recent average, often alongside news events, earnings releases, or the resolution of a prolonged consolidation. When a volume spike coincides with a wide-range OHLC bar closing near its high in an uptrend (or near its low in a downtrend), the elevated participation validates the price movement and reduces the likelihood that the bar is an outlier.
This pairing is essential for judging breakouts beyond support or resistance. A breakout accompanied by a wide-range bar and a clear volume spike confirms that traders are committing capital at the new price level. Conversely, a breakout on narrow ranges and average volume invites caution, since the move may lack the participation needed to sustain it.
False Breakouts
A false breakout occurs when price pushes beyond a well-established support or resistance level but cannot hold that ground, reversing back into the prior range. On an OHLC chart, individual bar structure helps separate genuine momentum from a liquidity grab:
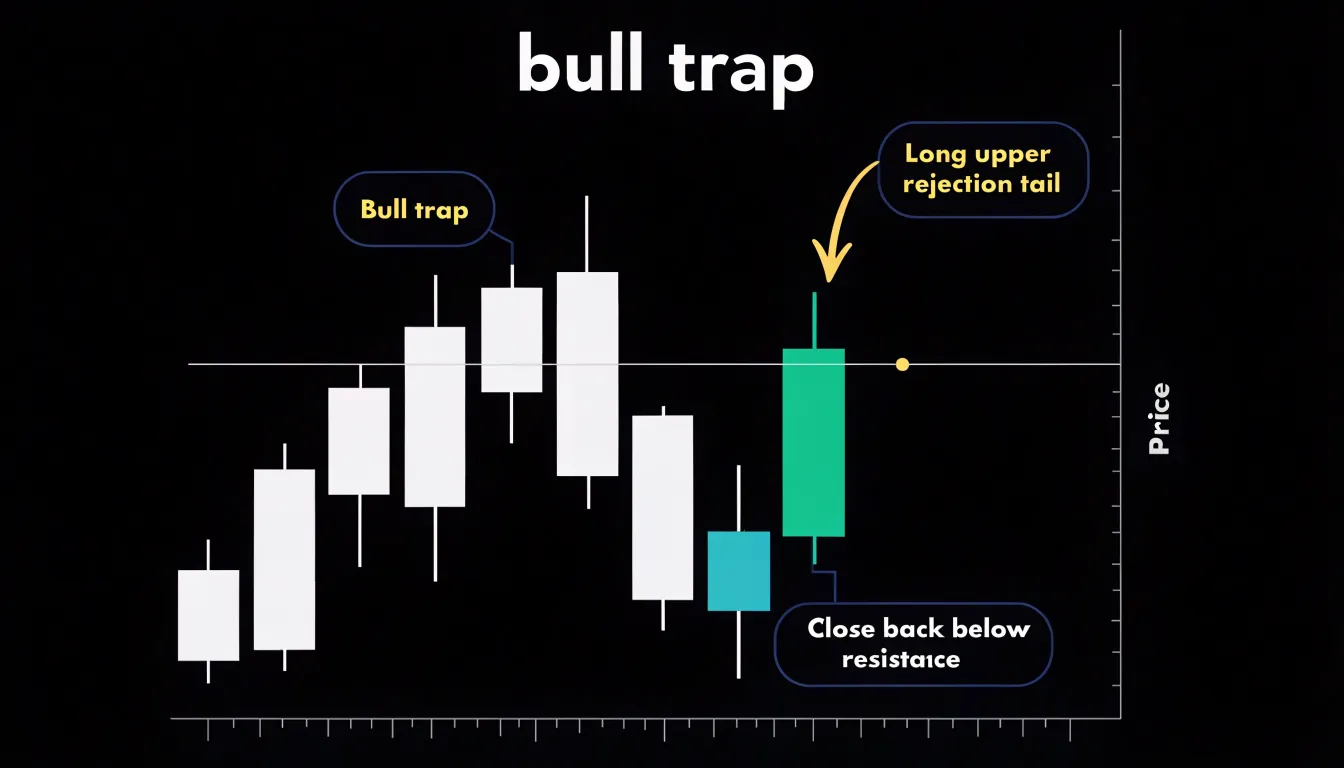
- Bull Trap: Price trades above resistance, drawing in buyers, before closing back below the level. The resulting long upper rejection tail shows that sellers stepped in aggressively at higher prices, and the close beneath resistance confirms the breakout failed.
- Bear Trap: The mirror image, where price dips below support, prints a long lower tail, and snaps back to close above the level as buyers absorb the selling pressure.
The close is the single most important figure for judging breakout validity, especially on higher timeframes. Traders reduce exposure to traps by waiting for a confirmed close beyond the key level, watching for elongated rejection tails, and checking for supporting volume. Because failed breakouts often trigger fast reversals in the opposite direction, prompt recognition protects capital and can even offer a counter-trend entry.
Charting Tools
Selecting charting software requires evaluating three core areas: customization, data integrity, and rendering quality.
A strong platform lets you adjust chart types, timeframes, indicator overlays, candle widths, and color schemes without friction, and allows saving multiple layouts for different instruments or strategies. Drawing tools—such as trendlines, Fibonacci retracements, and horizontal support and resistance levels—should be easy to place, edit, and persist across sessions. Price and indicator alerts add practical value by reducing the need to monitor screens continuously.
Real-time, low-latency data feeds and complete historical data (for backtesting across timeframes) form the backbone of reliable analysis. Gaps or stale prices distort OHLC bars and lead to poor decisions, so check the vendor’s uptime record and whether feeds come directly from exchanges or through a consolidated provider. Factor ongoing data subscription costs into your evaluation if they are not bundled with the software.
Finally, verify that OHLC bars and candles render crisply at any zoom level, with no visual artifacts obscuring wicks or bodies. Test the platform with live data against a reference source before committing to ensure the interface stays responsive and uncluttered during long sessions.
Practical Examples
The following scenarios demonstrate how OHLC values translate into concrete entries and stop-loss levels:
- Bullish Reversal (Hammer): A stock in a downtrend opens on day one at $50, trades as low as $48, reaches a high of $50.50, and closes at $49.50. This small-bodied candle with a long lower shadow (a hammer) suggests selling pressure is being absorbed. On day two, the candle opens at $49.60, dips to $49.40, and rallies to close near its high at $51.20. With the second day confirming the reversal, a trader might enter long at the $51.20 close and place a stop-loss below the hammer’s low of $48.
- Breakout Setup: A stock consolidates between $100 and $105 for weeks, printing small bodies and short shadows. A breakout candle then opens at $104.50, surges to a high of $108, and closes at $107.50. The large body and close well above the $105 boundary signal strong buying momentum. A trader could enter on the breakout with a stop-loss below the breakout candle’s low or the $105 resistance level, watching for subsequent candles to close above $105 to confirm the move.
- Bearish Reversal (Shooting Star): After an uptrend, a candle forms with a long upper shadow and a small body near its low (a shooting star). The next candle opens lower and closes below the shooting star’s low, confirming weakness. A trader might enter a short position on that close, placing a stop-loss above the shooting star’s high.
Charting Habits
A disciplined, repeatable routine keeps chart analysis grounded in consistent evidence rather than impulse:
- Review at a fixed time: Check your charts at the same point each session—after the close for end-of-day trading, or at set intervals for intraday analysis—so you compare like with like.
- Read the latest bar in context: Examine the most recent bar’s open, high, low, and close, along with its body size and wick lengths, and compare it to immediately preceding bars to gauge shifts in momentum and volatility.
- Align timeframes and update levels: Zoom out to a higher timeframe (e.g., weekly) to anchor the broader trend, then return to your primary view. Update key levels—prior highs and lows, gaps, and consolidation zones—each session rather than relying on stale markings.
- Log observations: Keep a brief written record of the patterns in play and the exact price levels that would confirm or invalidate your thesis to prevent hindsight bias.
- Define next-session scenarios: End by noting two or three potential scenarios for the upcoming session and their trigger prices. Cap the entire review at 20 to 30 minutes to keep the habit sustainable.
Frequently Asked Questions
What do the ticks on an OHLC bar chart represent?
On a standard OHLC bar, the left tick represents the open and the right tick represents the close, while the vertical line marks the session’s high and low. Some data providers reverse this orientation, so it pays to check the convention in use.
What is the difference between OHLC bars and candlesticks?
Both OHLC bar charts and candlesticks encode the same four data points, but a bar uses a single vertical line with open and close ticks, while a candlestick uses a body between the open and close and wicks to the high and low. Candlesticks make the open-close relationship dominant and patterns easier to spot, while bars produce a cleaner, more neutral field of lines.
What do green, red, white, or black candles mean on an OHLC chart?
A bullish period, where the close is higher than the open, is typically colored green or white, while a bearish period, where the close is lower than the open, is typically colored red or black. Most platforms also allow color customization.
How can I tell volatility from OHLC bars?
Read the vertical lengths of OHLC bars in sequence: successive longer bars show expansion, while shrinking bars show contraction. Comparing a bar’s total length to its body and to recent bars adds context, and wider bars imply larger potential swings that warrant wider stops or reduced position sizes.
How can you spot a false breakout on an OHLC chart?
A false breakout occurs when price pushes beyond a well-established support or resistance level but cannot hold that ground and reverses back into the prior range. A bull trap closes back below resistance with a long upper rejection tail, a bear trap is the mirror image, and traders often wait for a confirmed close beyond the level while watching for rejection tails and supporting volume.
Do shorter or longer timeframes change how an OHLC chart should be read?
Yes—short timeframes such as one-minute or five-minute charts print many bars and suit scalpers and day traders, daily charts condense a session and filter out noise, and weekly or monthly charts smooth swings for swing traders and position holders tracking macro trends. Many traders combine a higher timeframe for context and direction with a lower one to refine execution.
Tony Astor
Tony writes about data visualization and the tools people use to build charts and dashboards. More about Data Illustrator