Nightingale Rose Chart: History and How to Use It
 By Tony Astor ·

Nightingale Rose Chart
A Nightingale rose chart (also called a rose, polar area, or coxcomb chart) is a circular chart that divides data into equal-angle wedges extending outward from a center point. Each wedge’s radius is proportional to its value, making it ideal for cyclical data such as monthly mortality, rainfall, or wind direction.
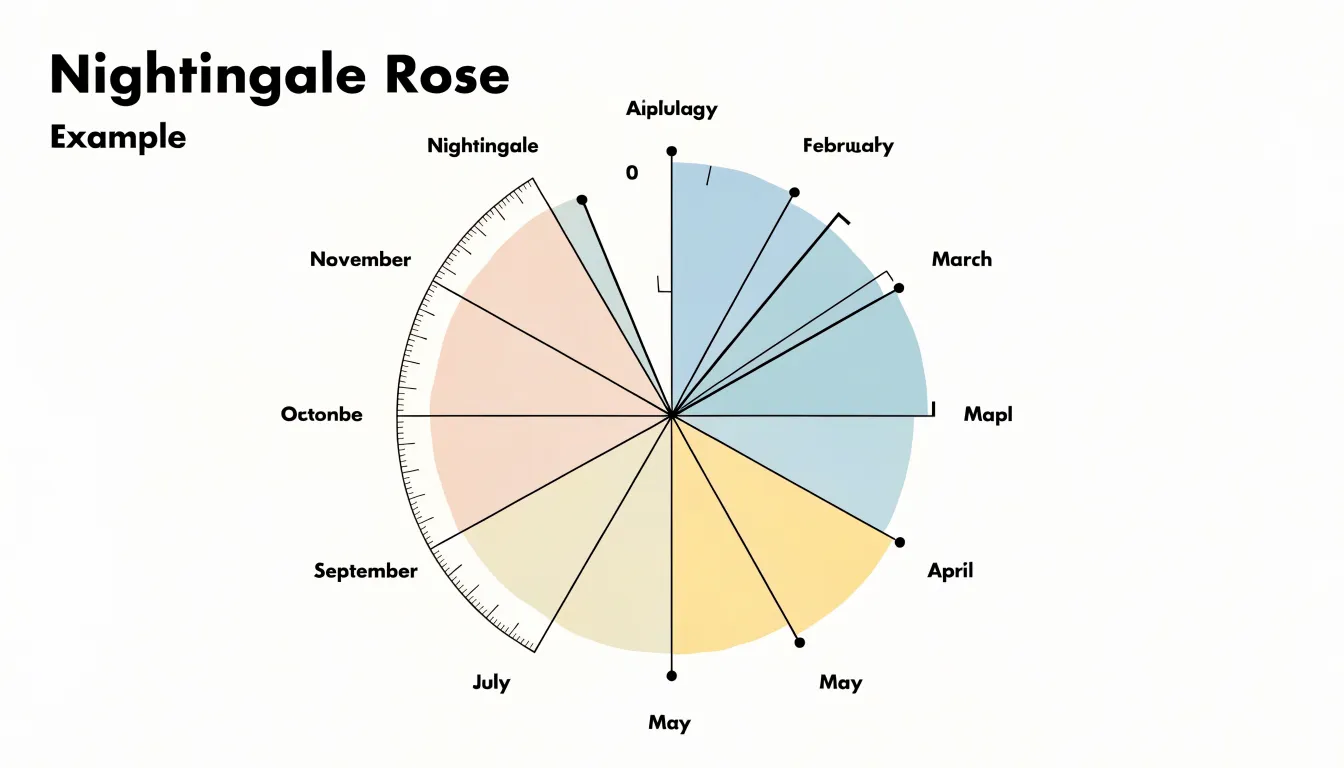
Table of Contents
- Chart Type
- Florence Nightingale and the Crimean War hospital crisis
- Unsanitary conditions and preventable soldier deaths
- Collecting hospital data during the war
- Chart Type
- Reading the wedges
- Color coding causes of death
- Using the chart to persuade Parliament and reform sanitation
- Florence Nightingale’s statistical legacy
- Chart Type
- Chart Type
- Chart Type
- Common mistakes
- Chart Type
- Overview
Chart Type
A Nightingale rose diagram—often called a rose chart, polar area chart, or coxcomb chart—presents data in a circular layout that mirrors the cyclical structure of the information it displays. Beginning from a single central origin point, the plot area is divided into equal-angled wedges, one for each category or time interval in the dataset. Because the wedges share an identical angular width, the circular space is partitioned evenly, allowing the eye to move around the diagram category by category without being distracted by uneven slice sizes.
Instead of adjusting the angle of the slice, the chart conveys value by extending each wedge outward from the center by a distance proportional to the data measurement it represents. A large value produces a long spike reaching toward the outer edge of the circle, while a small value produces a short stub close to the origin. The result is a star-like or petal-like silhouette whose outline encodes the full set of values at a glance. This construction makes the chart especially suited to cyclic phenomena such as monthly rainfall, hourly traffic volumes, seasonal temperatures, or directional wind speeds, where the circular arrangement naturally reflects the repeating order of the underlying data.
Reading the diagram follows the logic of a compass or clock face. Each wedge occupies a fixed position around the circle, placing adjacent categories next to one another so that peaks, troughs, and gradual rises become visible as the outline is traced clockwise or counterclockwise. The central point represents zero, and the outer boundary marks the maximum plotted value.
Florence Nightingale and the Crimean War hospital crisis
The Crimean War, which Britain entered alongside France and the Ottoman Empire in 1854, exposed the British Army’s medical services as catastrophically unprepared for modern warfare. When reports of appalling conditions at the military hospital in Scutari, on the Asian side of the Bosphorus opposite Constantinople, reached London, the government dispatched Florence Nightingale with a party of nurses to take charge of nursing operations. Arriving in November 1854, she found a facility overwhelmed by wounded and sick soldiers pouring in from the front at Balaklava, with barracks, corridors, and makeshift wards packed far beyond any workable capacity.
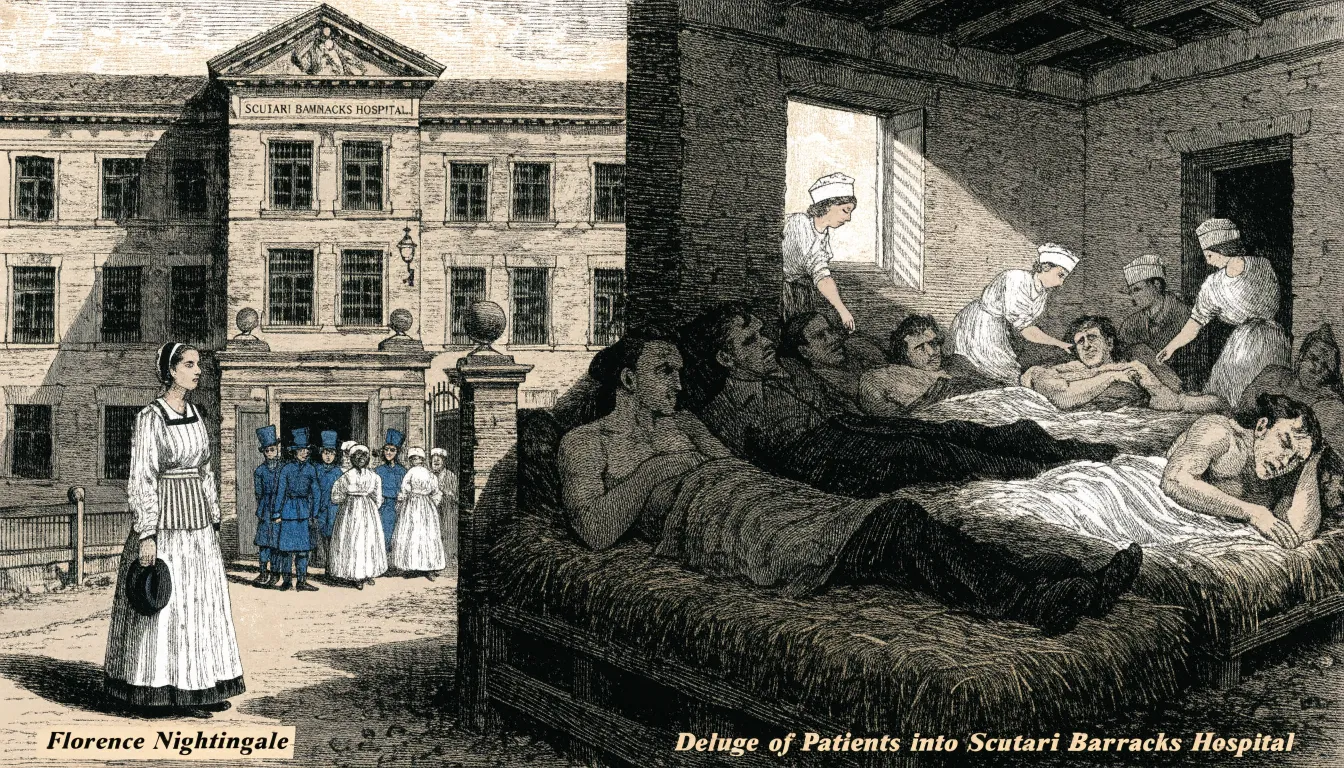
The hospital building was overcrowded and poorly ventilated, its drains and sewers defective, and its water supply contaminated. Wounded men lay on straw pallets in filth, many without blankets or adequate clothing, while lice and vermin spread through the wards. Dysentery, cholera, and typhus swept through the patients faster than any treatment could keep pace. The army’s administrative machinery was equally broken: supplies were mismanaged or lost, and the medical staff were overworked and demoralised. Soldiers who survived their battlefield wounds frequently died of preventable diseases contracted inside the hospital itself.
Nightingale responded with relentless organisation and careful documentation. She imposed order on nursing routines, secured supplies, and campaigned for sanitary reform of the wards and drainage. Simultaneously, she collected and tabulated mortality figures systematically, gathering statistical evidence that could persuade officials in London where rhetoric could not. The Scutari crisis forged her conviction that sanitation and accurate data were instruments of reform—methods she would carry back to Britain to reshape hospital design and public health.
Unsanitary conditions and preventable soldier deaths
At Scutari, the physical environment was the primary killer. Poor ventilation allowed foul air to stagnate, while overflowing sewage saturated the floors and walls. Contaminated water served as the vehicle for cholera, and typhus spread rapidly through lice in the unhygienic, overcrowded wards. Limited access to clean water and inadequate waste disposal compounded the crisis, leading to secondary infections among weakened patients.
Nightingale’s data revealed that the vast majority of fatalities resulted from these preventable illnesses rather than combat injuries. In some months, the death toll from disease dwarfed battlefield losses. Her advocacy for improved ventilation, clean water, and proper sewage systems eventually drove a sharp reduction in mortality rates, laying the foundation for modern hygiene standards in nursing and public health.
Collecting hospital data during the war
When Nightingale arrived at Scutari, no systematic record existed to explain why soldiers were dying in such vast numbers. Recognizing that reform required reliable evidence rather than guesswork, she and her nurses recorded admissions, deaths, diseases, and causes of mortality with a discipline unusual for the period. She insisted that every ward maintain consistent registers and compile figures regularly rather than in occasional, haphazard reports.
Her method rested on standardization. By pressing for uniform categories, she ensured that statistics gathered in one ward or month could be compared meaningfully with those from another. She trained her staff to follow identical procedures, verify entries, and treat record-keeping as a core nursing duty rather than an administrative afterthought.
Nightingale’s collaboration with William Farr, the prominent statistician at the General Register Office, gave her figures a rigorous analytical framework. Farr helped her organize and interpret the mortality returns, apply sound statistical principles, and structure the findings to make the scale of the crisis legible to officials. Together, they transformed raw hospital registers into empirical medical evidence.
Chart Type
Bar charts, the standard tool of nineteenth-century statistical graphics, arranged data along a linear horizontal axis with vertical bars of varying height. While effective for many comparisons, this linear layout obscured the cyclical nature of monthly mortality data. Moving left to right in a straight line turns the recurring winter peaks and summer troughs of disease into isolated events rather than a continuous wave.
A twelve-month radial polar area chart solved this problem by mapping the months onto a circle. This circular design placed December directly adjacent to January, closing the loop and making the annual seasonal cycle visually explicit. Furthermore, assigning equal angles to each sector ensured that every month received the same visual weight, preventing the unequal lengths of calendar months from distorting the comparison. By arranging the data radially, Nightingale preserved the proportional comparisons of the bar chart while capturing the continuous rhythm of the year.
Reading the wedges
In Nightingale’s diagram, each calendar month spans a fixed 30-degree angle at the center of the chart, with twelve slices completing the 360-degree circle. Because the angle never changes, viewers can compare months directly without adjusting for slice width.
As each wedge extends outward in proportion to its monthly mortality count, the fixed 30-degree angle means the area of the wedge grows with the square of its radius. The shaded region enclosed by each pair of radial lines and the outer arc corresponds to the number of deaths. A cluster of long wedges in one part of the circle signals a period of elevated mortality, while short wedges elsewhere mark calmer months. Comparing the outer arcs of adjacent wedges shows how quickly the death rate rose or fell from month to month, allowing readers to measure values against the radial scale while tracing the year’s overall shape.
Color coding causes of death
Nightingale’s chart used a tripartite color scheme to sort mortality into distinct analytical categories:
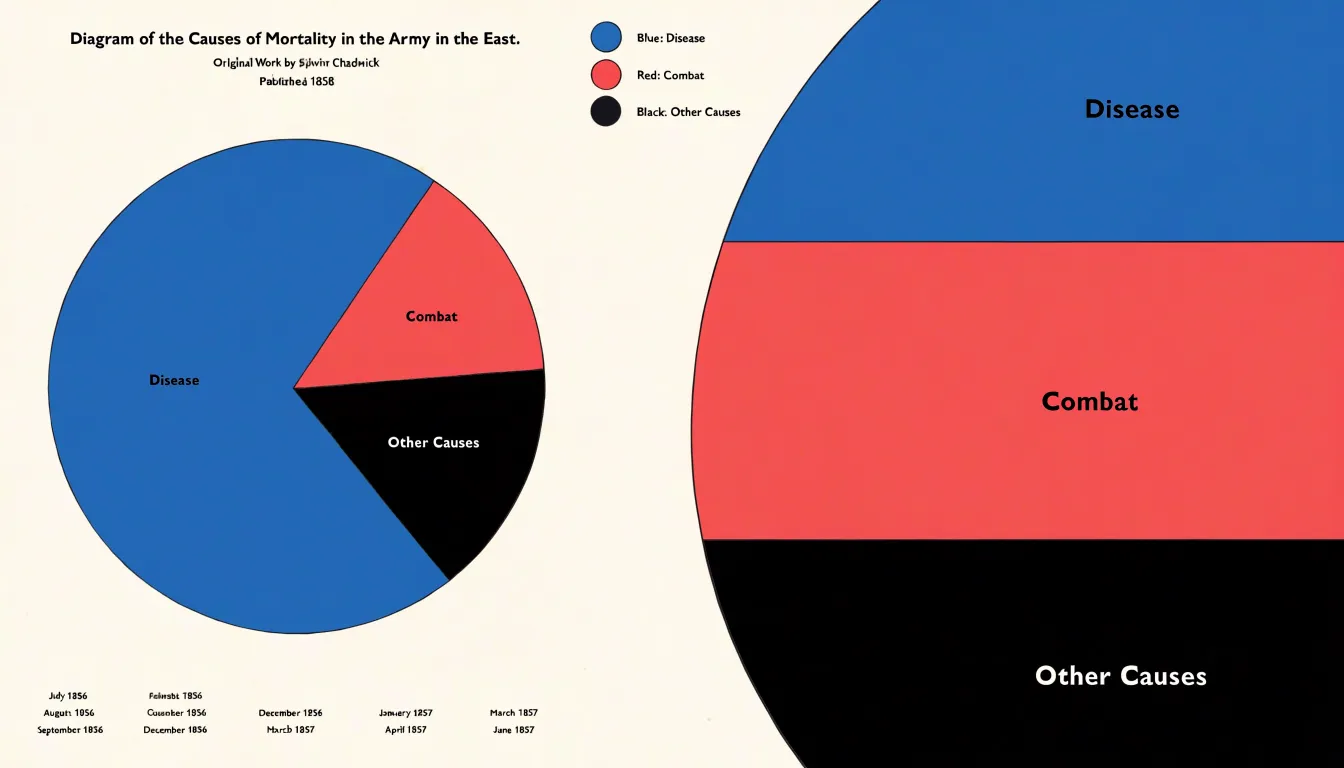
- Blue: Preventable zymotic (infectious) diseases, such as cholera, typhus, and dysentery.
- Red: Deaths from battle wounds.
- Black: All other causes of death.
Blue dominates the diagram, drawing the eye first and making the preventable nature of most deaths instantly legible without requiring the viewer to read a single number. The small red wedges serve as a stark reference point, revealing how few soldiers died from enemy action by comparison, while the black segments complete the statistical accounting without distracting from the central contrast. In an era when statistical graphics were still developing, using hue to separate avoidable deaths from unavoidable ones turned a mortality report into a visual argument for sanitation.
Using the chart to persuade Parliament and reform sanitation
Understanding that busy officials had little patience for dense tables of numbers, Nightingale tailored her visual presentations for maximum political impact. She circulated her diagrams—which accompanied her written reports and official publications—among the most influential figures in Britain, including Queen Victoria and members of Parliament who controlled military funding.
Carried into committee rooms and royal drawing rooms, the charts generated public and political pressure that achieved concrete results: the establishment of a royal commission on military health, the rebuilding and ventilation of barrack hospitals, and the creation of an official sanitary code for the army.
Florence Nightingale’s statistical legacy
In 1858, Nightingale was elected the first female fellow of the Royal Statistical Society, reflecting the respect her analytical work had earned among leading statisticians such as William Farr and Adolphe Quetelet, whose methods she studied and adapted.
Beyond her Crimean War publications, Nightingale shaped the emerging discipline of public health statistics. She campaigned for standardized hospital data collection, advocated for adding health-related statistical questions to the 1861 census, and worked with the War Office to establish systematic recording of peacetime army health. Her insistence on measuring outcomes established the principle that empirical evidence should guide health policy and clinical organization—a direct precursor to modern quality improvement, comparative effectiveness research, and evidence-based medicine.
Chart Type
In modern data visualization, the polar area chart has found renewed use across fields that track directional or seasonal phenomena:
- Epidemiology: Public health dashboards use polar charts to display the seasonal incidence of illnesses such as influenza, making annual rises and falls obvious at a glance.
- Meteorology: Wind roses, which plot the frequency of wind directions and speeds around a compass, are polar area charts used in climate reporting and site assessment. Monthly rainfall, seasonal temperature variations, and wind-borne pollution concentrations are similarly rendered in polar form.
- Cyclical time-series analysis: Hourly energy consumption, daily website traffic, monthly retail sales, and weekly staffing levels follow repeating rhythms that linear line charts can obscure. Placing the cycle on a circle allows analysts to compare periods directly and spot deviations. Modern libraries such as D3, Plotly, and Vega-Lite support these layouts with interactive tooltips and animations.
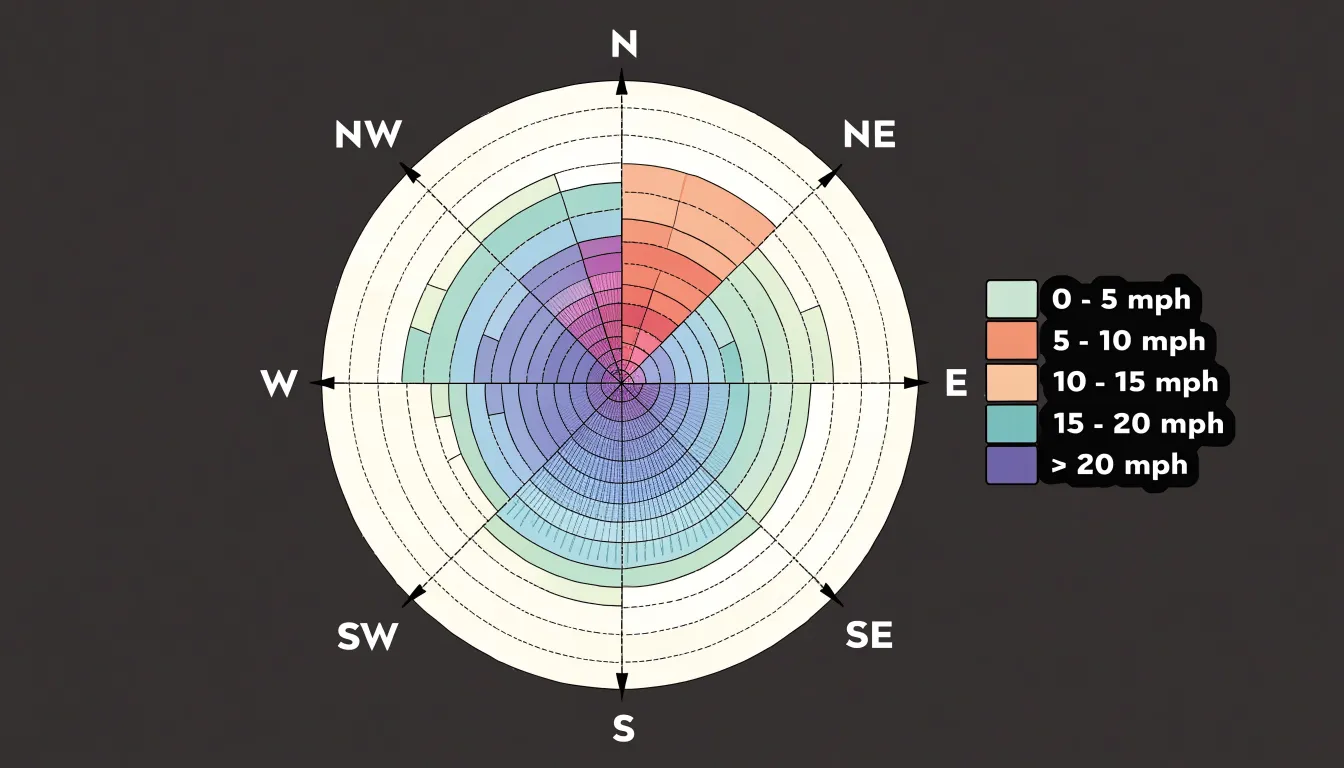
Chart Type
Modern wellness apps and mobile health platforms use the rose chart to pack multi-category tracking into a small screen footprint:
- Sleep tracking: Assigning one wedge per hour of the night, with wedge length encoding sleep depth or movement, produces a circular profile of a night’s rest that highlights when restless periods cluster.
- Daily habits: Wedges representing hydration, steps, screen time, and meditation—each scaled against a daily target—provide a single snapshot of daily routines.
- Symptom frequency: With each wedge standing for a symptom (such as headache, fatigue, or digestive discomfort) and the radius reflecting frequency over a set window, patients can see how symptom proportions shift after a treatment or lifestyle change.
Because similar wedge sizes are difficult to compare with strict precision, app designers usually pair these charts with color coding and interactive tooltips, using the rose chart as a compact summary layer rather than an exact measuring instrument.
Chart Type
Building a rose chart requires different workflows depending on the software platform:
- Tableau: While Tableau lacks a dedicated rose chart button, analysts can construct one by combining a pie chart with calculated fields and multiple measures, or by layering radial bar marks on a shared angular axis.
- R: The
ggplot2package builds rose charts by combiningcoord_polar()withgeom_bar()and a mapped radius aesthetic. Specialized libraries likepolarBarchartand thecircularpackage handle more complex radial layouts, offering precise control over scaling, labels, and legends. - Python: Users can plot bars against theta coordinates using
matplotlib’s polar projection, whileplotlyandbokehgenerate interactive web versions with hover details and zooming. - Excel: Because Excel does not include a native rose chart, users rely on add-ins, workaround templates that remap data onto a radar chart, or manual constructions built from doughnut chart segments.
Choosing among these tools depends on the need for reproducibility, precision, and how frequently the chart must be updated as underlying data changes.
Common mistakes
The most frequent and consequential error in constructing a Nightingale rose chart is scaling the radius linearly with the data value. While human perception tends to focus on the length of the radius, the visual weight of a sector is determined by its area. Because the area of a circle sector grows with the square of its radius, doubling a data value along a linear radius quadruples the sector’s area. This distortion causes viewers to overestimate differences, making modest variations appear enormous.
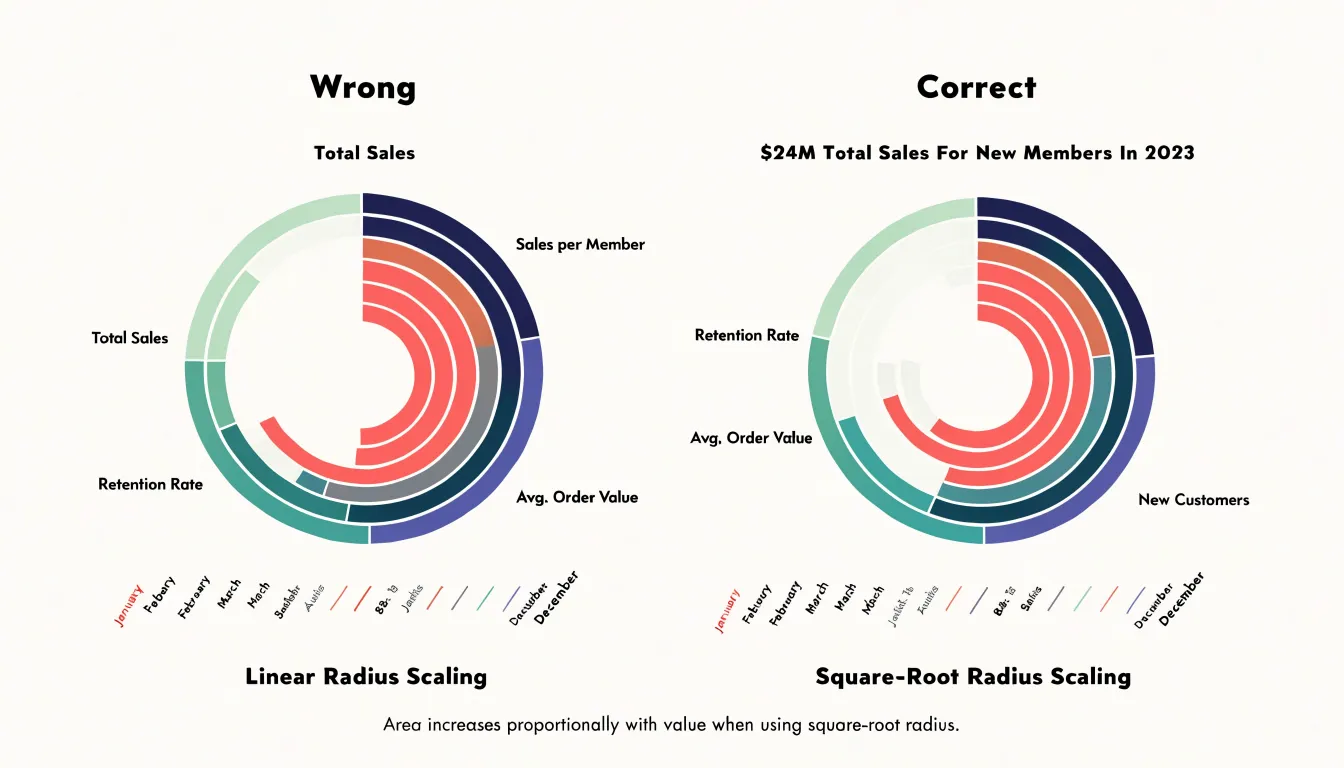
To prevent this, designers must scale the radius by the square root of the data value, ensuring that the resulting area—not the radius length—is directly proportional to the metric.
Two related structural errors can also skew perception:
- Inconsistent scaling: Changing scale formulas across sectors or between paired charts makes side-by-side comparison unreliable.
- Displaced zero baselines: If the center of the chart does not represent zero, or if a large central hole is introduced (as in a doughnut arrangement) without adjusting the geometry, the area-to-value ratio becomes distorted.
Chart Type
The Nightingale rose chart serves as a practical interdisciplinary project for classrooms bridging data science, history, and graphic design. A structured lesson plan can follow several stages:
- Historical inquiry: Students examine Nightingale’s original Crimean War diagrams alongside her correspondence and parliamentary reports to understand how sanitary conditions and statistical arguments intersected in Victorian public health reform.
- Technical reconstruction: Using spreadsheets, Python, or R, students clean the historical dataset, calculate angles and square-root-scaled radii, and recreate the charts digitally to compare against the hand-drawn originals. Younger grades can use simplified pie-chart conversions, while upper grades perform full statistical scaling.
- Design critique: Students evaluate color choices, labeling, and annotations to see how visual hierarchy shapes persuasion. Teams can divide responsibilities across data collection, historical narrative, and graphic design to mirror professional workflows.
- Assessment: Projects conclude with reflective writing on how graphics influence policy, peer critique sessions, and hallway or digital portfolio exhibitions.
Overview
Florence Nightingale’s rose chart stands as one of the earliest graphics designed explicitly to drive policy reform as well as inform. By arranging monthly Crimean War mortality into radial wedges segmented by cause, her design established core principles that still guide modern practice: in data journalism, the commitment to structuring complex datasets around immediate reader comprehension; in information design, matching visual form to the cyclical nature of the message; and in public policy, using empirical visualization as an instrument of advocacy.
Frequently Asked Questions
What is a Nightingale rose chart used for?
A Nightingale rose chart presents data in a circular layout and is especially suited to cyclic phenomena such as monthly rainfall, hourly traffic volumes, seasonal temperatures, or directional wind speeds. Modern uses include epidemiology, meteorology, and cyclical time-series analysis.
How did Florence Nightingale use the rose chart to persuade officials?
Nightingale circulated her diagrams, which accompanied written reports and official publications, among influential figures including Queen Victoria and members of Parliament who controlled military funding. The charts generated public and political pressure that led to a royal commission on military health, the rebuilding and ventilation of barrack hospitals, and an official sanitary code for the army.
What do the colors mean in Florence Nightingale’s rose chart?
Blue represents preventable zymotic (infectious) diseases such as cholera, typhus, and dysentery; red represents deaths from battle wounds; and black represents all other causes of death.
How do you read the wedges in a Nightingale rose chart?
Each wedge occupies a fixed position around the circle, the central point represents zero, and the outer boundary marks the maximum plotted value. The wedge extends outward in proportion to the data value, and comparing the outer arcs of adjacent wedges shows how quickly values rose or fell.
What is a common mistake to avoid when building a Nightingale rose chart?
The most frequent and consequential error is scaling the radius linearly with the data value, because the area of a sector grows with the square of its radius, so doubling a value along a linear radius quadruples the sector’s area. Designers must scale the radius by the square root of the data value so that area, not radius length, is directly proportional to the metric.
How can I create a rose chart in common software?
In Tableau, analysts can combine a pie chart with calculated fields and multiple measures or layer radial bar marks; in R, ggplot2 builds rose charts with coord_polar() and geom_bar(); and in Python, matplotlib’s polar projection, plotly, and bokeh can generate versions. Excel has no native rose chart, so users rely on add-ins, radar-chart workaround templates, or manual doughnut chart segments.
Tony Astor
Tony writes about data visualization and the tools people use to build charts and dashboards. More about Data Illustrator