Network Diagram vs Arc Diagram: Which to Use
 By Tony Astor ·

Network Diagram vs Arc Diagram
A network diagram maps entities as nodes and relationships as edges across a two-dimensional plane, typically using a force-directed layout so clusters, hubs, and bridges emerge from connection density. An arc diagram places nodes along a single ordered line and draws connections as curved arcs, prioritizing sequence and reducing clutter while making link spans easy to trace.
Table of Contents
Network Diagram
A network diagram maps entities as nodes and their relationships as edges, positioning everything within a shared two-dimensional plane so that structure becomes visible at a glance. The most common arrangement technique is the force-directed layout, which treats the drawing as a physical system. Each node repels every other node like charged particles, while each edge acts as a spring pulling connected nodes together. The algorithm iterates until the system settles into a low-energy configuration, producing a webbed layout where tightly connected clusters draw inward and weakly related groups drift toward the periphery. The result is an organic, balanced composition that no manual placement could easily reproduce.
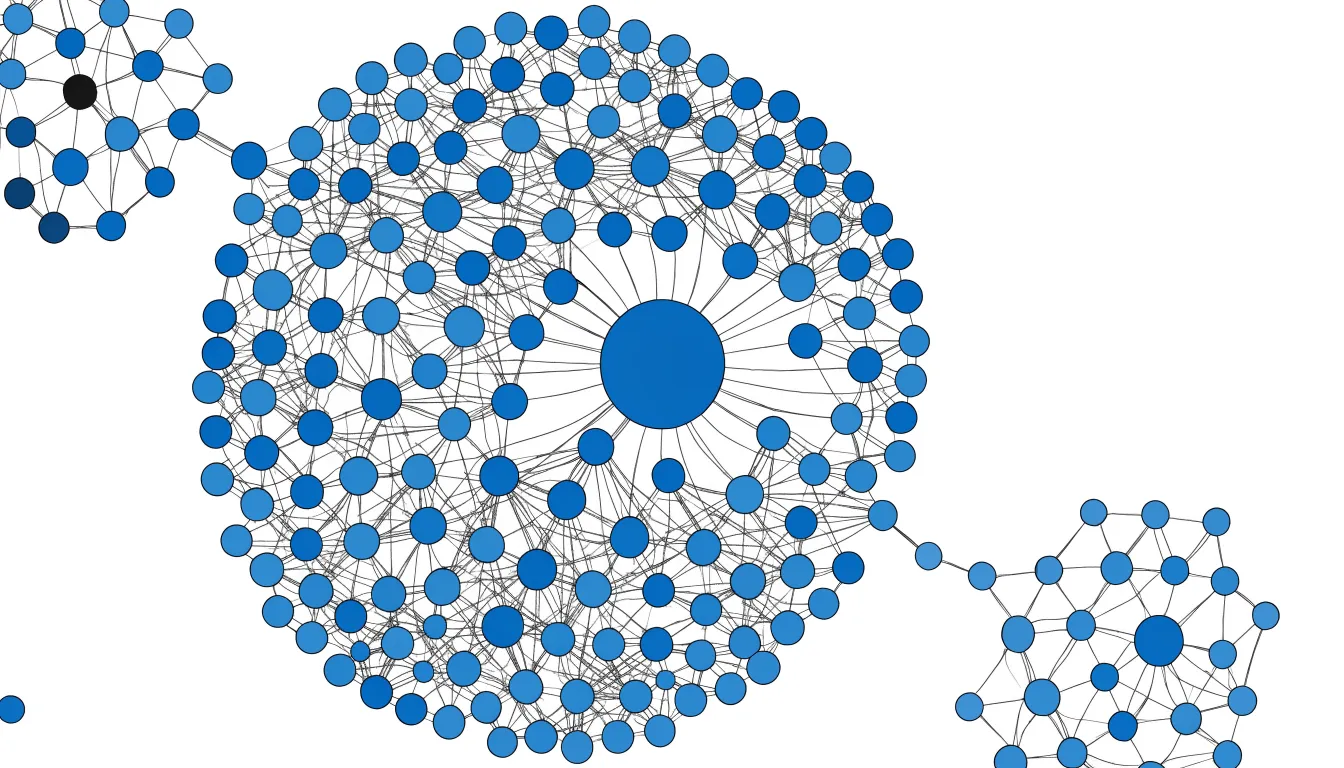
Node-edge relationships carry meaning in their own right. Edge presence shows that a connection exists, while edge weight or thickness can encode its strength, frequency, or volume. Directional edges add flow and hierarchy, and node size or color can represent attributes such as traffic, headcount, or category. Because these visual variables operate together, a single view can communicate both the topology of a system and the relative importance of its parts.
Spatial grouping does much of the analytical work. When many nodes share dense connections, the force-directed layout naturally gathers them into a visible neighborhood, revealing communities, hubs, and bridges without a separate legend. An isolated node stands apart, a hub sits at the center of a starburst, and a broker connecting two clusters occupies the space between them. Readers can trace pathways, spot bottlenecks, and understand an ecosystem as a whole rather than as a list of pairings. This makes network diagrams well suited to complex, interconnected systems such as supply chains, social graphs, and infrastructure maps, where the pattern of connections matters as much as the individual elements.
Arc Diagram
An arc diagram places every node along one straight line, typically horizontal. This one-dimensional arrangement replaces the two-dimensional scatter of a conventional network diagram with a strict linear order. Position along the line carries meaning—often representing an ordered progression such as time, rank, or a predefined sequence. Nodes sit at fixed intervals, and their relative positions become the primary reference frame for the entire visualization.
Connections between nodes are drawn as curved arcs that rise above or below the line, linking pairs of points while preserving the linear layout. The curvature of each arc emphasizes the span between its endpoints: a short arc connects nearby nodes, while a long, sweeping arc bridges distant ones. Layered over the line, the arcs create a secondary visual rhythm that highlights patterns of adjacency, clustering, and long-range linkage.
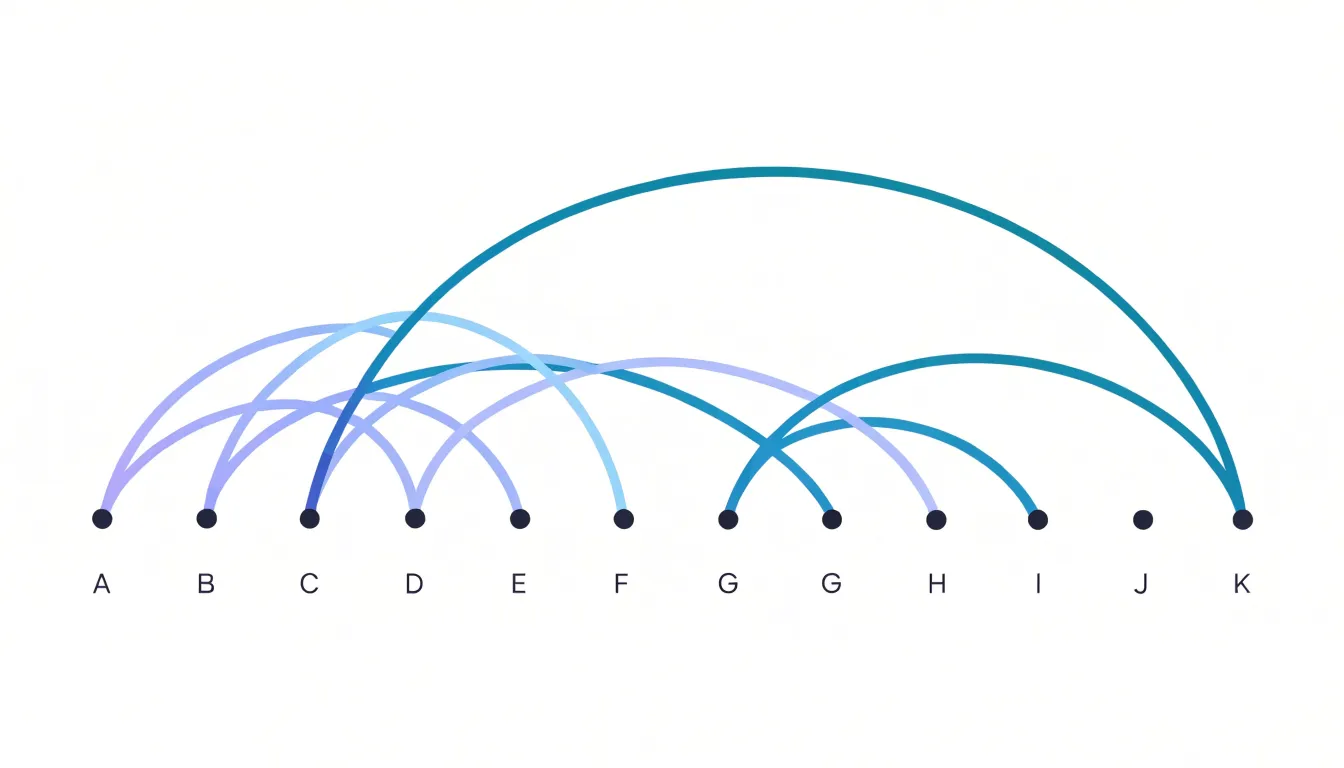
The eye can follow the line from left to right, noting how connections skip forward or backward along the sequence. This layout supports tasks such as identifying recurring motifs, spotting gaps in a chain, or comparing link density at different points in the order. The one-dimensional placement also reduces visual clutter, as links are drawn in a constrained space rather than crisscrossing a plane. By anchoring nodes to a single axis, arc diagrams prioritize the order of elements while still displaying connectivity.
Structural Differences
The structural contrast between these two diagram types shapes how the canvas is used. A network diagram distributes elements across the full width and height of the canvas, with relationships radiating outward from any point in any direction. It consumes space in all directions, expanding outward as nodes are added and filling the available area with a scattered arrangement.
In an arc diagram, each node occupies a fixed slot along a baseline determined by its order in the sequence, with the height and span of each arc encoding information about the link. Even though the arcs introduce vertical variation, this single-axis alignment gives arc diagrams a predictable structure that looks the same regardless of how dense the underlying connections become. Because the baseline is reserved for nodes and the space above and below for connections, the canvas is used in horizontal bands.
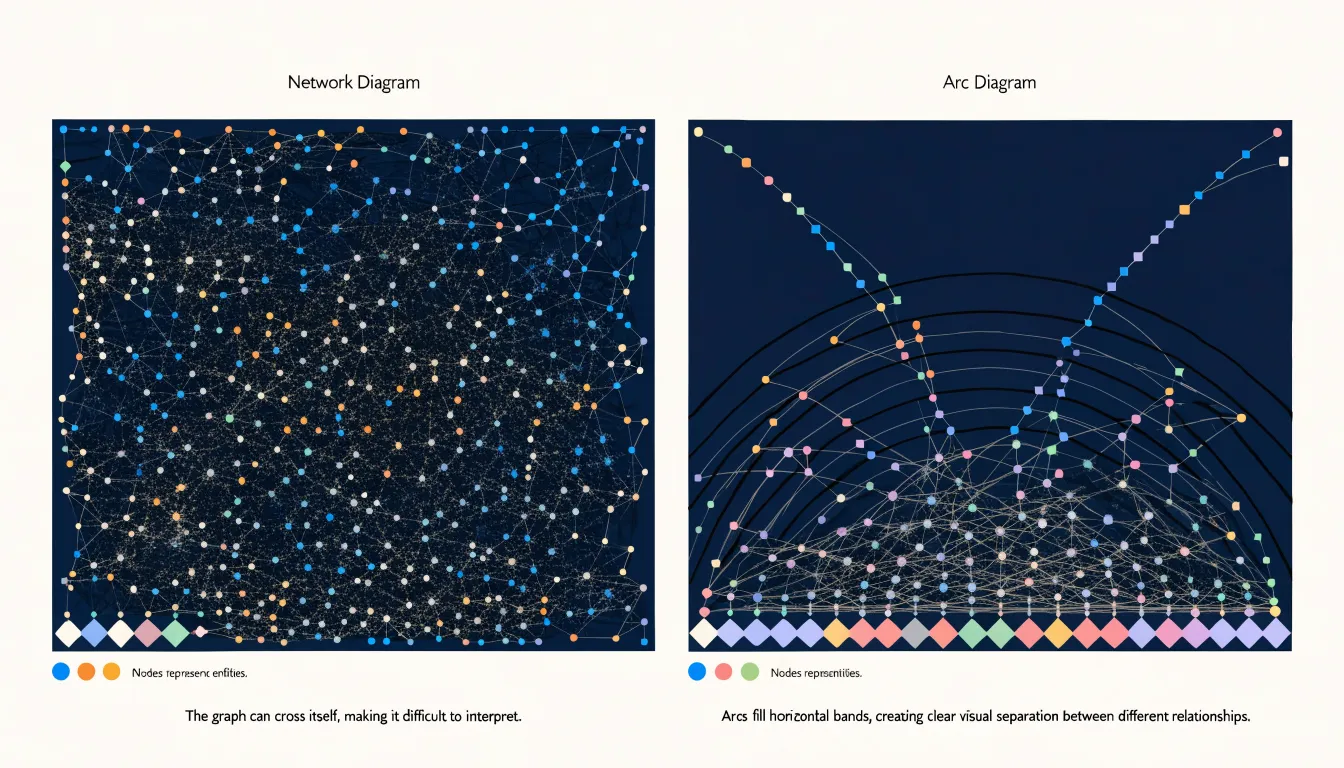
Relationship mapping follows the same divide: network diagrams show connections as direct lines between arbitrary points, making clusters and hubs visible as spatial groupings, while arc diagrams map relationships as spans along a fixed sequence, making the reach and overlap of links easy to read against the ordered baseline.
Reader Comprehension
Reader comprehension hinges on how much mental effort an audience must invest to extract meaning from a chart. Because a network diagram connects nodes with lines that can cross, curve, and cluster across a two-dimensional plane, a reader must trace individual connections across the whole canvas. For non-technical stakeholders, this tracing demands sustained attention, and dense graphs can quickly overwhelm viewers unfamiliar with graph conventions.
In an arc diagram, the order of nodes is immediately legible, allowing readers to scan along the baseline to locate a specific entity before following its arcs. This linear structure reduces the search cost for a given connection and gives non-specialist audiences a familiar reference frame, similar to a timeline or a ranked list, which lowers the cognitive burden of orientation.
For specialized data analysts, the trade-off shifts. Network diagrams preserve spatial relationships and community structure, supporting exploratory analysis where the overall shape of the graph matters. Arc diagrams, with their fixed ordering, can obscure some of that topological intuition, particularly when arcs overlap heavily in the middle of the axis. Analysts accustomed to force-directed layouts may find the arc format less expressive for detecting certain structural patterns, though they can read either format efficiently once trained.
The practical implication is to match the format to the audience’s background and the task at hand. When communicating a small number of key relationships to a broad business audience, the arc diagram’s linear clarity tends to produce faster and more accurate comprehension. When letting experts explore complex structure, the network diagram’s spatial richness often justifies its higher processing demands.
Handling Large Datasets
Large datasets push both diagram types to their visual limits. In a conventional network diagram, thousands of nodes and edges collapse into a dense hairball where individual connections become indistinguishable. To manage this:
- Reduce what is drawn: Apply degree-based filtering to hide low-importance nodes, or use edge bundling to merge parallel connections into thicker paths.
- Use spatial separation: Apply force-directed layouts that push unrelated clusters apart.
- Add interactivity: Use hover highlighting, zooming, and focus-plus-context views to let viewers isolate one neighborhood without losing the overall pattern.
For arc diagrams, the primary challenge is overlapping edge arches, where many arcs spanning the same positions become a stack of indistinguishable curves. To manage this:
- Sort arcs: Order them by length or by source and target position, so that long arcs sit behind shorter ones.
- Adjust styling and position: Use transparency and color gradients to reveal density, while applying slight vertical offsets or jitter to separate arcs that would otherwise coincide.
- Alter the layout: Layer arcs in separate bands, or use a circular layout where arcs are drawn around a ring rather than along a line, which reduces crossings for certain data structures.
In both diagram types, aggregation is key: group nodes into clusters and draw summarized edges between them, then allow drill-down for detail. Progressive disclosure, where only a high-level structure is shown initially, prevents visual sprawl. Consistent styling with muted colors for background edges and strong colors for selected edges keeps the viewer oriented, controlling where visual attention goes.
Sequence and Order
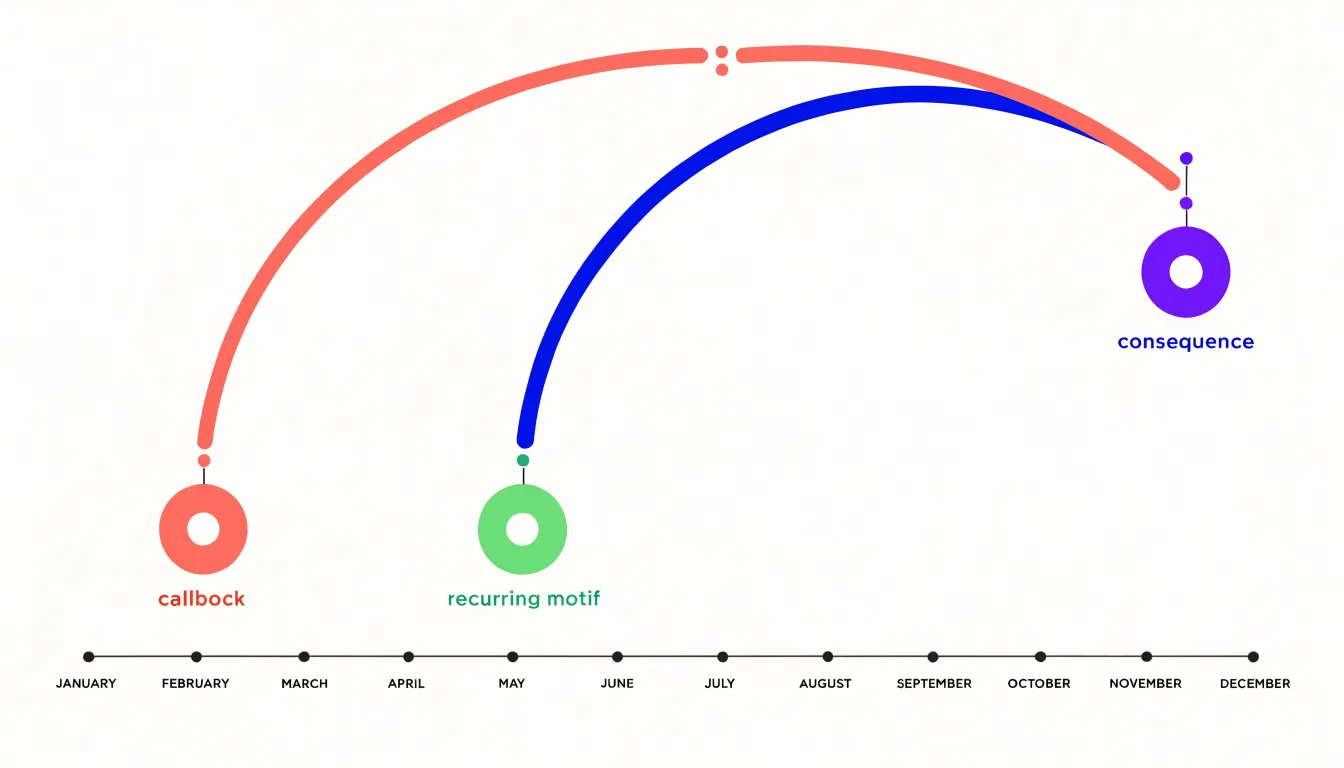
Because an arc diagram’s node ordering is imposed rather than computed from connectivity, the horizontal position of every node carries stable meaning. When the sequence maps to time, left-to-right movement corresponds directly to temporal progression. Events, transactions, or states appear in the order they occurred, and each arc spans the interval between its endpoints, making duration and separation legible at a glance. A reader can trace a thread of activity across months without losing their place, since the anchor points never shift.
The same property supports narrative flow. Stories, processes, and procedural steps unfold in a natural reading direction, and the arcs reveal how distant moments connect back to one another, such as a callback, a recurring motif, or a consequence that surfaces many steps later. Fixed ordering also benefits ordered categorical data, including stages in a pipeline, ranks in a hierarchy, or phases of a project. Honoring an intrinsic order spatially reduces cognitive effort and lets viewers apply their existing expectations about what comes before and after.
Fixed node ordering introduces a trade-off: since placement is not optimized to minimize crossings or shorten arcs, dense or irregular relationships can produce visual clutter. However, the payoff is predictability. Viewers learn the axis once and can then read any arc diagram in the same family without relearning the layout, making the form well suited to temporal and sequential communication.
Cluster Analysis
Network diagrams are particularly effective for cluster analysis in webbed systems where entities connect through multiple pathways, forming overlapping and nested groups. This approach excels at revealing modular communities—subsets of nodes that are more densely connected to each other than to the rest of the network. By visualizing these dense regions, analysts can quickly identify distinct functional groups or social circles without imposing a predefined hierarchy.
Nodes with high degree or high betweenness centrality also stand out as central hubs, often connecting otherwise separate clusters. This visibility is crucial for understanding how information, resources, or influence flow through the system. Highly connected sub-groups, such as cliques or core-periphery structures, are similarly easy to spot because the diagram preserves all edges, including those that cross cluster boundaries. These bridging ties are essential for identifying brokers and potential points of failure.
Analysts can adjust force-directed layouts to highlight different aspects, such as community detection results or centrality measures. In contrast, representations that enforce a single directional flow tend to obscure the bidirectional and cyclical relationships that define webbed systems. By maintaining the full complexity of connections, network diagrams provide a faithful map of a system’s organization and dynamics.
Directional Flow
Directional flow in link diagrams depends on a small set of visual conventions:
- Arrowheads: A single triangle at one end of an edge declares a one-way route, with the wide base marking the origin and the point marking the destination. When both ends carry arrowheads, the link is reciprocal, though the doubled triangles can crowd short edges and add visual noise.
- Bidirectional arcs: Splitting a connection into two separate curves—one arcing above the baseline and one below, each with its own arrowhead—shows two distinct one-way routes rather than one ambiguous two-way line. This above/below arrangement keeps the two directions spatially independent, which helps when reciprocal traffic differs in volume or meaning.
- Edge gradients: A line that fades from dark at the source to light at the target encodes asymmetry without any arrowhead, while a dark-light-dark gradient signals flow moving in both directions across a shared path.
- Color: Warm tones can indicate outbound flow while cool tones mark return traffic.
Combining these devices requires restraint. A diagram that uses arrowheads, split arcs, and gradients together risks overwhelming the reader, so most effective designs pick one primary directional cue and let the others reinforce it. The viewer should be able to trace a route from origin to destination at a glance, and recognize instantly whether a relationship runs one way or both.
Tools and Libraries
A wide range of software tools and libraries covers both network diagrams and arc diagrams across programming skill levels and delivery formats:
- D3.js: A flexible JavaScript library for web-based work that handles both formats through its force simulation and arc generator modules. Developers can bind node and link data to SVG elements, position nodes with physics-based layouts, and draw arcs along a baseline using the arc path generator, making it a common choice for interactive web visualizations with hover states and zooming.
- Gephi: A desktop application with a visual interface that excels at network diagrams, offering layout algorithms such as ForceAtlas2, community detection, and extensive filtering. Users can import edge lists, style nodes by degree or modularity class, and export publication-ready graphics. Gephi handles arc-style layouts less directly, so practitioners often pair it with scripting for custom edge rendering.
- NetworkX (Python): Provides underlying graph data structures and algorithms, reads and writes many graph formats, and computes centrality and clustering metrics. It interfaces with Matplotlib for static plots, pairs with Plotly or HoloViews for interactive output, and feeds directly into arc diagram recipes that place nodes on a line and draw semicircular edges.
- R packages:
igraphandggraphcombine graph analysis with the grammar-of-graphics approach for layered plotting. Thearcsandgeom_edge_arcfunctions allow curved edge rendering, whilevisNetworkandnetworkD3wrap JavaScript libraries for interactive HTML widgets. - Other options: Cytoscape for biological networks, Graphviz for automated layout, and Observable notebooks for quick prototyping.
Styling and Customization
Strategic use of color, thickness, and opacity encodes additional data dimensions to create a layered visual hierarchy:
- Stroke width: Thicker lines naturally represent stronger connections or higher frequencies for edge weight, allowing viewers to quickly identify dominant relationships.
- Size and color intensity: These encode node importance, drawing attention to key entities.
- Color scales: Sequential or diverging scales represent continuous variables like centrality scores or edge weights, while distinct hues differentiate categorical clusters or types. Scales should be perceptually uniform to ensure intuitive encoding.
- Opacity: Fading less important elements into the background reduces visual clutter and guides the viewer’s eye to critical patterns.
Accessibility
Inclusive design ensures that network and arc diagrams communicate effectively to users with visual, motor, or cognitive impairments:
- High-contrast color pairings: Enhance readability for users with low vision or color vision deficiencies by choosing colors that differ in luminance as well as hue, and avoiding problematic combinations like red-green.
- Keyboard navigation: Allow users to traverse interactive elements using tab keys, arrow keys, and other standard controls, with visible focus indicators for exploring data without a mouse.
- Tooltip callouts: Provide concise, on-demand textual explanations for individual nodes or edges on hover or focus, reducing reliance on visual encoding alone. These should be dismissible and positioned to avoid obscuring other content.
- Screen-reader descriptive text: Include a summary of the diagram’s structure, key patterns, and depicted relationships, along with alternative text for individual interactive elements. Integrate this text into the page’s accessibility tree using ARIA labels and roles so assistive technologies can convey the meaning.
Accessibility is an ongoing process of testing with real users and refining designs to remove barriers.
Best Practices
Clean and legible arc and network diagrams depend on deliberate visual design choices:
- Node sorting: For arc diagrams, ordering nodes along the axis by a meaningful attribute—such as degree, cluster membership, or data category—reduces edge crossings and reveals structural patterns. For network diagrams, sorting algorithms like barycentric ordering or force-directed layouts with careful parameter tuning minimize overlap and highlight communities.
- Edge bundling: Grouping edges that share similar paths or endpoints—using techniques like hierarchical bundling or curve smoothing—creates visual corridors that emphasize high-level connectivity. Bundling strength should be adjusted to avoid obscuring individual connections.
- Label placement: Position labels to avoid overlapping nodes or edges, often using automatic placement algorithms with collision detection and leader lines. In arc diagrams, place labels at the ends of arcs or along the axis with rotation; in network diagrams, place labels near high-centrality nodes or consistently relative to node position.
- Visual restraint: Limit visible labels through filtering or interactive reveal, use consistent color and line styles to encode categories, and maintain adequate spacing between elements.
Real World Use Cases
Different industries apply network and arc diagrams based on the shape of their data:
- Social media platforms: Rely on network diagrams to map user relationships, visualizing follower clusters, influencer hubs, and the pathways through which content spreads.
- Text analysis: Linguists and data scientists studying co-occurrence and language structure use arc diagrams to display linear sequences of words, sentences, or tokens without crossing edges, revealing recurring patterns, repeated phrases, and structural relationships.
- Co-authorship tracking: Research institutions and academic publishers map collaboration networks across disciplines and institutions, using network diagrams to emphasize the overall relationship web or arc diagrams to show the sequence of contributions over time.
- Genomic sequencing: Biologists use arc diagrams where the linear genome acts as the baseline along a chromosome and arcs connect regions that interact or have been rearranged, visualizing duplications, inversions, and long-range contacts in a compact form.
Common Pitfalls
Design choices that do not follow systematic rules can inadvertently misrepresent the underlying data:
- Arbitrary spatial rendering: Placing nodes without a consistent rule—such as random positioning or aesthetic-driven layouts—can imply relationships or clusters that do not exist, leading to false conclusions about proximity or grouping.
- Unorganized node axis: Sorting an arc diagram’s nodes alphabetically rather than by connectivity or another meaningful metric creates visual patterns that obscure the actual structure.
- Overlapping lines and misleading crossovers: In dense diagrams, frequent edge crossings can be mistaken for intersections or shared connections, especially when lines share similar styles. Overlapping arcs without clear separation cause visual ambiguity about which nodes are connected, distorting the perception of directionality, weight, or hierarchy.
Making Your Final Choice
A repeatable framework grounds the choice between a network diagram and an arc diagram in data characteristics rather than personal preference.
A summary matrix maps each diagram type against three primary criteria, organized as a small table with short qualitative ratings or checkmarks:
- Ordering: Do nodes sit on a natural continuum such as time, sequence, or rank?
- Density: What is the expected number of edges relative to nodes, given that heavy interconnection can turn layouts into a visual tangle?
- Intent: Is the goal to explore cluster structure or trace individual flow paths?
A step-by-step flowchart walks teams through the same logic in sequence:
- Ask whether the data has a natural ordering (pointing toward an arc-based layout or a free-form node-link layout).
- Probe connection density (directing dense cases toward representations that manage occlusion).
- Clarify the communication goal (distinguishing between showing overall topology and highlighting specific trajectories).
A dashboard overview presents the matrix and flowchart side by side alongside worked examples, showing stakeholders how earlier decisions translate into finished visuals. Teams that adopt this combined framework can document their rationale, revisit choices as datasets evolve, and align reviewers quickly.
Frequently Asked Questions
What is the difference between a network diagram and an arc diagram?
A network diagram maps entities as nodes and relationships as edges across a two-dimensional plane, while an arc diagram places every node along one straight line and draws connections as curved arcs above or below the line. Network diagrams show clusters and hubs as spatial groupings, while arc diagrams map relationships as spans along a fixed sequence.
When should I use an arc diagram instead of a network diagram?
The article says to match the format to the audience and task: when communicating a small number of key relationships to a broad business audience, arc diagrams tend to produce faster and more accurate comprehension. When letting experts explore complex structure, network diagrams’ spatial richness often justifies their higher processing demands.
Are network diagrams good for cluster analysis?
The article states that network diagrams are particularly effective for cluster analysis in webbed systems, revealing modular communities and making central hubs and bridging ties visible. It also says representations that enforce a single directional flow tend to obscure the bidirectional and cyclical relationships that define webbed systems.
How do you handle large datasets in network and arc diagrams?
For network diagrams, the article recommends degree-based filtering, edge bundling, force-directed spatial separation, and interactivity such as hover highlighting and zooming. For arc diagrams, it recommends sorting arcs, using transparency and color gradients, applying vertical offsets or jitter, and altering the layout with separate bands or a circular layout; in both, aggregate nodes into clusters and use progressive disclosure.
Why does node order matter in an arc diagram?
In an arc diagram, node ordering is imposed rather than computed, so each node’s horizontal position carries stable meaning and often represents an ordered progression such as time, rank, or a predefined sequence. Fixed ordering supports narrative flow and predictability, but because placement is not optimized to minimize crossings, dense or irregular relationships can produce visual clutter.
How can I make network and arc diagrams accessible?
The article recommends high-contrast color pairings that differ in luminance as well as hue, and avoiding problematic combinations like red-green for users with low vision or color vision deficiencies. It also recommends keyboard navigation with visible focus indicators, dismissible tooltip callouts, and screen-reader descriptive text integrated with ARIA labels and roles.
Tony Astor
Tony writes about data visualization and the tools people use to build charts and dashboards. More about Data Illustrator