Marimekko vs Stacked Bar Chart: Key Differences
 By Tony Astor ·

Marimekko vs Stacked Bar Chart
A Marimekko chart is a stacked bar chart with variable column widths, where width encodes a second value like market size or revenue and segment height shows each part’s percentage share. A standard stacked bar uses equal widths, making it simpler to read. Use Marimekko when comparing both composition and overall magnitude across categories.
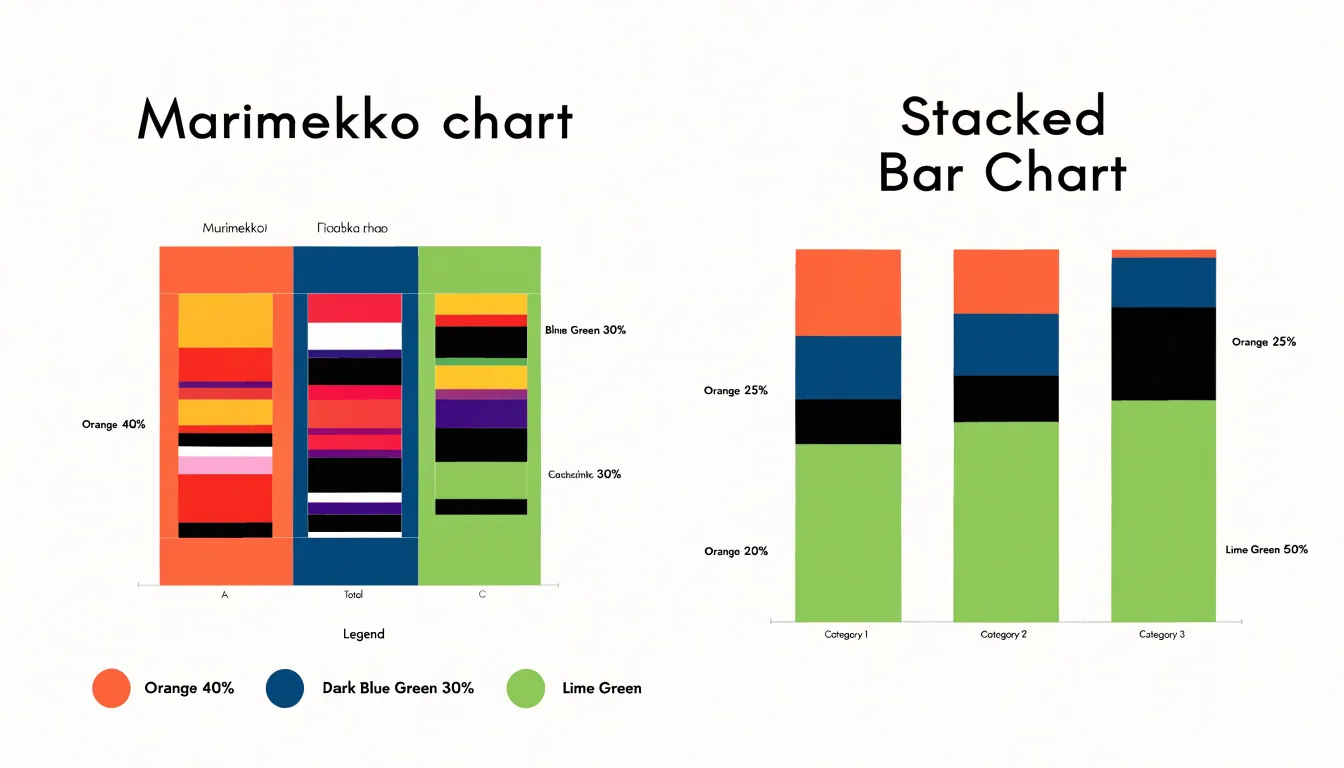
Table of Contents
Stacked Bar Chart
A standard stacked bar chart displays parts of a whole across a single dimension. Each bar represents a fixed category, and colored segments sit on top of one another to represent the components that make up the total. The full height of the bar corresponds to the whole, so every segment’s size reflects its relative share. Categories run along one axis, and the accumulated magnitude runs along the other.
This design makes stacked bars well suited to straightforward categorical comparisons across a few fixed categories, such as regions, product lines, or survey responses. Viewers can compare totals by scanning bar heights while noting the composition inside each bar. A segment that grows from one bar to the next signals a shift in share, and a segment that keeps a consistent thickness across bars suggests a stable proportional contribution. Because every bar shares the same set of segments in the same order, the eye can track a single color across categories and follow its trajectory with relative ease.
With one dimension organizing the categories, the chart avoids competing visual hierarchies. Absolute segment values can be read from the axis when needed, and relative proportions remain visible through the segment lengths themselves. For audiences who need a quick picture of how wholes break into parts across a handful of categories, the standard stacked bar offers a compact and legible format.
Marimekko Chart
A Marimekko chart displays parts of a whole using vertical columns whose widths vary from one category to the next. The height of each segment within a column represents that segment’s share of its own column’s total, so every column reaches the same full height and reads as a complete whole.
The variable width introduces a second quantitative dimension. Column width is tied to a measure such as overall market size, total revenue, or transaction volume, so a wide column signals a large total while a narrow one signals a small one. The area of each segment therefore multiplies share by volume, reflecting the true scale of each sub-category.
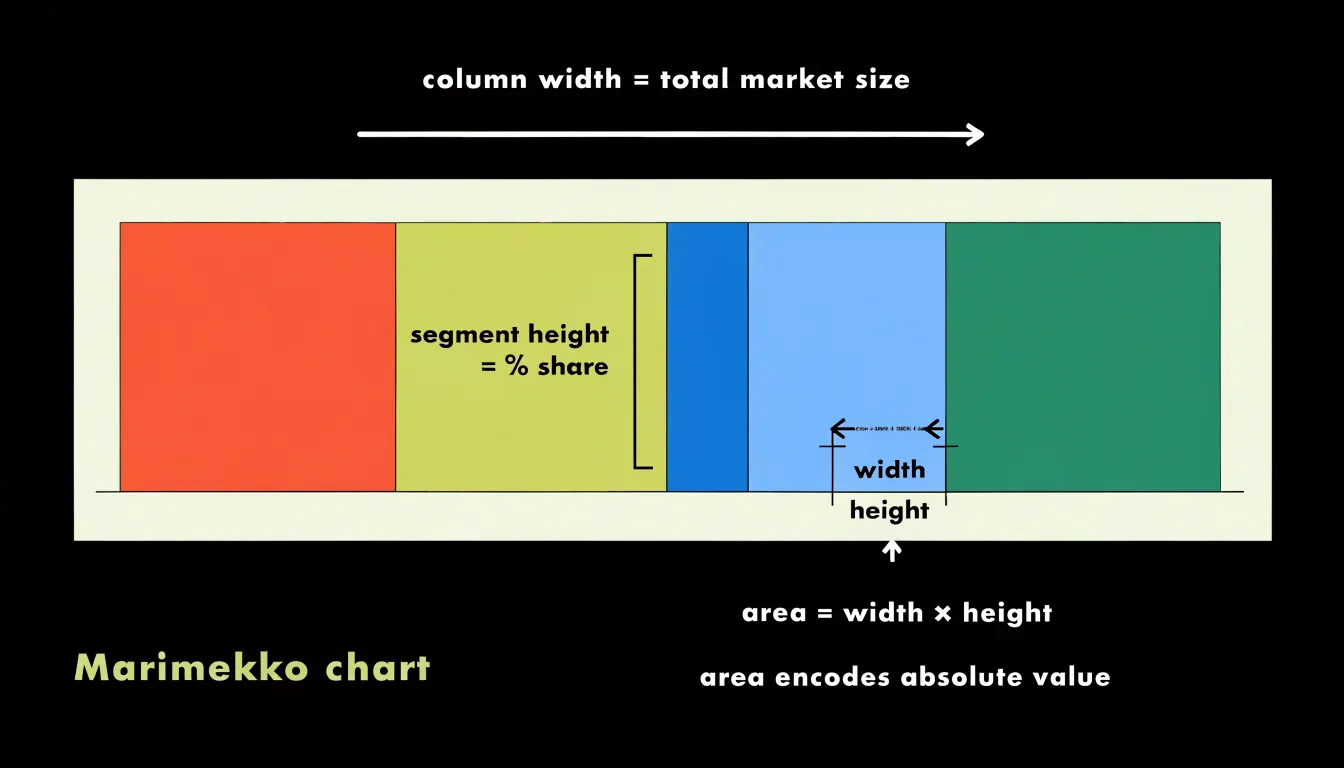
Reading the chart involves two moves at once: moving vertically within a column shows composition, while moving horizontally across columns shows scale. A segment that looks modest in height may still represent substantial absolute value because it sits inside a wide column, and a tall segment in a narrow column may be visually prominent yet numerically small. This makes the chart well suited to questions about market share across markets of different sizes, product mix across regions with different sales totals, or budget allocation across departments of unequal headcount. Careful labeling of widths, often with percentage or absolute totals beneath each column, helps readers decode the second variable accurately.
Segment Width
Because column width in a Marimekko chart is proportional to the sum of the values within that column, a column twice as wide as another represents twice the total magnitude. The total area of a column represents the overall magnitude of that category, and the sum of all column areas equals the grand total.
Columns are often sorted by width to facilitate comparison. Because varying widths can make it challenging to compare segment heights across columns, readers should use segment area as the primary cue for absolute comparisons.
Segment Height
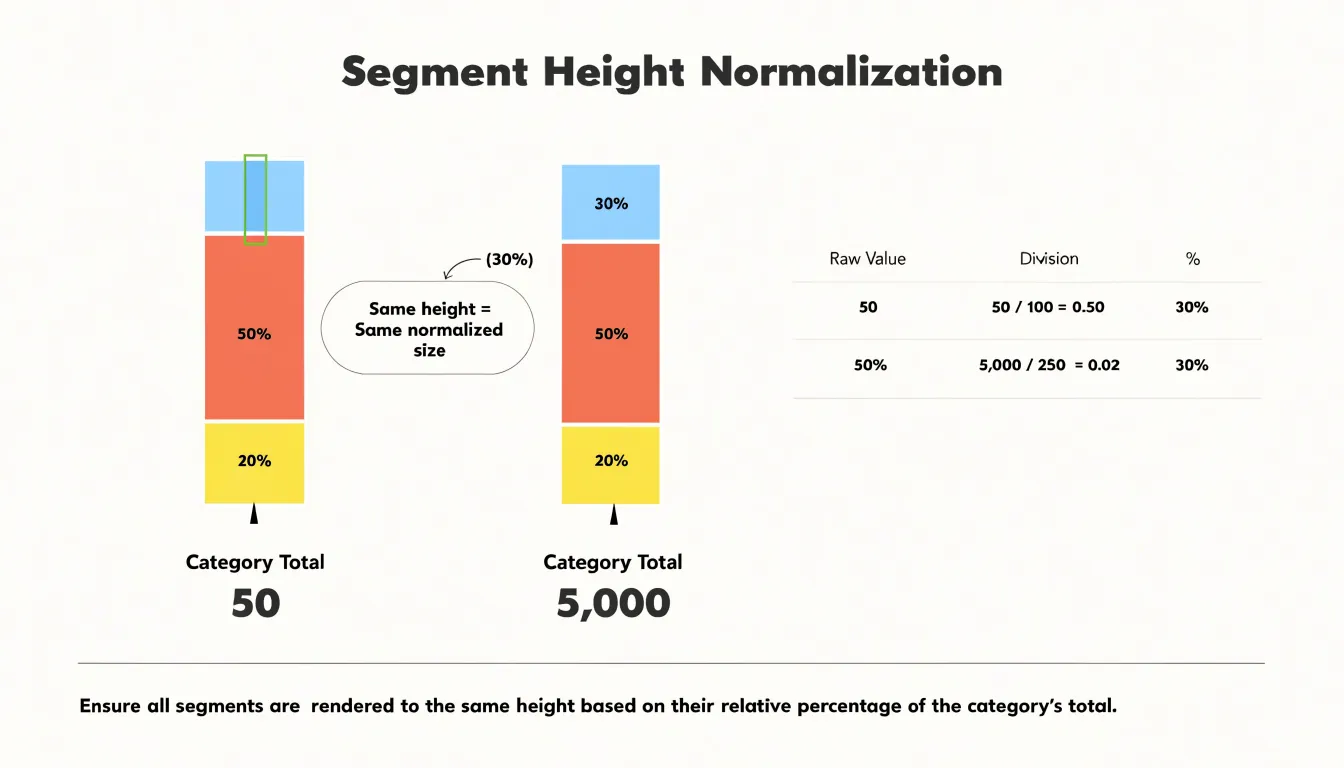
In both the Marimekko chart and the 100% stacked bar chart, vertical segment height represents a percentage derived from normalizing each category to a common scale of 100 percent. Each category holds a set of sub-values that sum to a total. Each sub-value is divided by that category total to produce a proportion between zero and one, and multiplying by 100 yields the percentage that governs how much vertical space a segment occupies.
Every column, regardless of its underlying magnitude, is stretched or compressed so its segments together span the full vertical axis. A category with a total of 50 and one with a total of 5,000 both fill the same height when fully normalized. A segment worth 30 percent of its category always occupies 30 percent of the column’s vertical extent, whether that column represents thousands of units or a few dozen.
Both chart types display these percentages as contiguous vertical blocks whose boundaries mark cumulative percentage thresholds. The first boundary sits at the first segment’s percentage, the second at the sum of the first two, and so on until the top reaches 100 percent. Because height communicates composition rather than magnitude, any two columns of equal vertical extent invite direct comparison of their internal percentage splits, and the stacking order determines where each threshold falls.
Visual Complexity
A reader can scan a row of stacked bars in a couple of seconds, compare overall magnitudes, and pick out the largest categories without conscious effort because every column shares the same width and only vertical variation carries meaning.
In a Marimekko chart, where column width, segment height, and rectangle area all encode values, the eye must continually re-calibrate as it moves across the chart. The instant scan that works for stacked bars gives way to a slower deciphering process in which the viewer registers widths, heights, and areas in sequence and mentally combines them. Novices often misjudge proportions on first viewing because rectangles of similar shape but different scale appear comparable until the axes and widths are read carefully.
This cognitive cost buys analytical depth, revealing relationships among market share, segment composition, and absolute volume simultaneously. The trade-off depends on audience and purpose: reports intended for quick executive review favor stacked bars, while exploratory analyses, segmentation studies, and strategy decks that reward close reading can justify the extra effort a Marimekko demands.
Market Share Analysis
In market share analysis, each column in a Mekko chart can represent a distinct product line or business unit scaled to total market size, while the stacked segments show the share held by individual competitors or sub-categories. For instance, a company may have a large overall footprint but a weak presence in a high-growth sub-segment; the Mekko chart makes such disparities visible by aligning segment size with share within that segment.
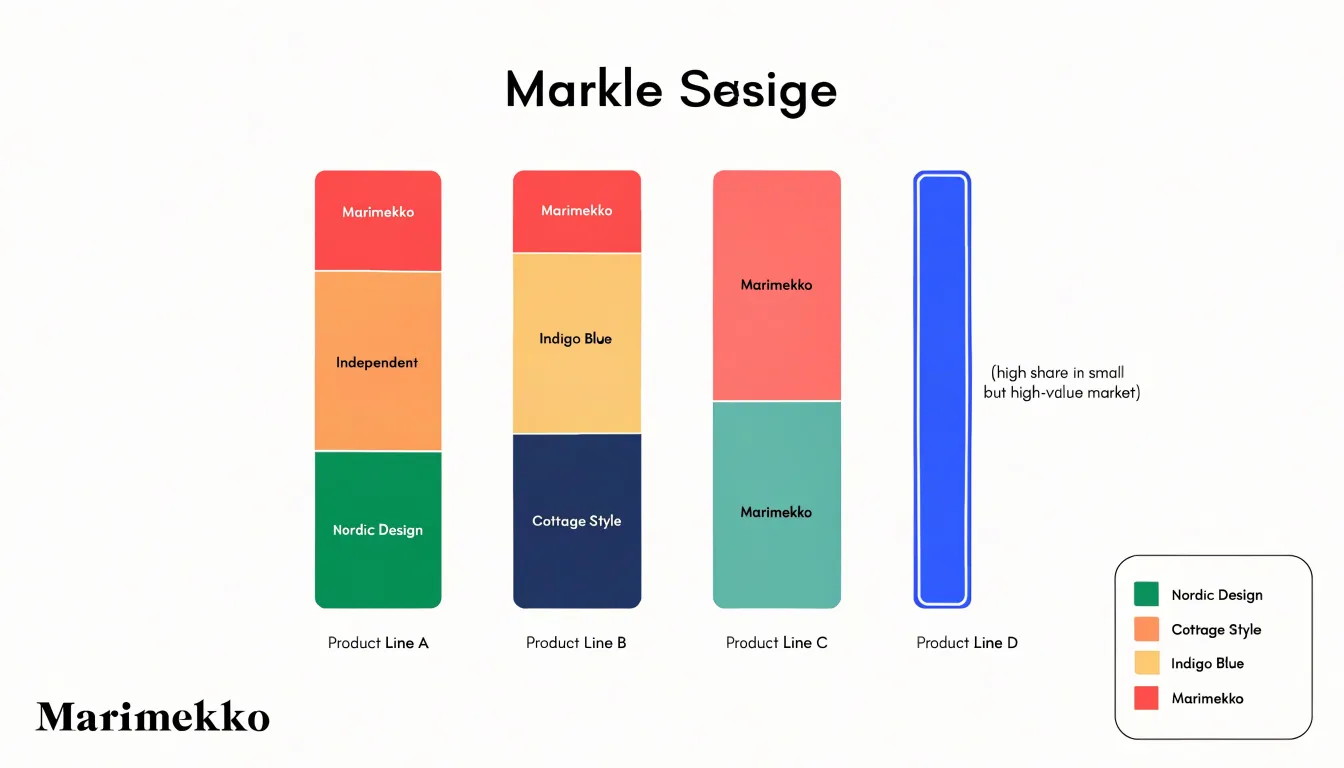
This supports practical decisions, such as prioritizing resource allocation toward underpenetrated but sizable sub-segments or identifying competitive threats in core areas. Normalizing for market size differences enables fair evaluation of sub-segment performance across varied product lines. Analysts can spot patterns like a competitor’s dominance in a niche but lucrative segment or a declining share in a mass-market category, informing product development, pricing, and market entry.
Sales Performance Tracking
Sales performance tracking benefits from the stacked bar chart’s uniform column widths when time periods are fixed and known in advance, such as fiscal quarters, months, or weeks. Consider a company monitoring quarterly sales across four regions over a two-year horizon. Each quarter occupies an identical slot on the horizontal axis, creating a dependable visual grid. The total height of each column shows overall revenue for that quarter, while the colored segments reveal how each region contributed. Perspective distortion never enters the picture, and readers can compare quarters directly without mentally adjusting for column size. Analysts reviewing a dashboard every Monday morning can scan the same layout week after week and spot a steadily growing region or a sudden shift in dominance immediately.
The same principle applies when tracking product-line sales across a fixed set of sales territories, where each territory receives one column of equal width per reporting period and the stack shows how the product mix shifts within it. Uniform widths also prevent visual overload in reports that carry many periods, since the columns remain narrow and orderly rather than expanding unpredictably.
Business Strategy
When strategists use Mekko charts to evaluate market segments or product lines by customer type or channel, the area patterns reveal where opportunity lives:
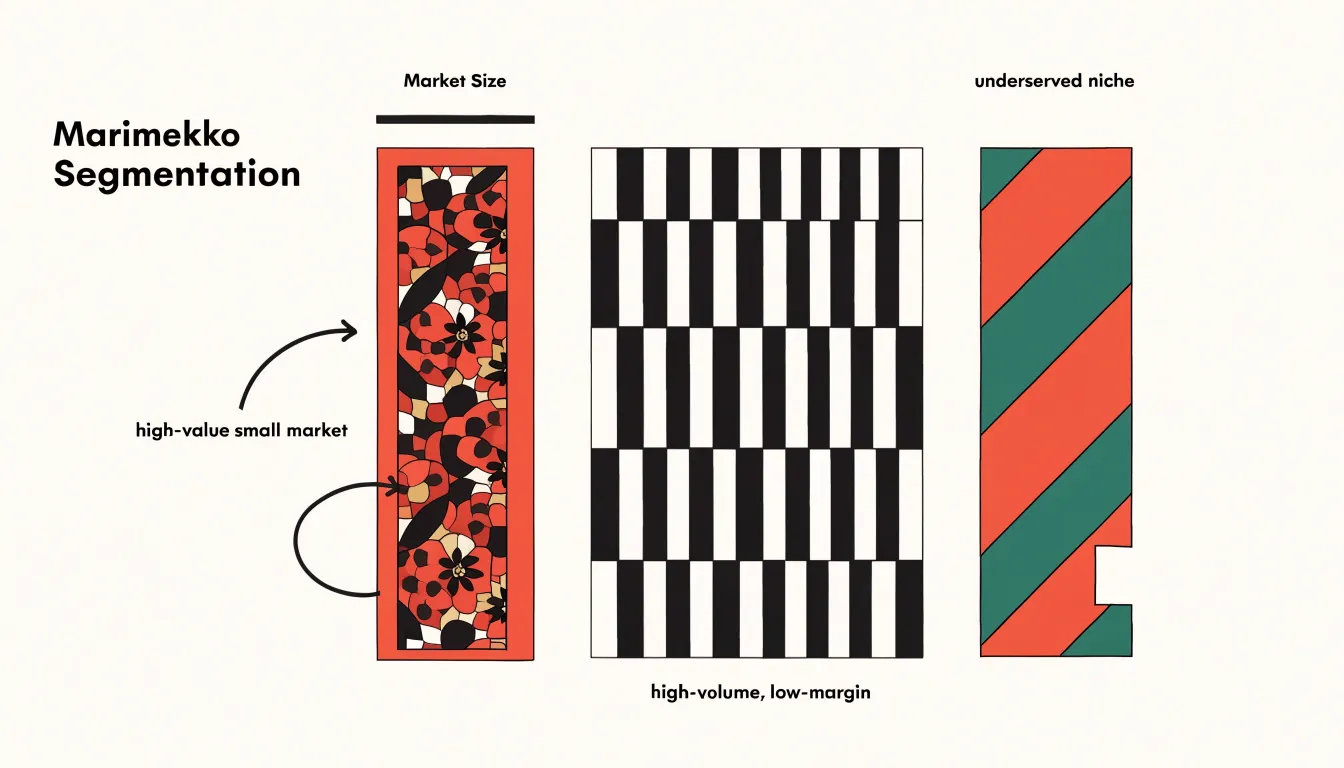
- Narrow column with a disproportionately tall substack: Signals a high-value small market delivering outsized returns relative to its footprint. Strategists can flag these segments for focused investment, since modest resource commitments may yield strong incremental gains.
- Wide column with thin internal divisions: Points to a high-volume, low-margin segment where growth requires scale rather than premium positioning.
- Imbalanced internal proportions: Exposes underserved niches, such as a large customer base paired with a thin share of higher-tier offerings, signaling unmet demand.
Planners can scan across segments and rank them by opportunity density rather than raw size alone, directing budget toward segments that combine a manageable footprint with strong internal yield. Strategists should use these visual patterns as a diagnostic first pass, then validate promising segments with detailed financial analysis before committing resources.
Data Preparation
Data preparation begins with a rectangular table where each row represents one category and each column holds a single measure:
- Structure the columns: Place the category label in the first column, followed by one column per segment. Keep raw counts in these segment columns rather than pre-computed percentages; deriving percentages after aggregation preserves accuracy and lets you recompute totals whenever the underlying data changes.
- Pivot long data if necessary: If source data arrives in long format (one row per category-segment combination), pivot the segment dimension into separate columns so each category occupies a single row.
- Compute row totals: Add a total column that sums every segment for each row to drive Marimekko column widths and stacked bar lengths. Verify this total against an independent source.
- Calculate and reconcile shares: Divide each segment value by the row total. Round these shares carefully, and reconcile rounding differences by adjusting the largest segment so that each row sums to exactly 100 percent. Use a quick pivot table or a
SUMIFcheck across categories to surface any row where shares drift away from the target total. - Validate the grand total and clean anomalies: Confirm the grand total for overall chart scaling. Ensure no segment contains negative values or blanks; coerce blanks to zero, and decide whether to exclude rows with negative values or restructure the data.
- Document the steps: Record the transformation steps in a separate preparation sheet so the chart can be rebuilt from raw inputs at any time.
Formatting Pitfalls
Marimekko charts and stacked bar charts are vulnerable to the same formatting mistakes:
- Over-labeling: Pasting a full category name and value inside a segment only a few pixels wide causes text to spill into neighboring regions and overlap other labels. Shrinking the font trades one readability problem for another. Instead, limit inline labels to segments large enough to hold them comfortably, and route the rest to a legend, a side table, or a hover callout in interactive versions.
- Angled text: Rotating labels to 45 or 90 degrees to fit narrow columns or thin bars slows reading, especially when the font is small. Shorten labels, move them outside the plot, or use horizontal text with leader lines.
- Excessive gridlines: Dense or heavy rules running across a Marimekko chart or between stacked segments fracture the shape of the bars and compete with the data. Restrict gridlines to a few light horizontal references, or remove them entirely in favor of direct value labels.
Color Choices
When a chart contains many segments, the palette must support quick discrimination between categories while preserving overall harmony:
- Sequential vs. categorical schemes: Use sequential palettes (progressing from light to dark in a single hue or narrow range of hues) when segments represent ordered values or intensities. Use categorical palettes (distinct hues) when segments are nominal and unordered. For categorical data, limit the number of hues to around seven to ten and choose colors that are evenly spaced in hue and consistently saturated.
- Contrast and accessibility: Ensure sufficient luminance contrast between neighboring colors and between text and background. Accessibility guidelines recommend a contrast ratio of at least 3:1 for graphical elements and 4.5:1 for text. Test palettes with color blindness simulators to avoid problematic pairings like red and green, and use redundant encoding—such as varying lightness in addition to hue—to aid viewers with color vision deficiencies.
- Visual hierarchy and consistency: Reserve the most saturated or contrasting colors for the most important segments, use muted tones for secondary ones, and keep color meanings consistent across charts in the same report.
Tool Compatibility
How a Marimekko chart gets built and maintained depends heavily on the analytics stack:
- Excel: Because Marimekko is not a native chart type, practitioners typically combine stacked column charts with secondary axis manipulation, adjusting gap widths and series overlap to simulate variable column widths. This works reliably for static reports and small datasets, but requires careful handling of axis scaling and label placement, and becomes cumbersome when categories or values change frequently.
- Power BI: The marketplace offers dedicated third-party Marimekko custom visuals that accept category, segment, and value fields directly, reducing build time and supporting cross-filtering and tooltips. However, custom visuals depend on third-party publishers for updates and may raise governance questions around certification and support. Alternatively, users can approximate the chart using stacked column visuals combined with DAX measures for width calculation, trading simplicity for manual effort.
- Tableau: While it lacks a native Marimekko type, Tableau’s calculated fields and dual-axis capabilities allow analysts to size bars proportionally to a total measure while stacking segments within them. This well-documented community technique produces polished, interactive results, though it demands familiarity with table calculations and axis synchronization.
Across all three platforms, teams should verify that the chosen approach scales with data volume, confirm that labels remain legible as segment counts grow, account for refresh behavior when underlying values shift, and weigh maintenance burden against visual fidelity.
Real World Examples
Organizations frequently deploy both chart types within the same dashboard environment to serve different roles. For example, at a mid-sized SaaS company building an executive dashboard, the finance department uses a Marimekko chart to present revenue composition across product lines and customer segments for board-level discussions. In the same dashboard, the product management team uses a stacked bar chart to track feature adoption by user tier across release sprints during weekly operational reviews.
Similarly, executives at a retail analytics firm scan a Marimekko panel first to grasp overall portfolio balance, then drop into stacked bar panels on adjacent tabs to interrogate specific category trends. Rather than competing, the two visuals reinforce each other by providing a macro view and a micro view of the same underlying data.
Decision Framework
To choose between a Marimekko chart and a stacked bar chart, work through three questions in order:
- What is the audience familiarity and available time? In a live presentation with limited explanation time or for a general audience, a stacked bar chart offers an easier entry point. For an analytical audience that will study the visualization closely, the Marimekko’s richer encoding rewards that attention.
- What is the data dimensionality? A stacked bar chart handles two dimensions: a category along the axis and a subcategory within each bar. If a third variable—such as market size—should influence each column’s visual weight, a stacked bar hides that information or forces it into a separate table, whereas a Marimekko encodes it directly through column width.
- What is the primary analytical goal? If the question is simply how a total breaks into parts, use a stacked bar chart. If the question requires comparing both internal composition and overall magnitude across groups simultaneously, use a Marimekko chart.
Document the answers to these three questions to establish a repeatable, defensible choice as project requirements evolve.
Summary Comparison
The differences between the two formats come down to visual density, dimensionality, and target use cases:
- Visual density: A Marimekko chart packs two quantitative dimensions into a dense, rectangle-based display, while a stacked bar keeps widths uniform for a lower cognitive load.
- Dimensionality: The Marimekko encodes both category size and internal splits automatically. A standard stacked bar focuses on composition within fixed categories, requiring the reader to read the axis or mentally sum segments to compare totals.
- Target use cases: Marimekko charts suit portfolio reviews, market share analyses, budget allocations, and printed reports for expert audiences. Stacked bars suit progress tracking, compositional change over time, and executive summaries. Stacked bars also handle many categories or small segments more gracefully, since uniform widths prevent thin columns from turning into illegible slivers.
Frequently Asked Questions
What is the difference between a Marimekko chart and a stacked bar chart?
A Marimekko chart uses variable column widths tied to a measure and segment heights that show each segment’s share of its own column, while a standard stacked bar chart uses fixed categories and uniform-width bars to show parts of a whole. The Marimekko encodes both category size and internal splits, while a stacked bar focuses on composition within fixed categories.
When should I use a Marimekko chart instead of a stacked bar chart?
Use a Marimekko chart when you need to compare both internal composition and overall magnitude across groups simultaneously, or when a third variable such as market size should influence each column’s visual weight. Use a stacked bar chart if the question is simply how a total breaks into parts, or for quick executive review and general audiences.
How do you read segment width and height in a Marimekko chart?
Column width is proportional to the sum of values in that column, so a column twice as wide represents twice the total magnitude. Segment height represents that segment’s share of its own column’s total, and every column reaches the same full height. Because varying widths make cross-column height comparisons difficult, use segment area as the primary cue for absolute comparisons.
What is a stacked bar chart best used for?
A stacked bar chart is well suited to straightforward categorical comparisons across a few fixed categories, such as regions or product lines. It is also useful for sales performance tracking when time periods are fixed and known in advance, like fiscal quarters or months.
How do I prepare data for a Marimekko chart or stacked bar chart?
Start with a rectangular table where each row is a category and each segment column holds raw counts rather than pre-computed percentages. Add a row total, calculate shares by dividing each segment by the row total, and reconcile rounding so each row sums to exactly 100 percent. Validate the grand total, ensure no segment contains negative values or blanks, and document the transformation steps.
What formatting mistakes should I avoid in Marimekko and stacked bar charts?
Avoid over-labeling tiny segments, rotating labels to 45 or 90 degrees, and using dense or heavy gridlines. Limit inline labels to segments large enough to hold them, route the rest to a legend, side table, or hover callout, shorten labels or move them outside the plot, and restrict gridlines to a few light horizontal references or remove them.
Tony Astor
Tony writes about data visualization and the tools people use to build charts and dashboards. More about Data Illustrator