Marimekko Chart: How to Read a Mekko Chart
 By Tony Astor ·

Marimekko Chart
A Marimekko (Mekko) chart is a variable-width stacked bar chart that shows two dimensions at once: each column’s width is proportional to a category’s total size, while stacked segment heights show each sub-group’s share, so segment area encodes its absolute contribution. Use it to compare group totals and internal composition simultaneously.
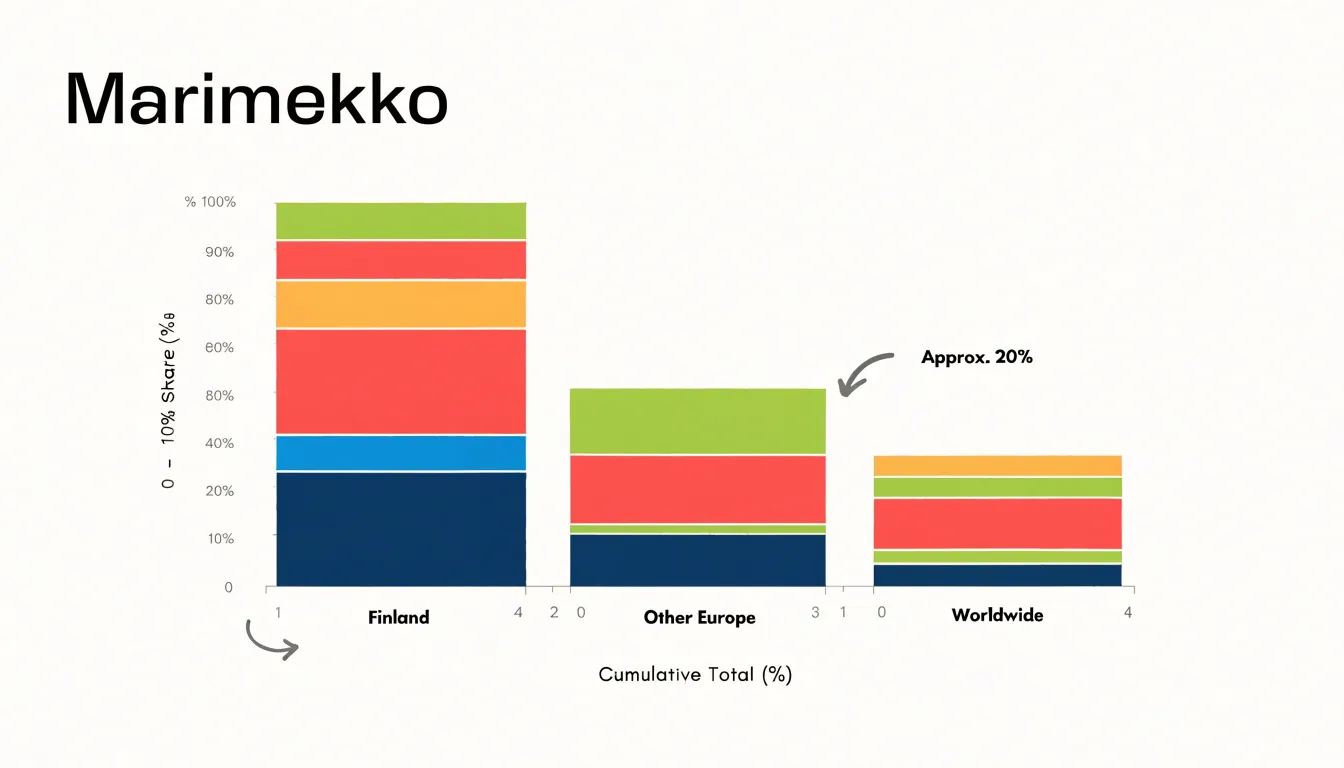
Table of Contents
Chart Type
A Marimekko chart (often called a Mekko chart) is a variable-width stacked bar chart that displays two dimensions of quantitative information at once. Each column represents a category, such as a market, region, or product line. The width of each column is proportional to that category’s total size relative to the whole, so a column representing 40 percent of the total is twice as wide as one representing 20 percent. Within each column, stacked segments divide the category into its component parts. The height of each segment is scaled so that the segment’s area reflects its share of the overall total, letting viewers compare segment proportions both within a single column and across columns.
The mechanism relies on area rather than length alone. Because both the width and height of each rectangle vary, the area of a segment encodes its absolute contribution to the grand total. This makes the chart useful for questions involving two levels of comparison: how large each group is overall, and how that group splits into sub-groups. For example, a retailer could show sales by region as column widths and product category shares as stacked segments, revealing at a glance which regions dominate total revenue and which categories drive each region.
Column widths communicate group totals along the horizontal direction, while segment heights communicate composition along the vertical direction. Percentages along the vertical axis are typically normalized per column or against the overall total, depending on the design. The trade-off is that the chart demands careful reading, since neither dimension can be judged in isolation.
Chart Type
A standard stacked bar chart treats every category as an equal citizen: each column occupies the same horizontal slot regardless of how much volume that category represents. This uniformity keeps the eye focused on the internal composition of each bar, assuming the categories themselves are of comparable weight or that their relative size is not the question being asked.
By letting column widths vary by a separate metric—typically total volume, revenue, or market size—a Mekko chart changes what the visual communicates. In a uniform stacked bar, a reader compares segment heights across columns and mentally holds the columns as equivalent. In a Mekko chart, a category that dominates the underlying total claims a wide slice of the horizontal axis, while a minor category narrows to a sliver. Two markets with identical percentage splits look very different if one is three times the size of the other, and the varying widths make that disparity visible without a second chart or an accompanying table.
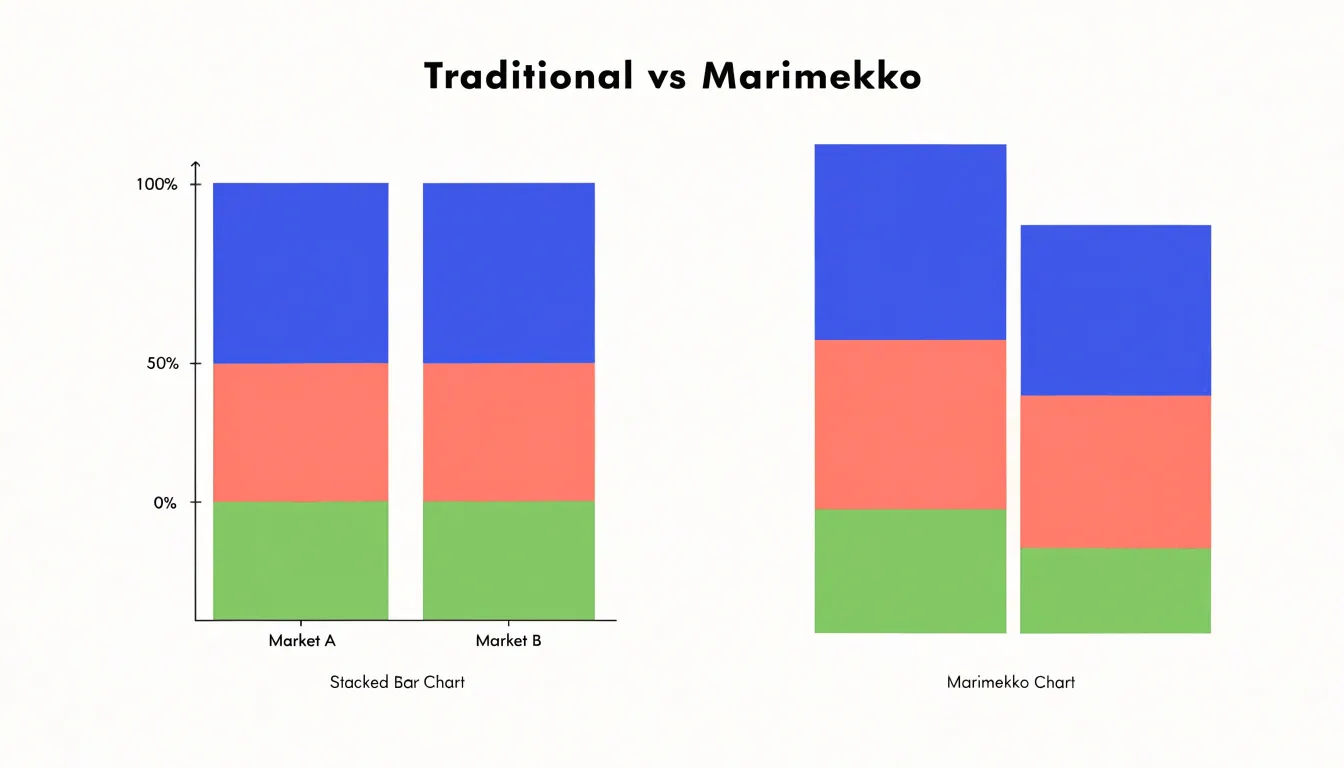
The trade-off is legibility. Narrow columns can make segment labels cramped, and small percentage differences become hard to read when the total column is compressed. Uniform bars favor clarity of composition; variable-width bars favor clarity of scale. Choosing between them depends on whether the audience needs to compare internal shares alone or to see those shares in the context of unequal totals.
Chart Type
Reading a Marimekko chart starts with sweeping across the chart horizontally to compare how much space each category occupies. A category that takes up a third of the chart’s width is roughly three times the total size of one that takes up a ninth, regardless of how tall its individual blocks appear.
Once column widths are established, attention shifts to the vertical dimension. A segment that fills most of a column’s height accounts for a large share of that category’s total, while a thin sliver represents a small share. Because each column is scaled to its own total, a tall block in a narrow column may still represent a smaller absolute quantity than a shorter block in a wide column. Reading heights therefore requires keeping the column’s overall width in mind and treating height as a percentage of that particular column rather than as an absolute value comparable across the chart.
Viewers can trace a single subcategory across all columns to compare its relative share within each category, or they can scan the full column to judge the balance of subcategories inside one group. Practiced readers move fluidly between these two scales, using width to anchor absolute size and height to reveal proportional structure.
Chart Type
The X-axis tracks the cumulative totals of a quantitative measure such as revenue, market size, or population. Reading from left to right, the X-axis effectively builds a running sum: the boundary between one column and the next marks the point where the cumulative total reaches that segment’s contribution. This makes the axis a continuous scale of aggregation rather than a simple list of categories.
On the Y-axis, the vertical space within each column is divided among subcategories, expressed as normalized percentages that together sum to 100 percent for that column. A column reaching the full height of the chart shows a category that accounts for the entire vertical allocation, while shorter internal segments represent smaller proportions. Because each column is normalized independently, the Y-axis supports comparison of internal composition across columns even when the columns themselves differ dramatically in total size. Equal vertical heights across columns do not imply equal absolute values; the vertical axis always describes relative share, while the horizontal axis carries the absolute scale.
Chart Type
A Marimekko chart’s grid of variable-width columns and stacked segments helps surface three specific patterns:
- High-value clusters: Scan for the largest rectangles, which represent combinations of a broad category and a substantial sub-category share. A tall block within a wide column signals a dominant position on both dimensions, pointing to areas of concentrated value that consistently attract resources or demand.
- Dominant market segments: Wide columns anchor the chart. A wide column with a single large segment suggests a concentrated market, whereas a wide column with many small segments indicates fragmentation. Following the widest columns from left to right traces how market leadership shifts across categories and identifies segments that maintain a strong presence regardless of category size.
- Outlier sub-categories: Look for rectangles that break the visual rhythm. A narrow column with an unusually tall segment may represent a niche category where one sub-category dominates disproportionately. Conversely, a wide column with a tiny segment highlights a sub-category that is underrepresented relative to the category’s overall size. These anomalies often signal emerging opportunities, unmet demand, or structural inefficiencies.
Chart Type
Color introduces a third layer of meaning to a Marimekko chart, typically distinguishing sub-groups within each column. Because the viewer is already tracking column widths and segment heights, a consistent palette across categories lowers the interpretive burden. When the same hue always represents the same sub-group from the first column to the last, readers build a mental mapping once and reuse it throughout the chart. Reusing colors deliberately—for example, assigning one shade family to a product line and varying lightness across its sub-groups—lets the eye group and compare without conscious effort. Inconsistent or arbitrarily rotated palettes force readers to re-decode the legend at every column, which fragments attention and slows comparison.
Each legend entry should map unambiguously to exactly one visible sub-group, with labels placed in the same order the colors appear and using wording that matches the surrounding text. Where possible, label segments directly inside large blocks and reserve the legend for smaller ones, so the legend does not become a lookup table consulted for every mark. Ordering legend entries by a meaningful sequence, such as descending total size, helps readers anchor the most important categories first.
Color choices should also remain distinguishable for viewers with color vision deficiencies; varying lightness alongside hue keeps segments separable in grayscale or under simulated deficiencies. Limiting the palette to a manageable number of hues, roughly five to seven, prevents the chart from turning into a patchwork.
Chart Type
In market share analysis, a Mekko chart displays the total size of a market segment or geographic region through column width and the division among competing players through stacked bar heights. This allows a strategist to see which segments are large enough to matter and which companies dominate them.
For example, a firm evaluating expansion opportunities across several regions can compare overall revenue potential while simultaneously observing competitive concentration. A wide column with many thin slices signals a fragmented market where share gains may be achievable, whereas a wide column with two or three thick slices indicates entrenched incumbents. This view supports decisions about where to allocate resources, which competitors to benchmark against in each territory, and where consolidation or partnership might yield the greatest return.
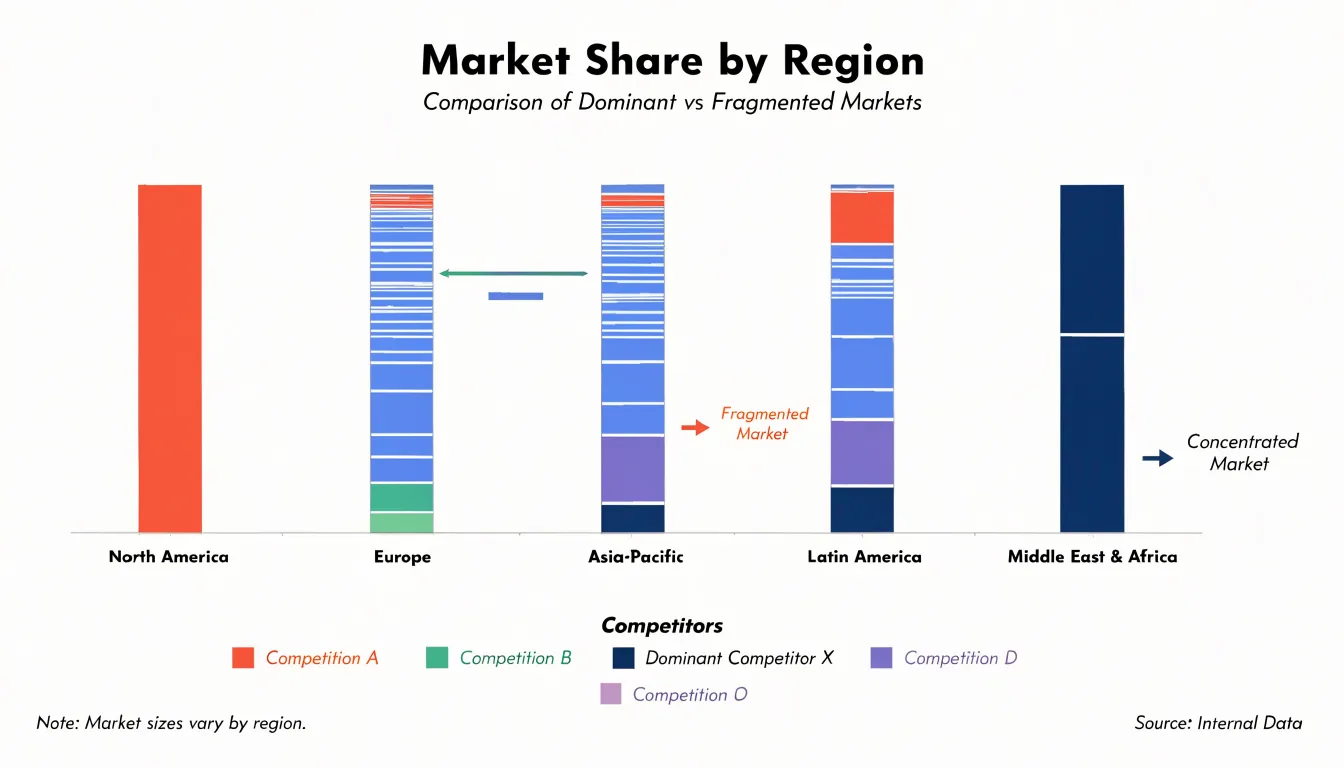
Because the chart normalizes each column to full height, comparisons of relative share remain visually consistent even when segment sizes differ dramatically, preventing large markets from visually overwhelming small but strategically important ones. Analysts can also group columns by geography and stack competitors within each group, revealing patterns such as a rival that dominates one region but holds marginal presence elsewhere.
Chart Type
Suppose a retail company sells four product categories—apparel, electronics, home goods, and groceries—across three regions: North, South, and West. Constructing the chart follows a clear sequence:
- Assemble the raw figures into a tidy table: Cross-tabulate revenue values by category and region.
- Calculate regional and grand totals: Divide each region’s total revenue by the grand total across all regions to produce the column width percentages. If the North region accounts for 40 percent of overall revenue, its column occupies 40 percent of the chart’s horizontal span, while the South and West columns split the remainder according to their own shares.
- Compute each category’s share within its region: Within the North column, apparel might represent half of regional revenue, electronics a quarter, and the remaining categories smaller slices. Multiply these within-region percentages by the column height, so the stacked segments in each column add up to 100 percent of that column’s area.
- Plot the bars: Draw adjacent vertical bars whose widths vary by region and whose internal segments vary by category, using consistent color coding for each category across all columns.
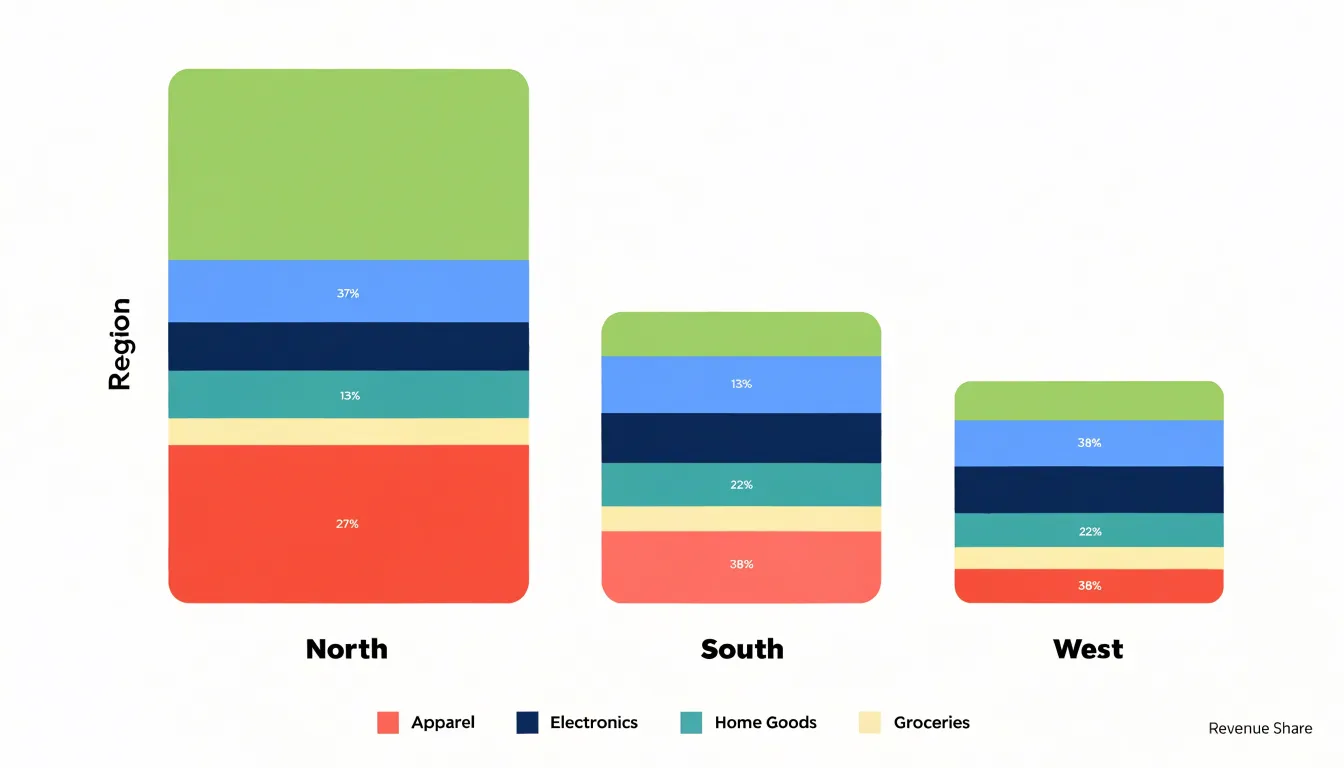
By reading both dimensions together, analysts can spot where a large region underweights a high-margin category, or where a narrow region punches above its weight in a particular segment. This exposes the joint distribution of two variables to guide inventory allocation, regional marketing spend, and category expansion.
Chart Type
The scale of each axis must be handled with care to preserve the integrity of the visual representation. A common pitfall is truncating an axis so that it does not start at zero. Setting the vertical axis to begin at 20% rather than 0% makes small differences between categories appear disproportionately large. Because Marimekko charts encode data through both width and height, any truncation distorts the area of each segment, leading viewers to overestimate the importance of certain categories or miss meaningful similarities.
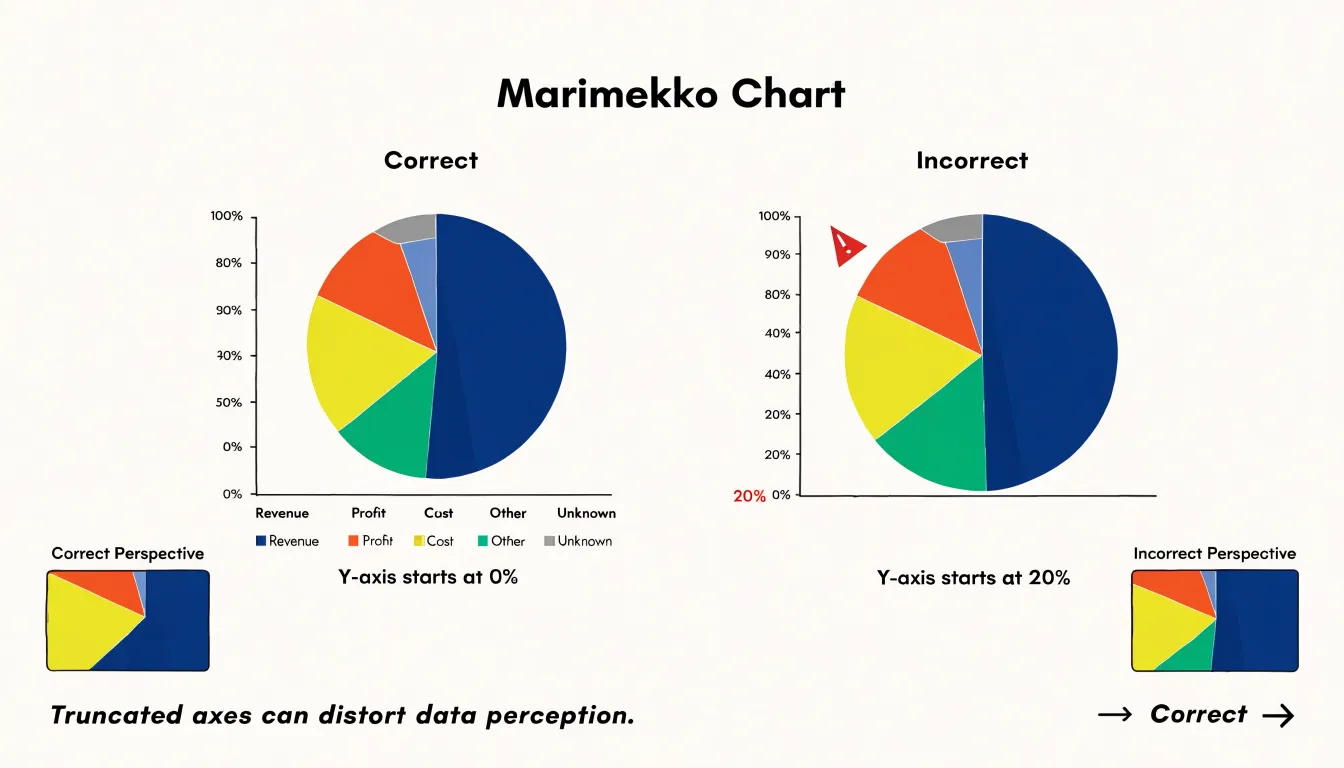
Another frequent mistake is applying uneven scaling across segments, which occurs when column widths are not proportional to their total values or when heights within columns are not consistently scaled. When areas no longer correspond to the underlying numbers, business conclusions—such as identifying the largest market segment or the fastest-growing product line—become unreliable, and decision-makers may allocate resources to the wrong areas.
To avoid these issues, always ensure that both axes start at zero and that all segments are scaled proportionally. Verify that the total width of each column reflects its aggregate value and that the height of each sub-segment is calculated relative to a common baseline.
Chart Type
Standard bar charts work well when a single categorical dimension carries the comparison, such as revenue by product line or headcount by department. Once a second meaningful dimension enters the picture, the flat bar chart forces analysts into awkward workarounds like a small multiple: a grid of separate bar charts, one per segment, each with its own axis. This arrangement fragments the reader’s attention and makes cross-segment comparison laborious, because every panel must be scanned and mentally rescaled before any pattern emerges.
Consider a company tracking product performance across several regions with different total revenue bases and product shares. A set of standard bar charts would show share by region but obscure how much each region contributes to the overall business, while a standard stacked bar chart would show totals or shares alone without combining both scales. A Mekko chart displays regional market size and product share simultaneously, replacing a cluttered wall of separate bar charts in competitive benchmarking, budget allocation reviews, and customer segmentation studies.
Chart Type
For analysts who work with Mekko charts regularly, the dual proportional encoding quickly becomes second nature. For a general business audience encountering one for the first time, the experience is often confusion rather than insight.
Non-technical audiences typically bring expectations shaped by standard bar charts and pie charts, where a single dimension carries the message. When confronted with a Mekko chart, viewers often misread the varying column widths as an aesthetic choice rather than a data encoding, or they compare segment heights directly across columns of different widths, drawing conclusions the chart does not support. Questions about what the widths mean can consume meeting time that was meant for discussing the findings themselves.
Weigh visual complexity against the depth of information the audience actually needs. When the goal is a quick directional read, a simple stacked bar or a small table will usually communicate faster and with fewer errors. Mekko charts earn their place when the relationship between market size and share is the central point of the analysis and the audience has either prior exposure or a guided walkthrough. Even then, a brief orientation to how the chart works pays dividends. Where the audience is mixed or unfamiliar with the format, moving the Mekko chart to an appendix and leading with a simpler visual keeps the conversation focused on decisions rather than decoding.
Chart Type
A clean Marimekko chart depends on disciplined design choices that keep the grid legible:
- Label placement: Short labels fit comfortably inside wider segments, while narrow segments should carry abbreviated labels or reference numbers keyed to a legend placed outside the plotting area. Keep in-cell labels horizontal and centered within each block so the eye can scan columns and rows without reorienting. Where values repeat across segments, omit redundant labels and let a single axis or legend carry the information.
- White space: Thin padding between cells clarifies boundaries without requiring heavy borders. Consistent internal margins give each block breathing room, and a slightly larger gap between major groups signals the categorical hierarchy. Leave generous margins around the grid to prevent the chart from feeling cramped and to make room for axis labels and legends.
- Logical sorting: Order columns by total size, and rows by a consistent secondary criterion, to make patterns of over- and under-representation visible at a glance. Apply the chosen ordering consistently across the whole chart.
- Clutter reduction: Use thin, low-contrast gridlines and soft background fills to communicate structure without competing with the data. Avoid drop shadows, gradients, heavy borders, and three-dimensional effects, which add visual weight that obscures proportional relationships. Keep typography modest in size and weight, with one clear label for each axis.
Chart Type
Support for building a Mekko chart varies widely across platforms:
- Native Excel: Because the Marimekko chart is not a built-in chart type, it must be constructed manually. Prepare a data table with cumulative column widths on the X-axis, convert each series into stacked column segments, and adjust the gap width to zero so that columns sit flush against one another. To automate the scaling with formulas, compute each category’s share of the grand total, place these values as spacer series, and use a stacked area or stacked column approach to simulate the variable-width columns before finalizing labels and axis adjustments.
- Excel add-ins: Several third-party add-ins include Mekko chart templates that handle the cumulative calculations automatically, letting analysts drop in raw data and adjust formatting through a task pane. These tools reduce errors and make it easier to update charts as data changes.
- Tableau: Tableau does not offer a native Marimekko type, but analysts can build one using a combination of calculated fields for running totals, a stacked bar or area mark, and axis sizing tricks.
- Power BI: Power BI requires a custom visual from its marketplace or a workaround using stacked column charts with calculated width measures. Documenting platform-specific steps helps teams reproduce the chart consistently across reports.
Chart Type
Establishing a repeatable reading sequence keeps multi-axis comparisons accurate and reduces the risk of drawing conclusions from visual impressions alone:
- Start with the horizontal axis: Identify what the X-axis represents and how its primary categories are ordered.
- Examine the vertical axis: Confirm the Y-axis range early—usually a percentage or proportion scale running from 0 to 100 percent—to prevent misreading column heights as absolute quantities.
- Compare column widths: Scan widths against neighboring columns to see which categories dominate the overall dataset, keeping in mind that a tall block in a narrow column may represent a smaller share of the grand total than intuition suggests.
- Track color fills across columns: Follow a single color from left to right to see how that subcategory’s share shifts between categories.
Chart Type
Hands-on practice with sample datasets and guided exercises helps learners apply Marimekko concepts to practical scenarios. Guided exercises that pair step-by-step chart construction with analytical prompts train users to spot trends, compare segments, and recognize when a Marimekko chart is the appropriate choice over other formats. Working with real-world data also exposes analysts to practical complexities like missing values or uneven categories, building the adaptability needed to use the chart effectively in their own work.
Frequently Asked Questions
What is a Marimekko chart?
A Marimekko chart, also called a Mekko chart, is a variable-width stacked bar chart that displays two dimensions of quantitative information at once. Column width is proportional to each category’s total size, and stacked segment area reflects its share of the overall total.
How is a Marimekko chart different from a standard stacked bar chart?
A standard stacked bar chart gives every category the same width, while a Mekko chart varies column widths by a separate metric such as total volume, revenue, or market size. This makes unequal category sizes visible, but narrow columns can make labels cramped and small differences harder to read.
How do you read a Marimekko chart?
Start by sweeping horizontally across the chart to compare column widths and see which categories dominate the overall dataset. Then examine the vertical segments within each column, keeping in mind that height represents relative share within that column rather than an absolute value comparable across columns of different widths.
What do the X-axis and Y-axis represent in a Marimekko chart?
The X-axis tracks cumulative totals of a quantitative measure and builds a running sum from left to right. The Y-axis divides each column into subcategories expressed as normalized percentages that sum to 100 percent for that column.
What are common mistakes to avoid when making a Marimekko chart?
A common pitfall is truncating an axis so it does not start at zero, and another is applying uneven scaling across segments. Both axes should start at zero, and all segments should be scaled proportionally so areas correspond to the underlying numbers.
Can you make a Marimekko chart in Excel?
Native Excel does not include the Marimekko chart as a built-in chart type, so it must be constructed manually. Several third-party Excel add-ins include Mekko chart templates that handle the cumulative calculations automatically.
Tony Astor
Tony writes about data visualization and the tools people use to build charts and dashboards. More about Data Illustrator