Lollipop Chart vs Bar Chart: Which Is Cleaner?
 By Tony Astor ·
Lollipop Chart vs Bar Chart
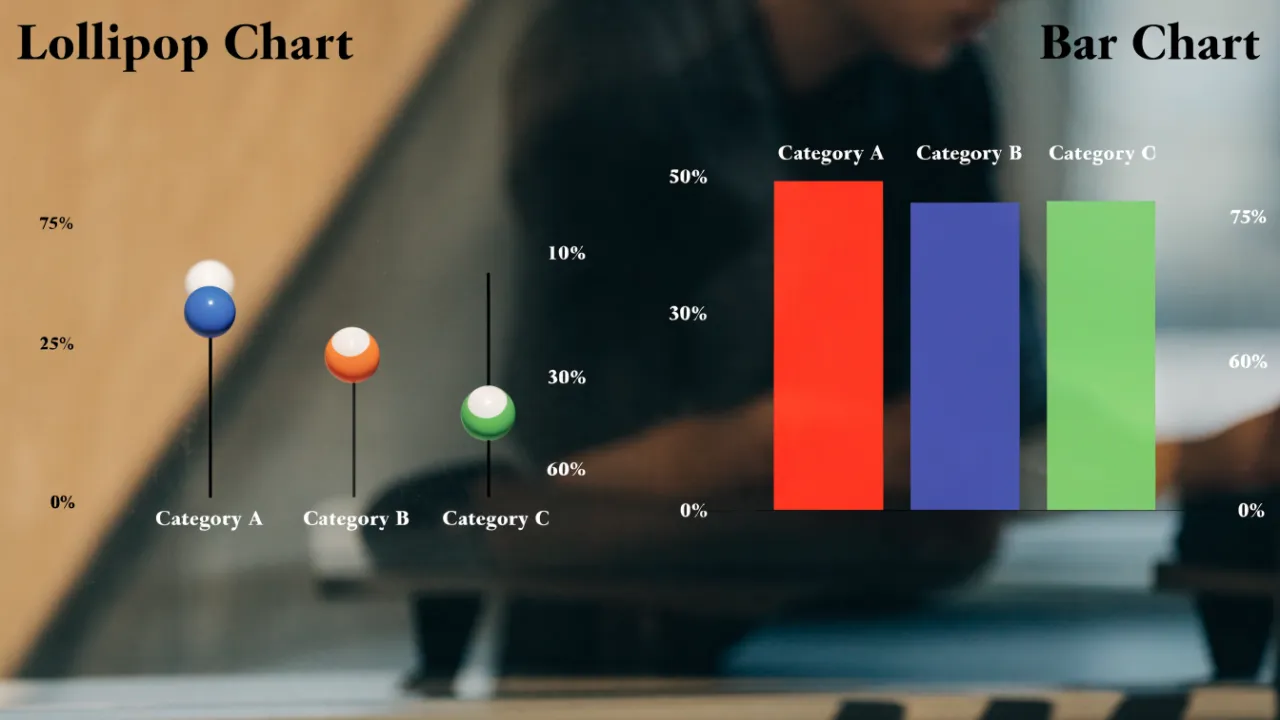
A lollipop chart replaces a bar’s solid fill with a thin stem topped by a dot, cutting visual clutter while encoding values just as precisely. Bar charts suit fast, familiar comparisons for general audiences; lollipop charts excel at rankings, dense dashboards, and many categories, where less ink means more white space and easier scanning.
Table of Contents
Bar Chart
The standard bar chart represents each category with a solid rectangle whose length or height encodes the data value, making the chart immediately readable to most audiences. A viewer’s eye travels to the end of each bar, compares it against the axis or neighboring bars, and gauges relative magnitude with very little effort. The filled bar occupies the space between the baseline and the data point, so the quantity appears as a tangible block of area rather than an abstraction. This direct physical mapping is one reason bar charts remain the default choice for comparing values across categories in reports, dashboards, and presentations.
The continuous fill also gives each bar a strong visual boundary, which helps when many categories sit side by side. However, that same mass of color carries visual weight that can dominate a composition. When several bars use heavy or saturated fill colors, the chart can feel dense and crowded, and the volume of ink draws attention to the area of the bars rather than to the values their endpoints describe. On a page with multiple charts, a large filled bar chart can pull focus away from surrounding content and unbalance the layout. Designers often lighten fill colors, add transparency, or streamline the chart framework to manage this effect. The trade-off sits at the heart of the format: the solid bar delivers unmatched clarity for reading values, while its filled body consumes a substantial share of the visual field.
Lollipop Chart
A lollipop chart replaces the solid bar with a thin stem topped by a dot, creating a minimalist visual that reduces cognitive load while retaining precise categorical value tracking. Where a bar chart asks the eye to scan a filled area, the lollipop’s dot serves as a clear focal point and the thin line simply connects it to the baseline. This directs attention to the endpoint—the actual value—rather than the area.
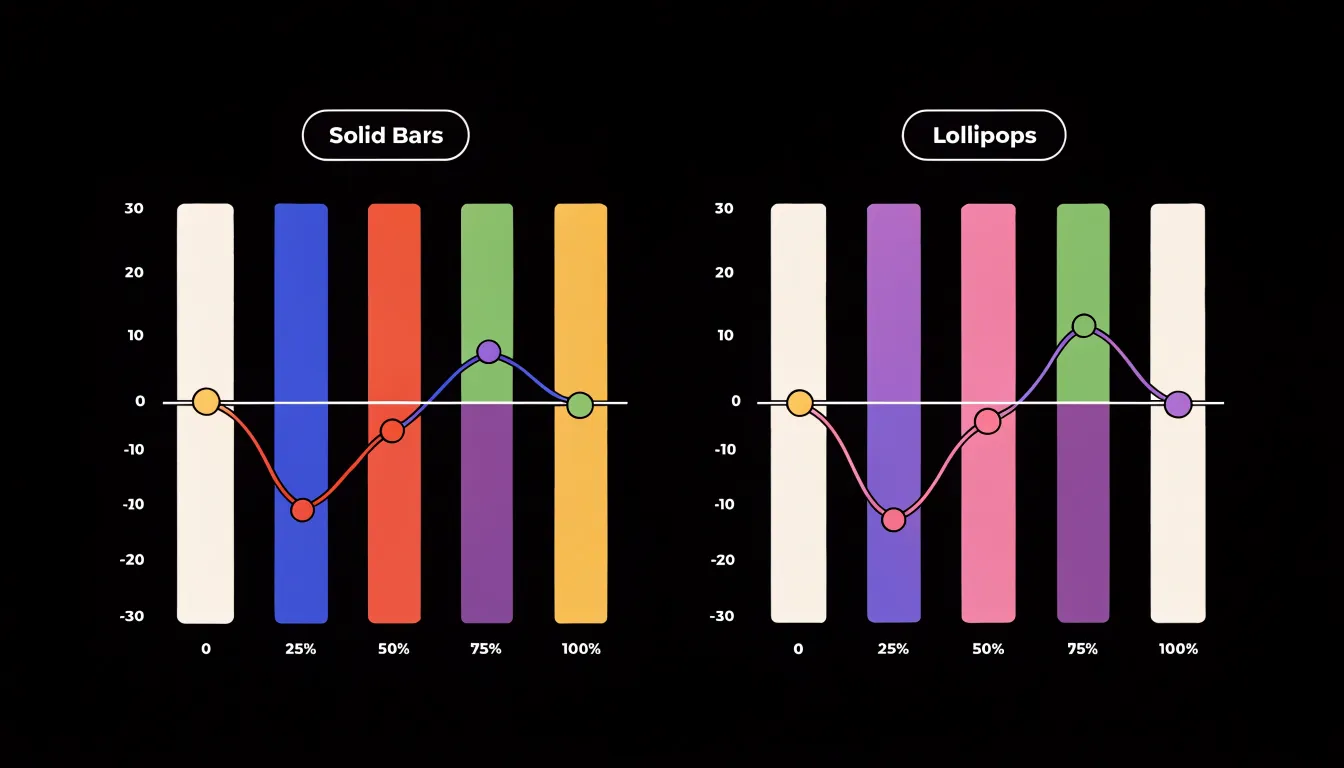
The reduction in ink leaves generous white space between stems, allowing the eye to move smoothly from one category to the next without the interruption of heavy bars. This makes the format especially useful when many categories are displayed or when the chart is part of a dense dashboard. The thin stems also reduce the risk of visual occlusion when values are close together, where thick bars can crowd one another and obscure small differences.
Despite its minimalist appearance, a lollipop chart preserves categorical ordering and precise value representation. The position of the dot on the axis encodes the value just as accurately as the end of a bar, and because the dot is a small, distinct shape, it can be labeled or highlighted with ease. This makes lollipop charts particularly effective for emphasizing specific data points or showing rankings.
Visual Clutter
Visual clutter typically accumulates gradually as charts are built, refined, and decorated. Heavy background elements such as shaded plot areas, thick gridlines, and prominent borders compete with the data for the viewer’s attention. When a chart’s frame is darker or heavier than the marks it contains, the eye is drawn toward the container rather than the content.
Common techniques for reducing clutter include:
- Lighten or remove gridlines, or replace them with subtle reference lines only where readers need orientation.
- Drop chart borders and background fills, letting the data sit directly on the page.
- Avoid gradients, textures, and heavy color blocks on bars and other shapes, which add visual mass without adding information.
- Consolidate redundant labels, such as labels placed inside bars that duplicate information already shown on an axis.
- Remove unnecessary tick marks, trim axis lines to the range of the data, and eliminate legends when direct labeling is possible.
Each reduction lowers the effort required to parse the chart and allows patterns, comparisons, and outliers to emerge more readily. Every graphical element should earn its place by carrying meaning.
Data Ink Ratio
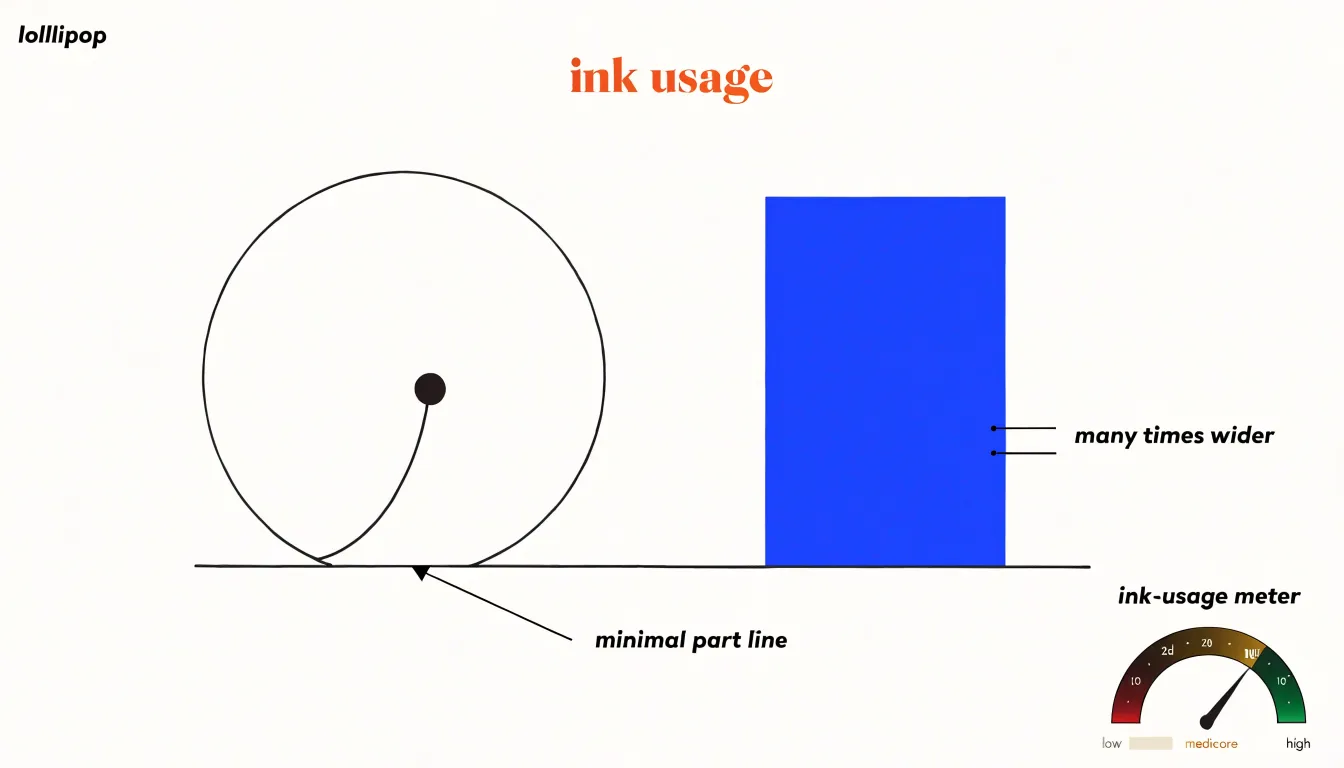
Edward Tufte’s concept of the data-ink ratio rests on a simple accounting: every drop of ink on a chart should carry information, and the proportion of ink devoted to actual data ought to approach one. In practice, this means treating chart elements as a budget that the designer spends deliberately. Gridlines, tick marks, borders, background fills, and decorative gradients all consume that budget without adding data. A lollipop chart illustrates the principle economically: a thin line from baseline to marker and a small circle at the value point convey both position and magnitude, while a filled bar of the same value uses many times the ink for the same message.
Stripping a chart to its essential marks sharpens comprehension because the reader’s visual system no longer has to separate signal from decoration. Tufte extended this logic to what he called chartjunk—the moiré patterns, heavy frames, and ornamental flourishes that distract without informing. Modern charting libraries offer explicit controls for lightening axes, dropping backgrounds, and shrinking markers while keeping labels legible. The discipline pays off most clearly in dense displays where many series share a single frame, since each redundant element multiplies across the chart, and it produces visuals that scale better to small screens.
Reading Categorical Values
When a chart encodes categorical values, the geometry of the mark shapes how the reader scans for differences. With solid bars, the eye is drawn to the flat top edge—a horizontal boundary that spans the full width of the bar. The eye can lock onto this edge and slide laterally from one bar to the next, comparing heights along a shared horizontal line. The filled area below reinforces the edge’s position, so the tallest and shortest bars announce themselves at a glance.
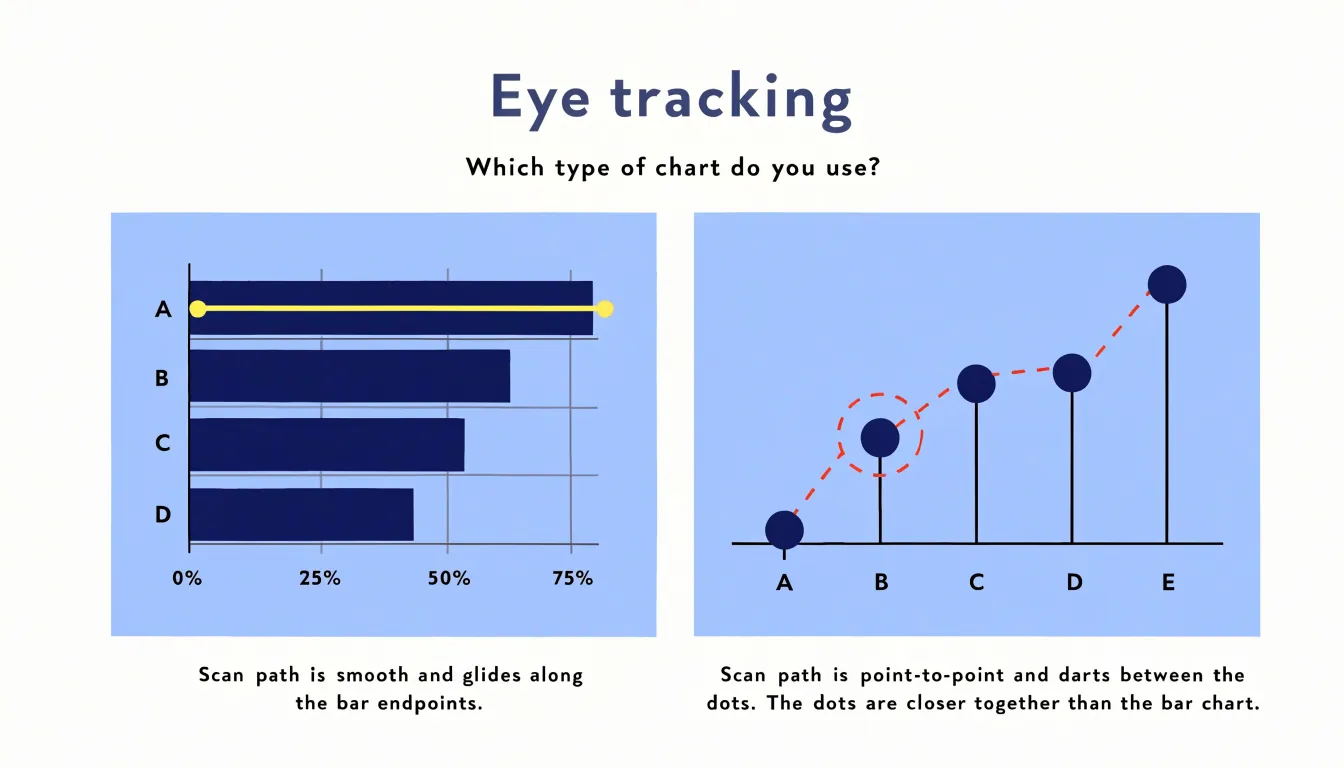
A lollipop chart replaces that wide edge with a small centered dot. Instead of tracking a boundary, the viewer fixes on a point and jumps to the next point, using the stems as guide rails down to the baseline. This point-to-point scanning can feel more precise when values are close together, since two neighboring dots are easier to separate than two adjacent bar edges. The trade-off is that a dot carries less visual weight, so very small differences may require a second look.
Practical scanning strategies follow from these mechanics:
- Sort categories by value so the progression reads as a single ascending or descending sweep.
- Keep a consistent baseline so stems and bar edges share a common reference.
- Group related categories with spacing or subtle dividers, letting the eye reset between clusters.
When the story is about overall magnitude, the solid bar edge rewards a fast horizontal pass. When the story is about precise differences among many categories, the centered dot keeps attention on the exact value.
Large Data Sets
Large data sets place unique demands on dashboard design, particularly when a comparison involves hundreds of product lines, regions, or campaign segments. If every category receives equal visual weight, the view quickly becomes unreadable. The underlying principle for managing this scale is progressive disclosure: show the shape of the data first, then reveal detail as users move deeper.
Several techniques keep large categorical views navigable:
- Rank and filter: Display only the top and bottom performers in the primary chart, folding the remainder into an aggregate group or a secondary detail view.
- Sort by value rather than alphabetically, turning a dense chart into a scannable ranking.
- Use interactive filters, drill-downs, and tooltips to carry granular detail on demand while keeping the default view summarized.
- Segment into small multiples or grouped panels, each containing a manageable number of categories.
- Abbreviate or thoughtfully rotate lengthy labels to prevent overlap and preserve legibility.
Highlighting Key Metrics
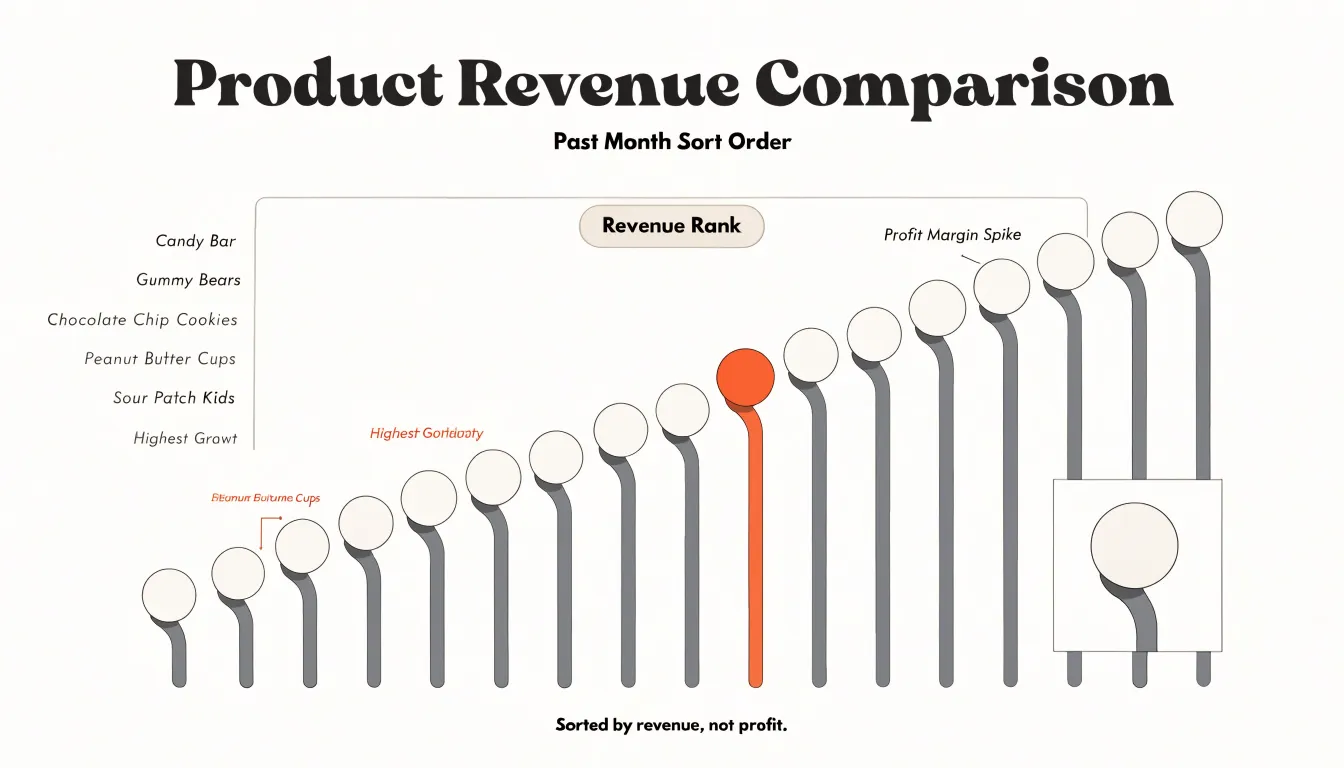
Selective color accenting gives a chart a built-in hierarchy, letting the author decide which values deserve attention before the reader starts scanning. In a lollipop chart, this is often as simple as rendering most stems and dots in a muted gray or desaturated blue, then switching a handful of dots to a saturated accent such as orange or red. A bar chart follows the same logic: fill the important bars with the accent color and fade the rest into a neutral tone.
The value of this technique lies in what it removes. Dense palettes ask the reader to decode a legend and hold several colors in working memory at once. A single accent within a field of neutrals eliminates that load, which matters most on dashboards where readers may glance at each chart for only a few seconds. Accent color also persists in memory: a reader recalling the chart a day later is more likely to remember the highlighted figure than the gray backdrop.
Good practice keeps accents scarce and meaningful. One or two highlighted data points per chart is usually enough; a bar chart where half the bars are colored has no focal point. The accent color should stay consistent across a report so readers associate it with the target metric, and a brief annotation attached to the colored mark can state the takeaway directly in words.
Space Efficiency
Space efficiency becomes a decisive factor when a report must carry a large amount of information within a constrained layout. Because lollipop stems occupy only a small fraction of the horizontal area consumed by solid bars, dozens of categories can coexist in a compact panel without introducing heavy blocks of color.
This allows designers to tighten margins around the chart, reduce the overall canvas size, or place several small lollipop panels side by side within a dashboard while preserving legibility. The open space between stems also supports annotation: labels, callouts, and reference lines can sit alongside the marks without colliding with thick filled shapes. Rather than forcing readers to disentangle cramped elements, the open layout lets outliers stand apart and clusters read clearly as clusters.
Design Pitfalls
Certain design errors can undermine the accuracy and readability of both bar and lollipop charts:
- Oversized dots: In a lollipop chart, the dot should be proportional to the stem and layout. If dots are too large, they obscure the stems and make it difficult to compare closely spaced values, especially if the visual center of the circle becomes harder to pinpoint against the axis.
- Truncated baselines: Starting the value axis at a number other than zero exaggerates differences between categories, making small variations appear large. While truncation is sometimes justified for line charts showing narrow trends, it is misleading for bar and lollipop charts, which rely on length from a zero baseline to encode value.
- Misaligned axes: If gridlines, tick marks, or labels do not correspond precisely to the data points due to scaling or placement errors, viewers will misread the values.
- Inconsistent category spacing and overlapping labels: Uneven gaps between bars or stems and colliding text hinder clean comparison.
- Unsorted categories: Failing to order categories meaningfully—typically ascending or descending by value when there is no natural order like time—forces the viewer to hunt for rankings.
- Overuse of color: Using too many hues or clashing palettes distracts from the data rather than guiding attention.
- Missing titles and axis labels: Omitting clear labels leaves the audience guessing what units or metrics are being measured.
Best Uses for Bar Charts
Bar charts remain the most reliable choice when an audience needs to grasp information quickly and without instruction:
- Executive summaries: Decision-makers scanning a report have seconds to absorb key figures, and the familiar silhouette of vertical or horizontal bars requires no decoding step.
- Public presentations: When a chart appears on a screen in front of a room, the audience cannot pause to study it. Novel chart forms often require a brief explanatory aside that disrupts the flow of a talk, whereas a bar chart lets the presenter focus entirely on the message.
- Standardized reporting: Organizations that circulate recurring dashboards or quarterly reviews benefit from a consistent, universally understood format, especially when serving mixed audiences with varying levels of data literacy.
- Fast production: Bar charts are supported as a single-click default in every charting tool, making them easy to generate, label, and update at the last minute before a meeting.
Best Uses for Lollipop Charts
Lollipop charts work best when the message centers on relative position, ranking, and clean layout across many items:
- Ranking lists: When a report lists twenty products by revenue, ten regions by satisfaction score, or a dozen survey statements by agreement level, the dot-and-stem geometry keeps attention fixed on the order and spacing of the items.
- Multi-metric dashboards: When a screen squeezes several small panels together, wide bars can dominate a panel and drown out neighboring charts. Lollipop charts create a calm, consistent rhythm across adjacent panels that helps frequent users spot changes quickly.
- Multi-entity time-series comparisons: A series of lollipops per period can show movement across categories without the clutter of overlapping or tightly grouped bars.
- Polished reports and presentations: When a modern, lighter aesthetic supports the tone of an annual report or slide deck, lollipop charts deliver precision without heavy blocks of ink.
Accessibility and Contrast
Lollipop charts introduce specific accessibility considerations because their marks are much thinner and smaller than solid bars.
- Dot size: The dot carries the primary value, so its diameter must be large enough to register for viewers with low vision and on low-resolution projectors or older laptop displays where fine details blur. Designers should test dot sizes at realistic viewing scales, including scaled-down document embeds.
- Stem line weight: The stem connecting each dot to the baseline should be thick enough to remain visible without competing with the dot itself. Hairline strokes that look crisp on a high-density monitor often disappear when printed or compressed.
- Color contrast: Every dot, stem, and axis label should meet recognized contrast thresholds against the background, such as the WCAG guidelines. Muted palettes and pastels frequently fail these checks, especially for viewers with color vision deficiencies.
- Redundant cues: Pair color with direct labels or distinct marker shapes so the chart remains interpretable when hue alone cannot carry meaning. Testing charts with grayscale filters and vision simulation tools helps catch these issues early.
Decision Guidelines
Choosing between a lollipop chart and a bar chart comes down to three practical factors:
- Audience familiarity: Bar charts carry decades of exposure across business, academic, and media contexts, while a lollipop chart adds a small cognitive step for viewers unused to tracking a stem to a dot. For executives, clients, or mixed stakeholders, weigh whether that step is worth taking.
- Metric density: Count the categories and series first. Bar charts are stronger for a small number of categories whose magnitudes need direct, immediate comparison. Lollipop charts excel when displaying long lists or dozens of values in a compact space.
- Design elegance: Annual reports, brand decks, and polished presentations benefit from the cleaner look and open white space of a lollipop chart, whereas routine internal status reports gain more from the dependability of standard bars.
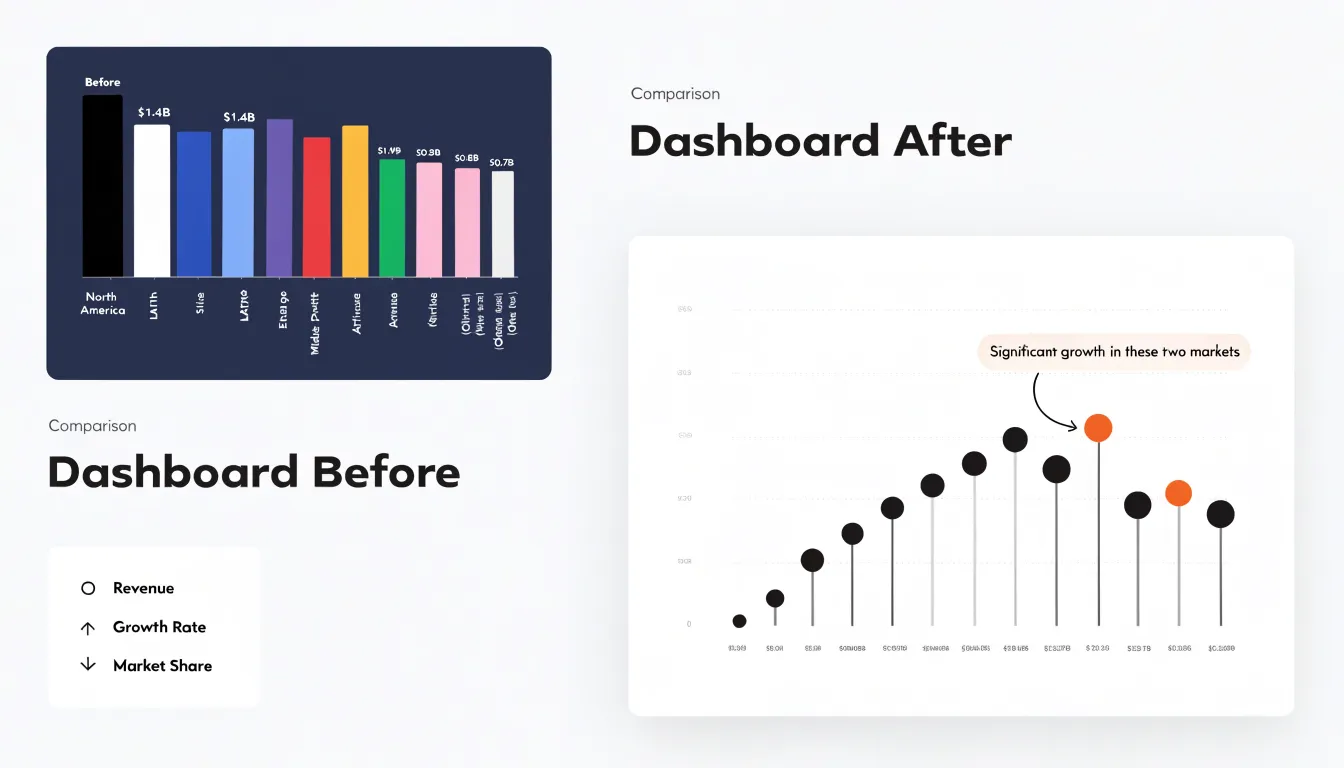
Dashboard Overview
Real-world dashboard redesigns show how switching from bars to lollipops changes executive review workflows through a three-step process:
- Audit friction points in the existing view: In dense horizontal bar panels—often twelve to twenty categories deep with heavy fills, thick gridlines, and inline value labels crowding every row—document where the eye stalls, which comparisons require counting gridlines, and which sections executives skip during quarterly reviews.
- Strip back the geometry: Replace the heavy bars with slim stems ending in single value markers, anchor the axis at zero, and reduce gridlines to faint references. In one sales performance redesign, converting a regional breakdown of fourteen markets into a lollipop chart created a clean visual arc of endpoints that could be traced in a single pass rather than scrutinized row by row.
- Verify legibility and interactivity: Confirm that zero baselines remain intact, markers stay legible at projection size, and interactive tooltips carry the exact figures that slimmer marks no longer display inline. Across these redesigns, teams reported shorter review meetings, fewer clarifying questions about which category led, and executives spotting insights they had previously missed.
Frequently Asked Questions
What is the difference between a lollipop chart and a bar chart?
A bar chart uses a solid rectangle whose length or height encodes the value, making the quantity appear as a filled block of area. A lollipop chart replaces the solid bar with a thin stem topped by a dot, directing attention to the endpoint—the actual value—rather than the filled area.
When should I use a bar chart instead of a lollipop chart?
Use a bar chart when the audience needs to grasp information quickly and without instruction, such as executive summaries, public presentations, standardized reporting, and fast production. It is stronger for a small number of categories whose magnitudes need direct, immediate comparison, while a lollipop chart adds a small cognitive step for viewers unused to tracking a stem to a dot.
How can I reduce visual clutter in a chart?
Lighten or remove gridlines, drop chart borders and background fills, avoid gradients, textures, and heavy color blocks, consolidate redundant labels, remove unnecessary tick marks, trim axis lines to the data range, and eliminate legends when direct labeling is possible. This aligns with the data-ink ratio: every graphical element should earn its place by carrying meaning.
How can lollipop charts help with large data sets and tight layouts?
Lollipop stems occupy only a small fraction of the horizontal area consumed by solid bars, so dozens of categories can fit in a compact panel, margins can be tightened, and small lollipop panels can sit side by side while preserving legibility. For large categorical views, use progressive disclosure—rank and filter top and bottom performers, sort by value, add interactive filters, drill-downs, and tooltips, segment into small multiples, and abbreviate or rotate long labels.
How do I highlight key metrics without overloading the chart?
Render most stems and dots in muted gray or desaturated blue, then switch only a handful of dots to a saturated accent such as orange or red; bar charts can fill important bars with the accent and fade the rest into a neutral tone. Keep accents scarce and meaningful—one or two highlighted data points per chart is usually enough—and keep the accent color consistent across a report so readers associate it with the target metric.
What accessibility and design issues should I watch for with lollipop charts?
Make dots large enough to register for low vision and on low-resolution displays, keep stem line weight thick enough to remain visible, ensure every dot, stem, and axis label meets recognized contrast thresholds such as WCAG, and pair color with direct labels or distinct marker shapes. Avoid oversized dots that obscure stems, truncated baselines that exaggerate differences, misaligned axes, inconsistent spacing or overlapping labels, unsorted categories, overuse of color, and missing titles or axis labels.
Tony Astor
Tony writes about data visualization and the tools people use to build charts and dashboards. More about Data Illustrator