Lollipop Chart: A Cleaner Take on the Bar Chart
 By Tony Astor ·

Lollipop Chart
A lollipop chart is a data visualization that uses a thin stem topped by a circular marker to represent values along a baseline. The stem’s length shows magnitude while the marker pinpoints the exact value. Compared with bar charts, it uses less ink and reduces clutter, making it ideal for ranking and comparing categories.
Table of Contents
Lollipop Chart
A lollipop chart borrows its name from a familiar object: a thin stick topped by a rounded candy. In chart form, a narrow stem rises from a baseline and ends in a circular node. Each part carries a distinct job. The stem establishes the connection between the baseline and the data point, drawing the eye along a measurable path, while the terminal circle gives the viewer a clear destination to focus on. Together, stem and node create a visual grammar that is easy to read at a glance.
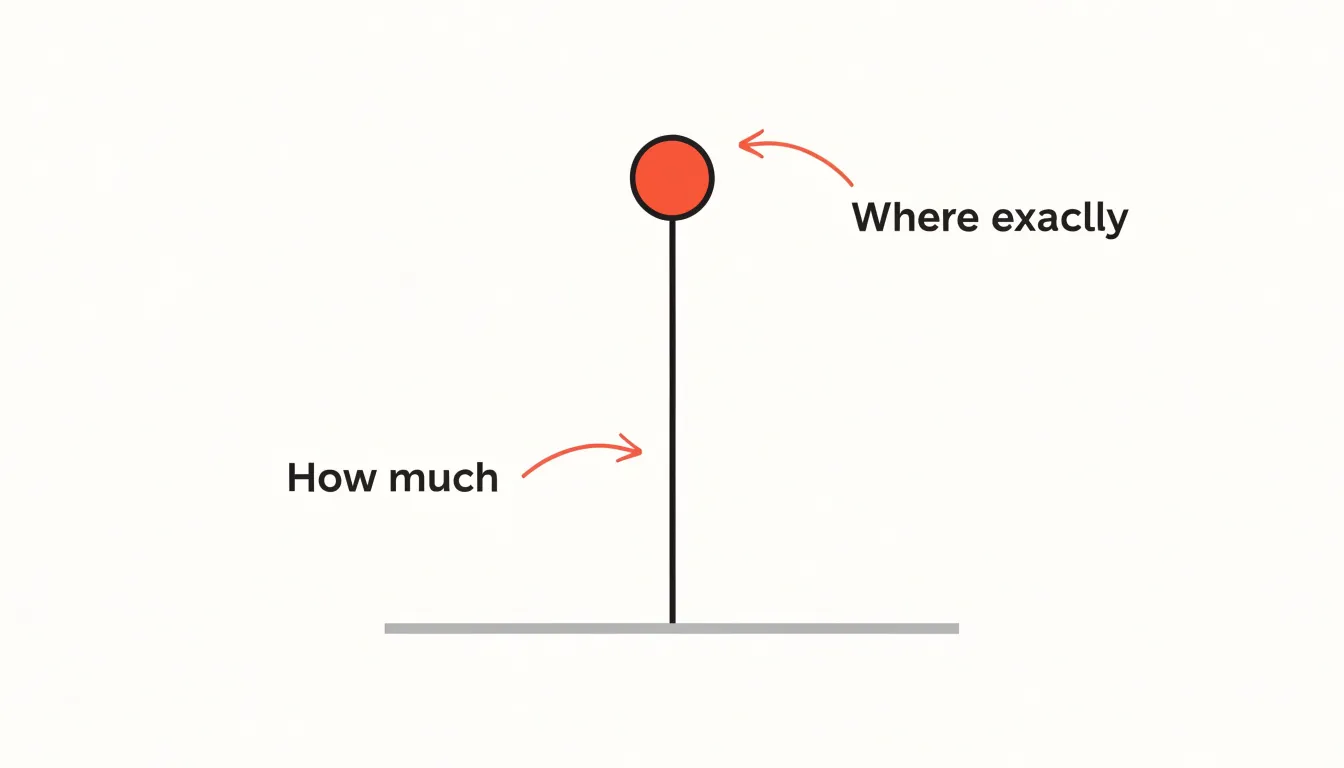
The stem’s primary role is to represent scale. Because its length corresponds to the magnitude of the value, the stem communicates distance from a reference point, usually zero. A longer stem signals a larger value; a shorter stem signals a smaller one. This linear quality lets viewers compare magnitudes quickly, showing how far a category has traveled along the scale.
The terminal node then pinpoints the precise data value. Placed at the end of the stem, the circle anchors the measurement in space, removing ambiguity about where the value falls—which is especially helpful when several categories sit close together. The circle also draws attention, acting as a visual full stop at the end of each stem.
In short, the stem answers how much, while the node answers exactly where. Once these two roles are clear, the chart becomes an efficient tool for comparing values across categories with restraint.
Bar Chart Comparison
Lollipop charts share a common ancestry with bar charts, yet they handle visual space differently. A traditional bar chart fills the area from the baseline to the data value with a solid block of color. A lollipop chart replaces that block with a thin stem capped by a circular marker, spending ink only along the path and at the value itself. Edward Tufte’s principle of maximizing the data-ink ratio applies directly here: every drop of ink should carry information, and large filled bars spend a great deal of ink on area that communicates nothing beyond the height already shown by the top edge. The lollipop’s stem carries the same positional information with a fraction of the footprint.
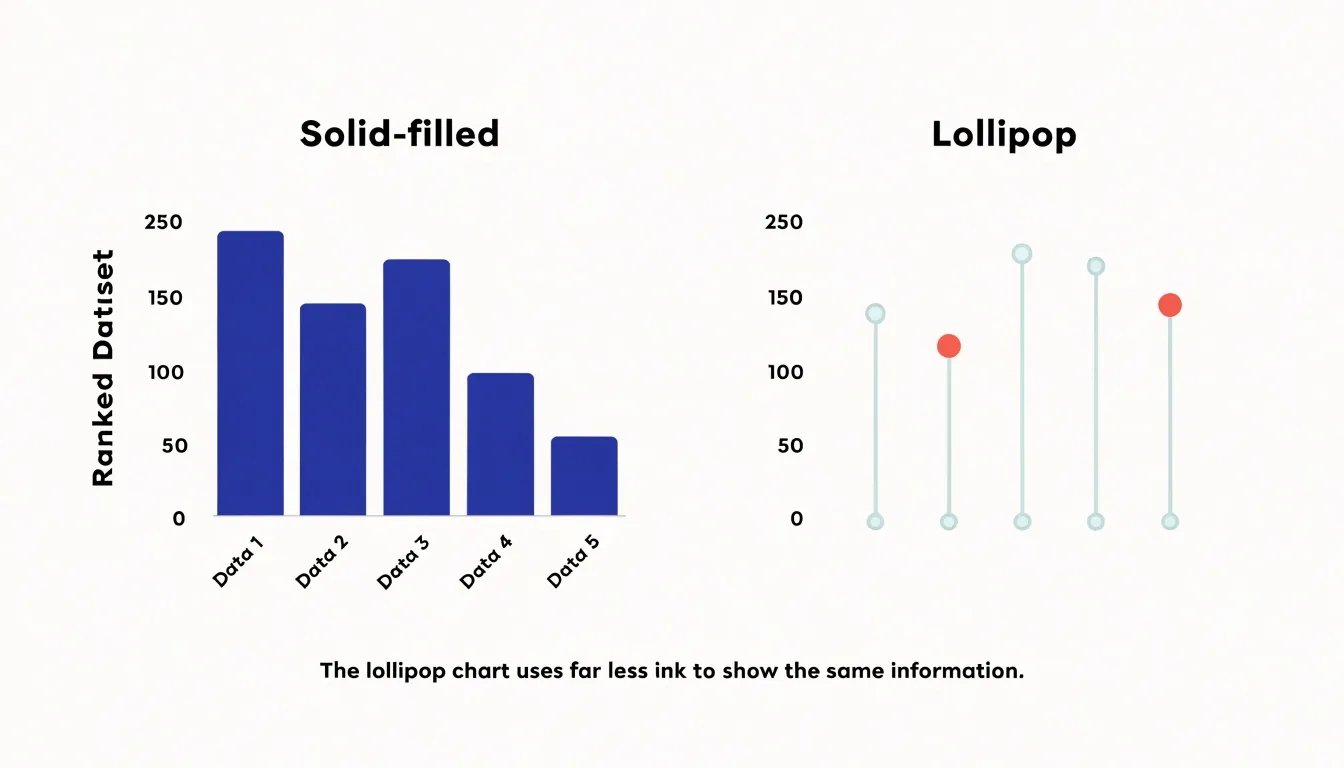
The practical consequences become obvious when a chart holds many data points. Bar charts with dozens of categories force the viewer to process a dense wall of rectangles. When bars sit close together, their edges compete for attention and the chart starts to read as texture rather than data. Lollipop charts lighten this load: the thin stems recede into the background while the dots remain distinguishable markers, letting the eye trace relative sizes across categories with less effort.
This reduction in visual clutter also helps when comparing multiple series, since overlapping lollipops are easier to disentangle than overlapping bars. Sparse ink leaves room for annotations, reference lines, and grouping colors, preserving the readability of length comparisons while keeping the canvas calm.
Best Use Cases
Lollipop charts excel at ranking and comparing named categories. When ordering a list of items—such as products, teams, or geographic regions—by a quantitative measure, the chart provides a clean visual hierarchy. Scanning from top to bottom reveals the highest and lowest performers at a glance, making the format ideal for leaderboards, survey results, or any ranked list where relative position matters.
Benchmarking is another strong use case. Plotting a lollipop chart against a reference line, such as an industry average or a target value, shows which categories exceed or fall short of the benchmark. Because each category is evaluated independently, the chart avoids the visual clutter that can arise with continuous lines or overlapping bars when comparing performance metrics across departments, regions, or time periods.
Discrete categorical comparisons with a moderate number of items (roughly 10 to 20) also benefit from the lollipop format. It works especially well when category names are long or when the chart must fit into a compact space, such as a dashboard or report.
Highlighting Variance
To make variance immediately legible, a diverging lollipop chart centers on a baseline—often zero or a target value—represented by a vertical or horizontal reference line. Each stem extends from this baseline to a circular marker, whose position indicates the magnitude of deviation. The direction of the stem above or below (or left or right of) the baseline instantly communicates whether the value is positive or negative relative to the reference point.
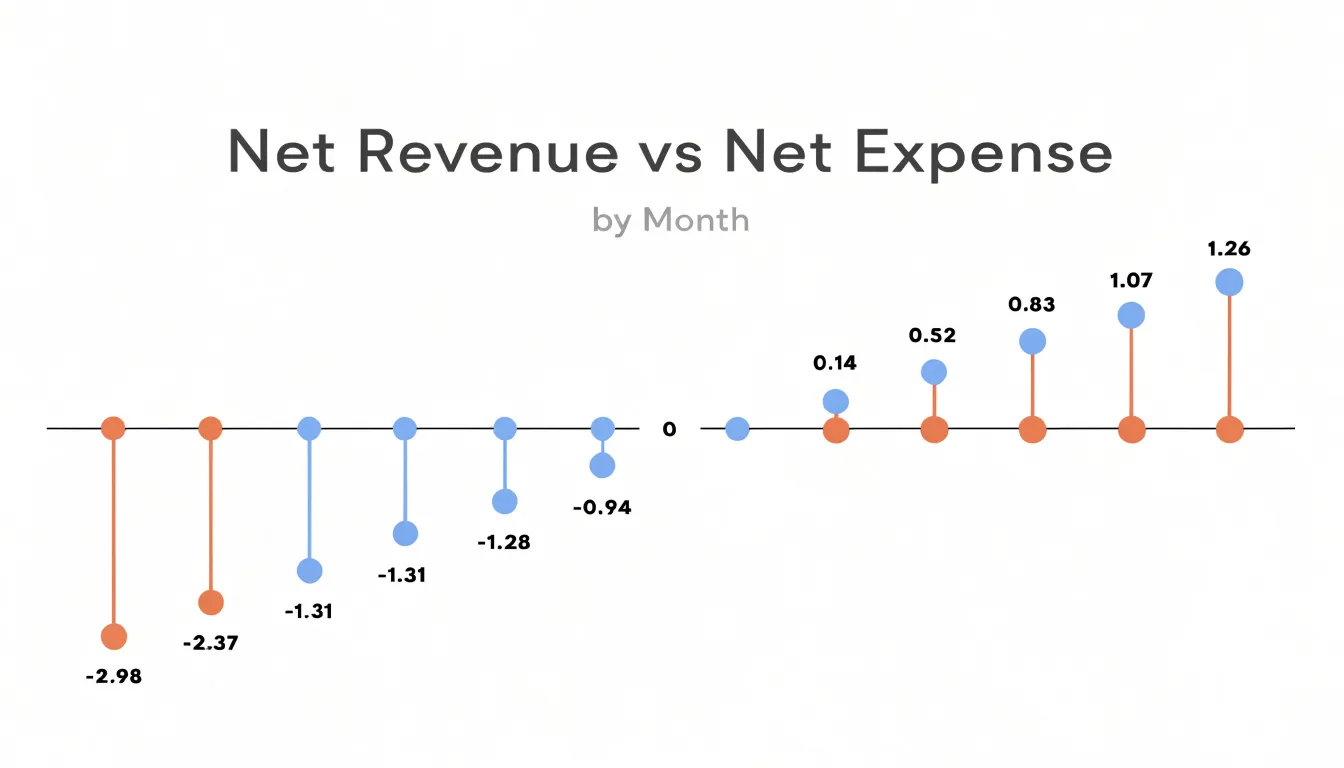
Consistent color coding reinforces this split: use one hue for positive deviations and another for negative ones so the reader does not rely solely on position. Markers are usually uniform in size, though their size can be varied to encode an additional variable such as volume or frequency if done cautiously to avoid clutter.
Ordering the lollipops from most negative to most positive creates a smooth gradient that highlights the distribution of deviations and makes outliers easy to spot. Labels can sit directly next to the markers for precise values, or a secondary axis can provide scale. When many categories are present, horizontal orientation often works best to accommodate longer labels and reduce crowding. Whether tracking performance against targets, survey responses, or financial variances, the diverging layout focuses attention on the magnitude and direction of change.
Avoiding Visual Traps
Lollipop charts have specific failure modes. One common trap appears with low-density datasets, where only a handful of categories are plotted. In such cases, the chart’s sparse geometry works against clarity. A few thin stems floating in a wide plot area leave readers scanning back and forth to locate the dots, and relationships between values become harder to grasp than they would be with a more compact form. With very few points, the eye receives isolated signals rather than a coherent pattern, making comparisons feel labored.
Small mobile screens compound the problem. Thin stems are among the first elements to suffer when a chart is scaled down or rendered at low resolution. On a phone or tablet, a stem specified at one or two pixels can fade into the background entirely, leaving a row of disconnected dots with no visible link back to the baseline. Touch interaction adds further friction, since accurate reading may depend on tooltips or hover states that are awkward on small devices.
Designers can respond by enlarging markers, thickening stems, or reducing the plotted range so the remaining elements carry more visual weight. Where those adjustments cannot restore legibility, an alternative chart type may communicate the data more reliably. Always test the chart at the sizes and densities where real readers will meet it.
Sizing the Circles
Sizing the circles begins with the overall canvas. A useful starting rule is to keep the dot diameter within roughly 2 to 4 percent of the shorter plot dimension. On a chart that is 600 pixels tall, that translates to a diameter of about 12 to 24 pixels—large enough to read at a glance and small enough to leave the stem visible beneath it. Small screens or dense dashboards generally call for the lower end of that range, while presentation slides viewed from a distance benefit from the upper end.
The more delicate constraint is the space between adjacent stems. When values cluster tightly along the category axis, generously sized circles will touch or overlap, blurring the boundary between neighboring observations. A practical safeguard is to set the radius so the gap between any two dot edges stays at least half a radius wide. Check this by comparing the smallest spacing between category positions against twice the radius, reducing the radius if the two values converge.
Orientation matters as well. In a horizontal lollipop chart, vertical spacing between rows governs how large the dots can grow; vertical layouts reverse this logic, with horizontal spacing between columns setting the ceiling. In either case, the axis line places a hard limit: a circle that crosses the baseline obscures the reference point, so the radius should never exceed the distance from the baseline to the nearest plotted endpoint.
Fixing a radius formula that responds to plot size rather than hard-coding pixel values keeps dots proportional when figures are resized or reused across formats.
Line Thickness
Stems should function as subtle connectors that do not compete with the endpoint markers for attention. Set stem weight between 0.5 and 1.5 points, depending on chart size and resolution. For print or high-resolution displays, a thinner line (0.5–0.75 pt) often works well, while digital screens may require slightly thicker stems (1–1.25 pt) to remain visible.
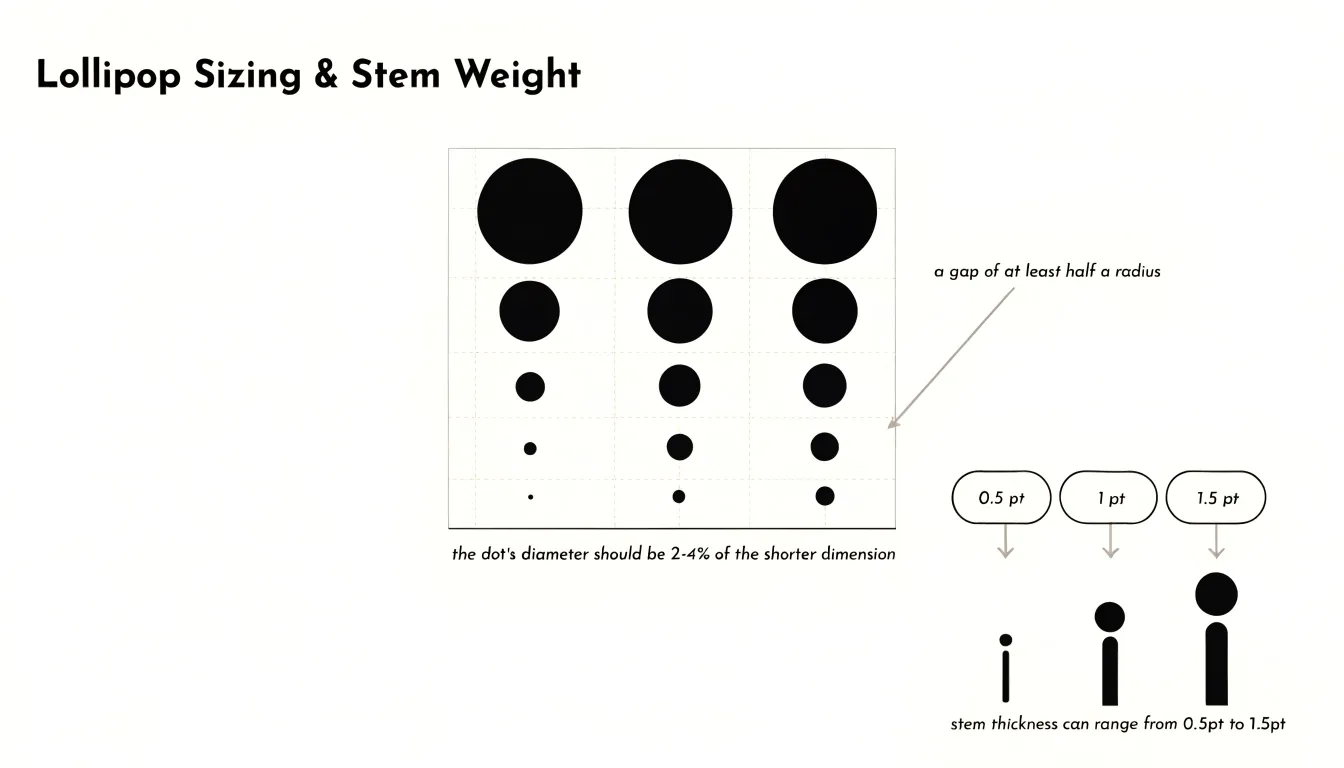
Keep thickness uniform across all stems, even when multiple series are present; varying thickness can imply unintended meaning or add clutter. Draw stems as solid lines in a neutral color, such as gray or a muted tone, rather than dashed or dotted patterns, which introduce visual noise.
Color Palette
A well-chosen color palette helps readers locate the most important values quickly. Assign one strong accent color—such as a saturated blue, teal, or warm orange against a light, quiet background—to the key data points you want the viewer to notice first. Reserve this accent for the few points that carry the main message, and keep the remaining markers in a muted gray or soft neutral tone to establish a clear hierarchy. Limit the overall palette to two or three colors total: one accent, one neutral for the baseline stems, and perhaps a single secondary tone for a comparison group. If gridlines are used, keep them pale gray so they recede behind the data.
Accessibility should guide every decision about hue and saturation:
- Avoid red-green pairings or subtle pastel differences that blur together for readers with color vision deficiencies.
- Test candidate palettes with a contrast checker to confirm that markers and stems reach a contrast ratio of at least 3:1 against the background.
- When categories require different colors, choose hues that vary in lightness as well as hue so distinctions survive conversion to grayscale.
- Pair color with a secondary cue—such as a slightly larger marker for highlighted points or a direct label beside the accent lollipop—so the chart remains legible in grayscale printouts and on low-quality screens.
Creating Lollipops in Excel
Building a lollipop chart in Excel starts with a clean data table: place category labels in the first column and corresponding values in the adjacent column, sorted in display order. Insert a standard clustered bar or column chart from the Insert tab to serve as the scaffold.
The most reliable approach uses a combo chart with error bars:
- Keep the bar series and adjust the gap width slider until the bars resemble slender rods, or introduce a second series containing the same values.
- Change the second series chart type to scatter or line with markers only, and format the markers as clearly sized circles.
- Attach error bars to this marker series to act as the stems, aligning them precisely with the categories for fine control over stem length and appearance.
An alternative method overlays an XY scatter plot directly on the bar chart using helper columns that assign each category an x-position, then aligning the scatter points with the bar tops. This overlay works especially well when categories are numeric rather than textual.
Once the structure is in place, remove gridlines and chart borders, soften the axis lines, color the stems a muted tone, and apply a single accent color to the markers. Save the workbook as a template to reuse the structure with new data.
Building with Tableau
In Tableau, constructing a lollipop chart relies on a dual-axis chart that combines a line mark with a circle mark:
- Place your categorical dimension on the Rows shelf and your numeric measure on the Columns shelf (Tableau defaults to a bar chart).
- Duplicate the measure by holding Ctrl and dragging it beside the original on the Columns shelf, or use the Add a Reference Line option through the Analytics pane depending on your version.
- Right-click the second measure pill and choose Dual Axis to overlay both marks on shared axes.
- Right-click the axis and select Synchronize Axis so the circles align precisely with the line heights.
- On the Marks card, set the first measure to Line and the second to Circle. Use the Path or Size options to keep the line thin, and increase the circle size slightly so it sits clearly above the stem.
- Drag your measure onto the Label shelf of the circle mark to display values directly, apply your accent color, and remove gridlines to clean up the axis.
Coding in Python
Matplotlib offers a direct route to building lollipop charts in Python by treating the stems and markers as separate artists:
- Define your categories and values, then call
ax.vlineswith the category positions as the x arguments, zero as the starting y value, and the data values as the ending y values. - Layer an
ax.plotorax.scattercall on top to place the circular markers at the tips. - Style the two layers independently—giving the stems a muted gray and the markers a saturated accent color.
When your data lives in a tidy DataFrame, Seaborn fits naturally into this workflow. Compute the values with groupby and aggregation, draw the stems using vlines on a Seaborn-styled axis (which inherits the theme’s palette and grid behavior), and pass a hue column to the marker layer through sns.scatterplot to color-code groups on a shared axis.
In Python, you can easily sort categories by value, annotate each marker with its numeric label using ax.text or a loop over the data, adjust stem widths, and set marker sizes to encode a second variable such as sample count. Adding a baseline at zero, trimming the top and right spines, and wrapping the construction in a reusable function lets you regenerate the chart across notebooks or reporting pipelines with a single call.
Interactive Elements
Interactive elements turn a static lollipop chart into a responsive tool for exploration, especially in compact dashboards where underlying data is detailed:
- Tooltips: Hovering over a marker can trigger a small pop-up revealing the exact value, category label, and supporting context such as percentage change from a prior period, keeping the chart surface clean.
- Highlighted stems: On hover, the active stem can thicken or shift to an accent color while its marker grows slightly, confirming which point is in focus and helping the eye trace the connection to the baseline. Neighboring stems can dim in response to highlight the selected item without losing comparison context.
- Dynamic hover states: Changing the cursor signals that a marker is clickable, and brief, smooth transitions keep the chart feeling responsive rather than jumpy. Hover states can also sync with related dashboard components, such as a legend or detail panel.
Keep these effects accessible: keyboard focus styles should mirror hover styles, tooltips must remain readable at small sizes, and motion should stay subtle for users who prefer reduced animation.
Common Formatting Mistakes
Several formatting errors can undermine a lollipop chart or distort the data:
- Misaligned axes: When the axis scale is set incorrectly or stems are not anchored at the proper baseline, comparing values accurately becomes difficult.
- Overcrowded labels: Long or numerous category labels along the axis often overlap. Fix this by abbreviating or rotating labels, switching to a horizontal orientation for more label space, or grouping smaller items into an “Other” category.
- Truncated baseline values: Because stem length encodes magnitude, starting the baseline above zero exaggerates differences—for example, starting at 50 instead of 0 makes a value of 60 appear twice as long as 55. Truncating the baseline should be done only when justified to highlight small variations, and must be clearly labeled.
- Inconsistent spacing and oversized elements: Uneven gaps between stems confuse the viewer about category groupings, while overly thick stems or large circles recreate the clutter the chart type is meant to avoid.
Essential Chart Rules
Before publishing, run through this final styling and technical checklist:
- Axis and baseline: Confirm the axis begins at zero (unless the data genuinely demands otherwise) and verify that tick spacing is consistent. Ensure stems are thin, uniform, and visually subordinate to the dots.
- Color and contrast: Check that your accent hues are reserved for the most important categories, supporting data uses muted tones, and contrast between dots, stems, labels, and background is legible in both print and screen formats. Confirm color is never the sole encoding of meaning.
- Typography and labels: Keep axis labels concise, place value labels close to their dots without overlapping, and step font sizes down consistently from title to axis to annotation. Remove unnecessary gridlines or reference lines.
- Technical accuracy: Verify that plotted values match the source dataset, categories follow a logical sequence (such as magnitude or time), the chart title states precisely what is measured, and spacing, dot size, and stem weight match any companion charts in the same report.
Dashboard Overview
Screen space is one of the most constrained resources in dashboard design. In a multi-chart layout—such as a grid of six or eight panels arranged in two or three rows—traditional bar charts crowd the canvas with heavy blocks of color that press against one another and reduce the whitespace separating one panel from the next.
Swapping those bars for lollipops introduces generous negative space inside each panel. Because the thin stems and compact dots read as light marks rather than dense shapes, the eye can travel between charts without the layout feeling congested. This internal airiness gives labels, axis ticks, and value annotations room to breathe, and allows gridlines to be lightened or removed entirely since the stems already guide the eye to the baseline. The slim profile also makes it easier to align several small charts in a shared row, letting designers fit more panels on a single screen without sacrificing clarity.
Frequently Asked Questions
What is a lollipop chart and what do the stem and dot represent?
A lollipop chart has a narrow stem that rises from a baseline and ends in a circular node. The stem represents scale and magnitude, while the terminal circle pinpoints the precise data value.
When should I use a lollipop chart instead of a bar chart?
Lollipop charts are useful when a chart holds many data points or compares multiple series, since they spend less ink and create less visual clutter than bar charts. Overlapping lollipops are also easier to disentangle than overlapping bars.
What are good use cases for lollipop charts?
Lollipop charts excel at ranking and comparing named categories, benchmarking against a reference line, and discrete categorical comparisons with roughly 10 to 20 items. They also work well when category names are long or the chart must fit into a compact space.
How do I make a diverging lollipop chart show variance?
A diverging lollipop chart centers on a baseline such as zero or a target value, with stems extending to markers whose position indicates the magnitude of deviation. Use one hue for positive deviations and another for negative ones, and order the lollipops from most negative to most positive to highlight the distribution.
How large should the circles be on a lollipop chart?
Keep the dot diameter within roughly 2 to 4 percent of the shorter plot dimension. Ensure the gap between any two dot edges stays at least half a radius wide, and never let the radius exceed the distance from the baseline to the nearest plotted endpoint.
What common formatting mistakes should I avoid in a lollipop chart?
Avoid misaligned axes, overcrowded labels, truncated baseline values, inconsistent spacing, and oversized elements. Because stem length encodes magnitude, starting the baseline above zero exaggerates differences, and truncating the baseline should be done only when justified and clearly labeled.
Tony Astor
Tony writes about data visualization and the tools people use to build charts and dashboards. More about Data Illustrator