Line Chart vs Bar Chart: How to Choose
 By Tony Astor ·

Line Chart vs Bar Chart
Line charts display continuous data over time, connecting points to reveal trends, momentum, and seasonality. Bar charts compare discrete categories using bar length, with a zero baseline for accurate magnitude judgments and sorting for instant ranking. Choose line charts for time-series trajectories and bar charts for categorical comparisons, rankings, and part-to-whole breakdowns.
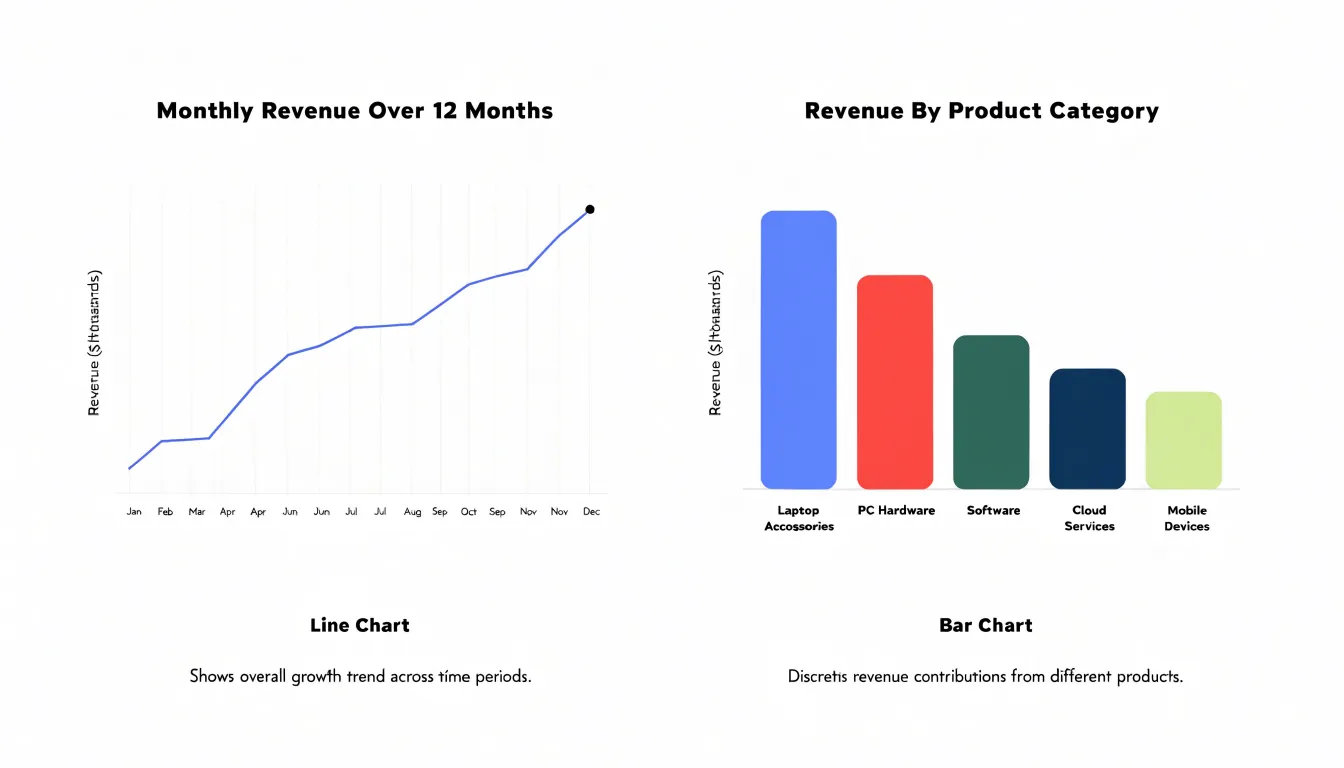
Table of Contents
Line Chart
Line charts are built for sequence. When data points sit along a continuous axis of time, a line chart weaves them into a single path that the eye follows from left to right, and that path communicates direction almost instantly. Each segment connecting one interval to the next captures the movement between them, so a rising slope signals growth, a falling slope signals decline, and a flat stretch signals stability. Readers absorb these directional shifts before they read a single number, which makes the line chart a natural choice whenever the question at hand is where something is heading.
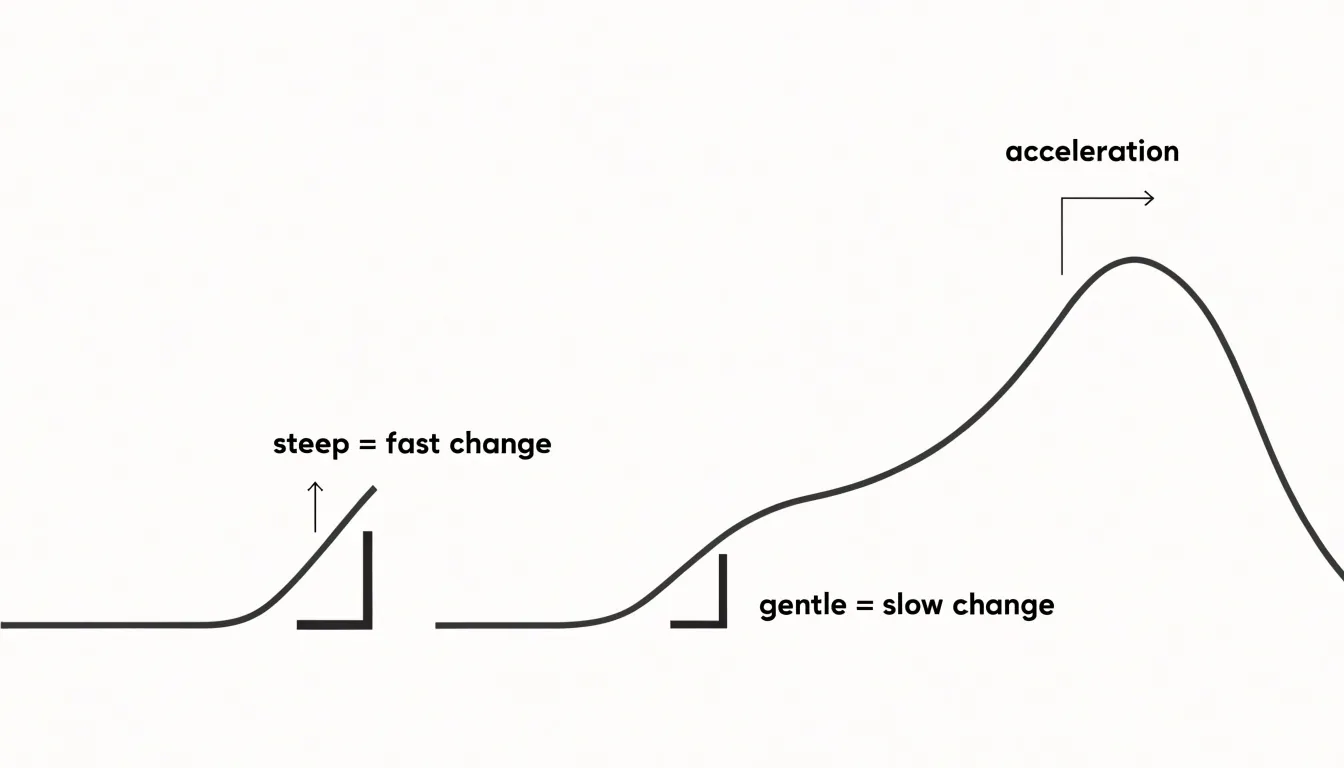
The slope of the line carries additional meaning. A steep segment shows a rapid rate of change, while a gentle segment shows slow movement, and a curve that bends gradually reveals acceleration or deceleration across sequential intervals. Historical momentum becomes visible in the overall shape of the plot: a series of higher peaks and higher troughs shows sustained upward pressure, while lower highs and lower lows reveal a downward drift. Because the line remains unbroken, patterns such as seasonal swings, cyclical peaks, and long-run trends emerge as recognizable shapes rather than isolated values.
Multiple series can be layered on a single plot, letting viewers compare the trajectories of different categories across the same timeline and observe where they converge, diverge, or cross. With regular intervals along the horizontal axis and a consistent scale on the vertical axis, the line chart preserves the proportional relationship between time and value, so distance on the page corresponds to elapsed time and magnitude in the data. This combination of continuity, slope, and shape allows a line chart to tell the story of change over time in a compact visual form.
Bar Chart
Bar charts convert discrete categories into visual quantities through rectangular bars whose lengths encode value. Each bar represents a self-contained group such as a product line, region, department, or survey response, and the spaces between bars signal that these groups are separate rather than parts of a flow. Vertical bars suit short category labels and moderate bar counts, while horizontal bars accommodate long labels and larger sets of categories without crowding the axis, which makes them a practical default when names are wordy or numerous.
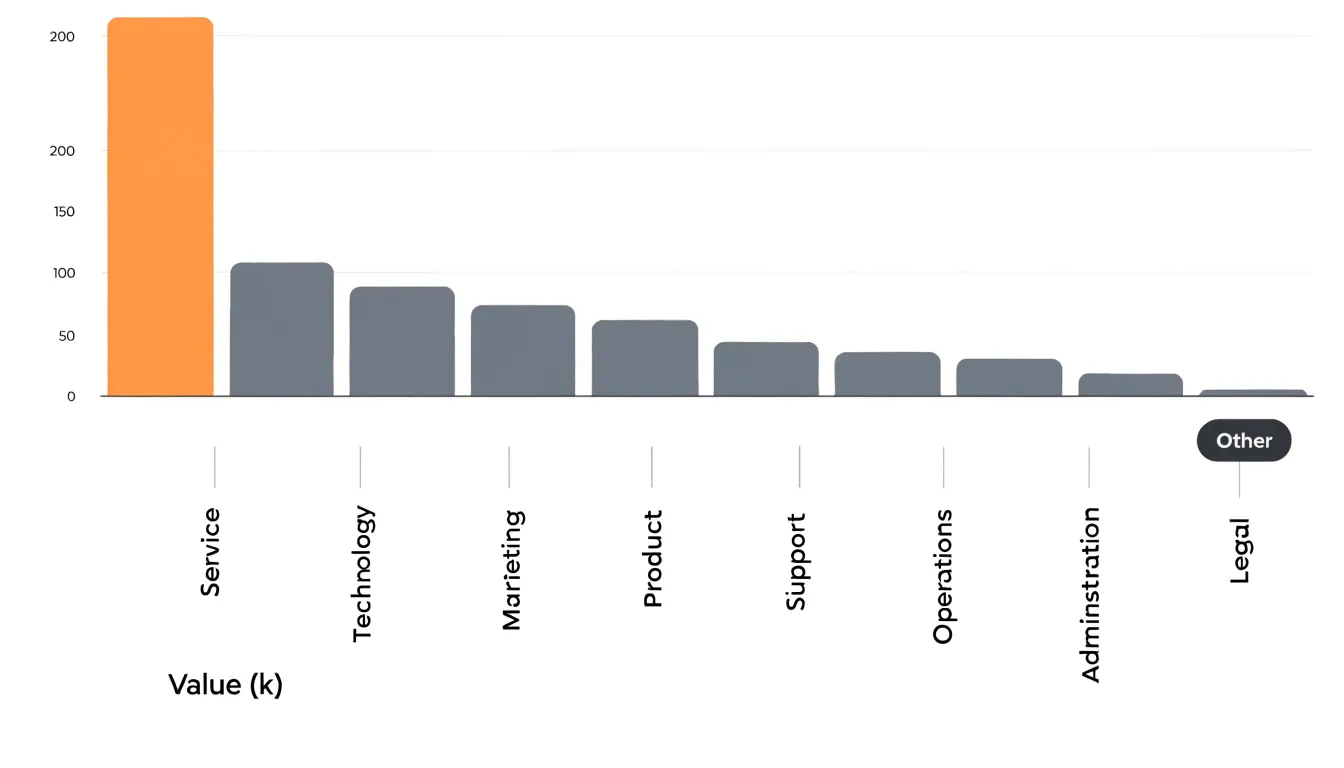
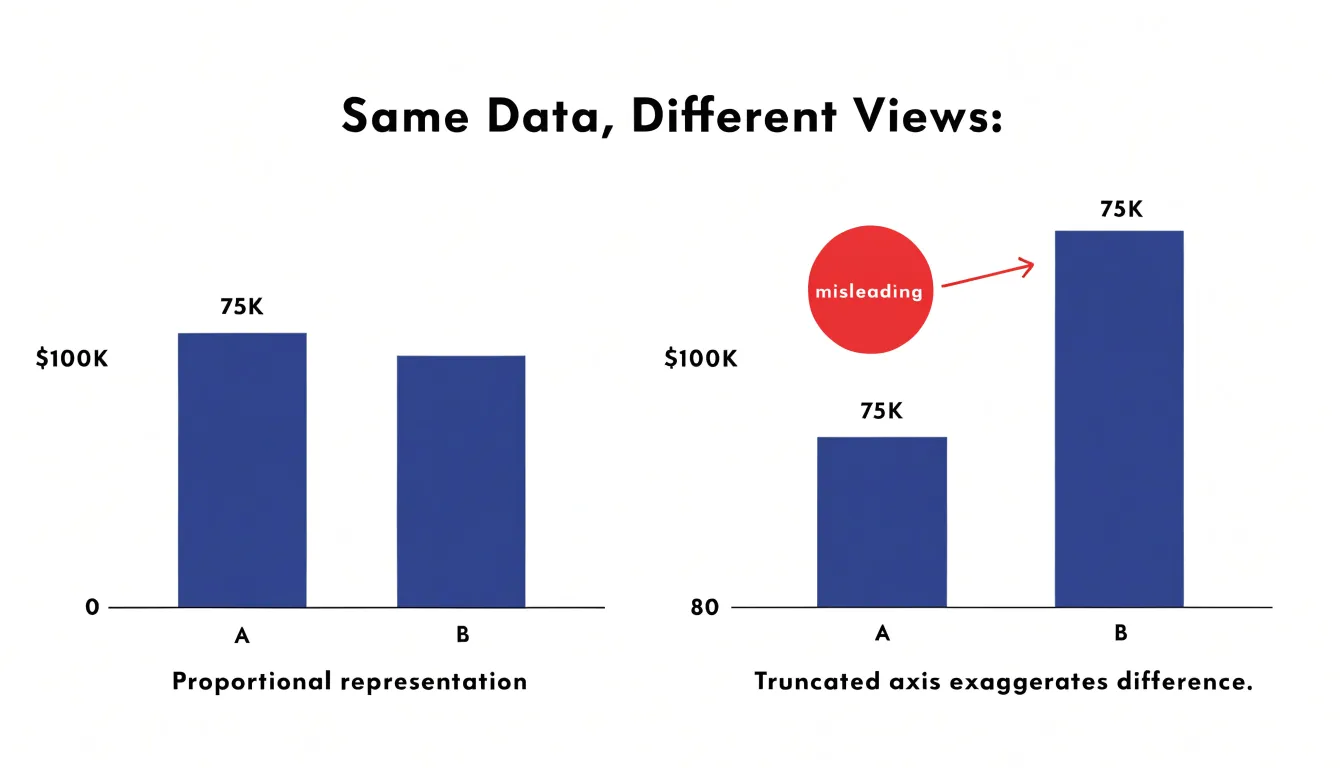
Techniques for clarity begin with scale discipline. Bars must start at zero, because length is the visual cue readers rely on, and a truncated baseline inflates differences misleadingly. Ordering categories by value rather than alphabetically turns the chart into a ranking that answers the obvious question at a glance. Limiting the chart to a manageable number of bars, often a dozen or fewer, keeps individual comparisons effortless; beyond that, grouping small categories into an “Other” bar or switching to a different display preserves readability. Consistent color applied to the same category across several charts supports cross-figure comparison, while a single accent color can draw attention to the category under discussion.
When several series share the same categories, grouped bars sit side by side within each category slot, and stacked bars show both totals and composition. Grouped bars favor direct comparison between series; stacked bars emphasize the whole and its parts, though the middle segments become harder to compare precisely. Gridlines should be faint, value labels can replace them where precision matters, and a clear axis title with units prevents misreading. With these choices, a bar chart delivers quick, accurate judgments about which categories stand out and by how much.
Line Chart
Line charts are built to represent data that changes continuously across a time horizon. When you plot a dense chronological series, such as daily closing prices for a stock or hourly traffic counts on a busy road, the line chart connects each observation to the next with a continuous stroke. This uninterrupted path mirrors the way the underlying phenomenon actually unfolds: prices move moment by moment, and traffic ebbs and flows across the hours of the day. The eye follows the line from left to right and naturally reads it as a story of change over time.
Density is where the line chart earns its place. With hundreds of data points, such as a full year of daily stock prices or a month of hourly traffic readings, a line chart compresses the series into a single readable trace. The viewer can spot trends, turning points, and seasonal rhythms at a glance. Gaps, spikes, and sudden drops stand out against the continuous baseline of the line, which makes anomalies easy to detect without scanning individual values.
Because the line treats time as a flowing axis, adjacent points are read as part of one connected process. This supports comparisons across periods and helps viewers project forward from recent movement. A line chart also accommodates multiple series, such as several stocks or several road sensors, allowing direct comparison of trajectories on shared time scales.
For dense chronological data, the line chart’s continuous form communicates movement and direction with minimal visual clutter, making it a natural fit for tracking change across continuous time horizons.
Bar Chart
Bar charts serve as one of the most effective tools for comparing quantities across distinct groups and categories. When the goal is to contrast performance across departments, regions, or demographic segments, a bar chart places each category on an axis and uses bar length to represent a measurable value, making differences immediately visible to the reader. The categorical axis can hold nominal variables, such as department names like Marketing, Sales, and Engineering, or ordinal variables, such as satisfaction ratings ordered from low to high. In both cases, the chart preserves the identity of each group while allowing direct visual comparison of their associated values.
A common practical application involves comparing performance metrics across departments within an organization. A manager might chart quarterly revenue, headcount, or average project completion time for each department, with one bar per department. Readers can quickly identify which team leads and which lags, and grouped or stacked variants allow further breakdowns, such as separating new business from renewals within each department’s bar. Demographic comparisons follow the same logic. A bar chart can display survey responses or service usage rates across age brackets, income tiers, or geographic regions, with each demographic group occupying its own bar. Ordinal categories, like education level or customer satisfaction tiers, benefit from being arranged in their natural order along the axis, which helps readers trace a progression rather than scanning a jumbled list.
Horizontal bar layouts are especially useful when category labels are long or when there are many groups to compare, since the labels remain readable without rotation. Consistent color coding and a zero baseline further support accurate interpretation, ensuring that bar length faithfully reflects the underlying values. By pairing a clear categorical axis with a quantitative measure, bar charts give analysts a straightforward way to contrast groups side by side and to communicate those comparisons to audiences who need fast, reliable takeaways.
Line Chart
Line charts excel at revealing spikes and patterns over time by connecting individual data points into a continuous line. The slope of the line between consecutive points indicates the rate of change: a steep upward slope signals rapid growth, while a gentle slope suggests slow change. Sudden anomalies appear as sharp, isolated spikes or dips, often standing out from the surrounding trend. By analyzing the curve’s trajectory, you can detect recurring patterns such as seasonality—regular peaks and troughs that repeat at fixed intervals, like monthly sales spikes during holidays. Cyclical fluctuations, which occur over longer periods and may not have a fixed schedule, are also visible as wave-like movements in the line. The overall shape of the curve helps distinguish between random noise and meaningful patterns: smooth, consistent trends contrast with erratic, jagged lines that indicate volatility. To spot seasonality, look for repeating motifs in the line’s shape, such as a consistent rise and fall each quarter. Anomalies are best identified by comparing the line’s behavior to an expected pattern or a baseline; a sudden deviation often merits investigation. Cyclical fluctuations appear as broader undulations that span multiple seasons or years, often tied to economic or business cycles. By focusing on slopes and trajectories, line charts provide a clear visual narrative of how data evolves, making them indispensable for time-series analysis. Whether you’re tracking website traffic, stock prices, or temperature readings, the line chart’s ability to highlight both short-term shocks and long-term rhythms ensures you won’t miss critical insights hidden in the data.
Bar Chart
One of the bar chart’s greatest strengths is its natural alignment with ranking tasks. When data is sorted by value magnitude, readers can scan a single edge across the chart and instantly absorb the ordering of categories. Sorting bars in descending order places the highest performer at the top of the chart, where the eye lands first, and pushes the lowest performer to the bottom. This arrangement transforms raw categorical data into a clear hierarchy without requiring the viewer to compare dozens of bar lengths mentally or consult a table of numbers.
The sorting decision itself deserves deliberate attention. Descending order works well when the primary message is about leading performers, budget contributors, or market share. Ascending order can be appropriate when the reader’s interest lies in the weakest segments, for example when identifying underperforming channels that need intervention. For datasets with a natural order, such as months, age brackets, or process stages, preserving that sequence may carry more meaning than sorting by magnitude, and the choice should reflect the story the chart is meant to tell.
Visual highlighting can reinforce the ranking once the bars are ordered. Applying a distinct color to the top performers, or to bars that cross a target threshold, directs attention to the segments that matter most while keeping the overall distribution visible for context. Annotation labels on the leading bars can add precise values exactly where the reader’s focus already rests. Consistent bar width and spacing maintain a clean visual rhythm so that the ordering reads as intentionally structured rather than noisy. With sorting and selective highlighting working together, a single bar chart can communicate both the full distribution of categories and the headline takeaway about who leads and who lags.
Line Chart
When a line chart carries more than one series, the chart’s readability depends on how carefully each visual layer is managed. Color coding forms the foundation of this approach. Assigning a distinct, consistent hue to each series lets readers track a trendline across the full width of the chart, and selecting colors with similar saturation and lightness keeps any single line from dominating the others. A restrained palette of three to five hues works well because it stays within the range most readers can distinguish at a glance, particularly when the chart appears on screens of varying quality.
Stroke width plays a supporting role in keeping overlaid lines legible. Thin strokes, typically around one to two pixels, reduce the visual weight of each line so that several series can cross and run close together without producing a dense smear of ink. Thin lines also preserve the clarity of individual data points and make small separations between trends easier to see, which matters when the values being compared diverge only slightly.
Direct labeling extends these practices by placing series names at the end of each line or alongside a representative segment, removing the need for readers to bounce between the plot and a separate legend. Labels positioned at the line’s terminus take advantage of the natural endpoint of a trend and keep the names close to the data they describe. When lines converge, a short leader line or careful offset prevents label collisions.
These techniques together support comparisons of roughly three to five trendlines on a single chart. Within that range, overlaid series remain distinguishable, the chart stays uncluttered, and readers can follow each trend from start to finish without visual strain. Pushing beyond five series usually calls for splitting the data across small multiples or switching to a different visual form.
Bar Chart
When category names are long, a vertical bar chart often forces a tough choice: rotate the labels, truncate them, or shrink the font. Rotated text slows reading, and truncation risks losing meaning. Swapping to a horizontal bar chart solves this by giving each category a full line of space, so labels stay horizontal and fully legible. In a horizontal layout, the y-axis holds the categories, and the bars extend to the right. The label area can be as wide as needed without crowding the plot. This is especially useful for survey questions, product names, or geographic locations with multi-word labels. The swap is straightforward: move categories from the x-axis to the y-axis, and values from the y-axis to the x-axis. The result is a chart that reads naturally from top to bottom, with labels aligned left. No rotation or truncation required. For very long labels, you can also adjust the left margin to accommodate the text. The horizontal orientation also makes it easier to sort bars by value, which is a common need. When deciding whether to swap, consider the length of the longest label. If it exceeds about 10-12 characters, a horizontal layout is likely better. Also consider the number of categories: horizontal bars work well for many categories because they can be stacked vertically without overlapping. In contrast, vertical bars with many categories become cramped. The key is to prioritize readability. If labels are an afterthought, the chart fails to communicate. Swapping axes is a simple, effective fix that keeps the focus on the data. So next time you face long category names, try a horizontal bar chart and see how much cleaner it looks.
Bar Chart
A bar chart encodes data through the length of its bars, and that length is measured from a shared origin. When the vertical axis begins at zero, each bar’s height is directly proportional to the value it represents, so a bar that is twice as tall stands for a value that is twice as large. This proportional relationship is the core of what makes bar charts readable at a glance. Readers do not calculate values from tick marks; they compare bar lengths visually and trust that the comparison reflects the underlying numbers. Truncating the y-axis breaks this trust. If the baseline starts at, say, 80 instead of zero, the visible portion of each bar no longer corresponds to the full value. A category with a value of 90 and another with 95 may appear as bars of dramatically different lengths, even though the real difference is small. The visual impression contradicts the data, and viewers who rely on the chart’s shape rather than its labels will draw the wrong conclusion.
The distortion is not limited to individual bars; it also reshapes comparisons across the entire chart. Differences between categories become exaggerated, trends shift in apparent magnitude, and the chart may suggest a dramatic gap where the underlying values are nearly identical. This effect is especially dangerous in everyday reporting, where charts are often scanned quickly and rarely checked against their axis labels. Maintaining a zero baseline preserves the integrity of the visual encoding, ensuring that the length of a bar remains a faithful representation of its value. When a genuine need exists to highlight small differences between large values, adding a separate table or a supplementary chart with clearly marked axes offers a more honest solution than compressing the scale and inviting misinterpretation.
Stacked Charts
Stacked charts are designed to show how individual sub-components combine to form a whole. In a stacked bar chart, each bar represents a total, and the segments within the bar show the contribution of each category to that total. Similarly, a stacked area chart displays multiple series stacked on top of one another, with the total height at any point representing the combined value. These charts are particularly useful when you want to compare both the aggregate totals across categories and the internal composition of each total.
When using stacked charts, it’s important to ensure that the segments are clearly distinguishable, typically through consistent color coding and labeling. The order of stacking should be logical, often placing the most important or largest category at the bottom for easy comparison. For stacked area charts, avoid using too many categories, as the chart can become cluttered and difficult to read. Limit the number of stacks to five or fewer to maintain clarity.
Stacked charts excel at highlighting part-to-whole relationships over time or across categories. For example, a stacked area chart can show how the proportion of different revenue streams changes over several quarters, while a stacked bar chart can compare the composition of expenses across departments. However, they are less effective for precise comparisons of individual segments, especially those not at the baseline. If the exact values of sub-components are critical, consider using a grouped bar chart or a separate line chart instead.
Always include a clear legend and consider adding data labels for key segments to aid interpretation. When the total is as important as the parts, stacked charts provide a compact and informative visualization that balances both aspects.
Common Mistakes
A line chart or bar chart can fail for reasons that have nothing to do with the data itself. Many of the most damaging problems come from design choices that seem harmless at the moment of construction, yet steadily erode the reader’s ability to interpret the chart correctly. Over-cluttering is among the most frequent offenders. A line chart that carries a dozen series, each in a slightly different shade, forces readers to trace individual paths across a tangle of intersecting lines. The chart technically shows everything, but it communicates almost nothing. Pruning to the handful of series that matter, or splitting the visualization into small multiples, restores clarity at a stroke.
Missing legend keys create a related problem. When colors, line styles, or fill patterns are used to distinguish categories but no key explains them, readers are left guessing which element stands for which group. The chart becomes a puzzle rather than a message. Every encoding needs an explicit decode, placed close enough to the chart that readers do not have to hunt for it.
Improper sorting quietly distorts comparisons in bar charts. When categories appear in alphabetical order or in the order the data happened to arrive, the eye cannot see which values are largest or smallest without scanning back and forth. Ordering bars by value, or by a meaningful sequence such as time or rank, lets the pattern emerge immediately.
Truncated axes represent perhaps the most serious pitfall. Beginning a bar chart’s value axis above zero exaggerates differences between bars, since bar length is the visual cue readers rely on. Line charts tolerate a narrowed range in some cases, but a baseline chosen to inflate movement misleads just as surely. Reviewing drafts for these four issues before publication catches most of the errors that undermine otherwise sound charts.
Decision Matrix
A decision matrix turns chart selection into a short series of practical questions rather than a matter of habit. Start with the shape of your data. Ask whether your values are measured over continuous time, since a line chart handles that case naturally by preserving the sense of flow from one period to the next. Ask whether your categories are discrete and independent, such as regions, products, or survey responses, which points toward a bar chart where each bar stands alone. Then consider how many series you need to show. A line chart can carry several lines before it becomes cluttered, while a bar chart with grouped or stacked bars works well for comparing a handful of categories across a few groups. Next, examine audience needs. If readers will scan the chart quickly in a report or presentation, clarity about individual values matters, and bars make those values easy to compare side by side. If readers need to understand momentum, trend direction, or the pace of change, lines communicate that movement at a glance. Follow with your primary communication goal. When the goal is ranking or showing magnitude differences between items, bars give each item a clear baseline and make the comparison direct. When the goal is showing a trajectory, a line connects the dots into a story of rise and fall. Finally, add practical checks: count your data points, note whether zero must appear on the axis, and confirm labels will fit. A quick run through these questions takes less than a minute and reliably narrows the choice to the chart that serves both the data and the reader.
Dashboard
Executive dashboards succeed or fail on how quickly a viewer can extract meaning. Combining line and bar charts on the same dashboard gives decision-makers two complementary reading modes. Line charts carry the story of movement over time, showing trends, momentum, seasonality, and inflection points at a glance. Bar charts anchor that movement to discrete categories or periods, making comparisons of magnitude immediate and unambiguous. When these two visual forms sit side by side, the eye can move from the big directional picture to the specific contributors without switching mental gears.
A practical layout places a wide line chart across the top of the dashboard to establish the overall trajectory of a key metric such as revenue, active users, or operating margin. Directly below, a bar chart breaks the same metric into segments such as product lines, regions, or channels, ordered by value so the largest contributors appear first. This vertical arrangement mirrors the natural scan path, letting viewers absorb the trend first and then locate the drivers behind it. Color can link the two views, with the selected bar category highlighted in the corresponding line series or vice versa.
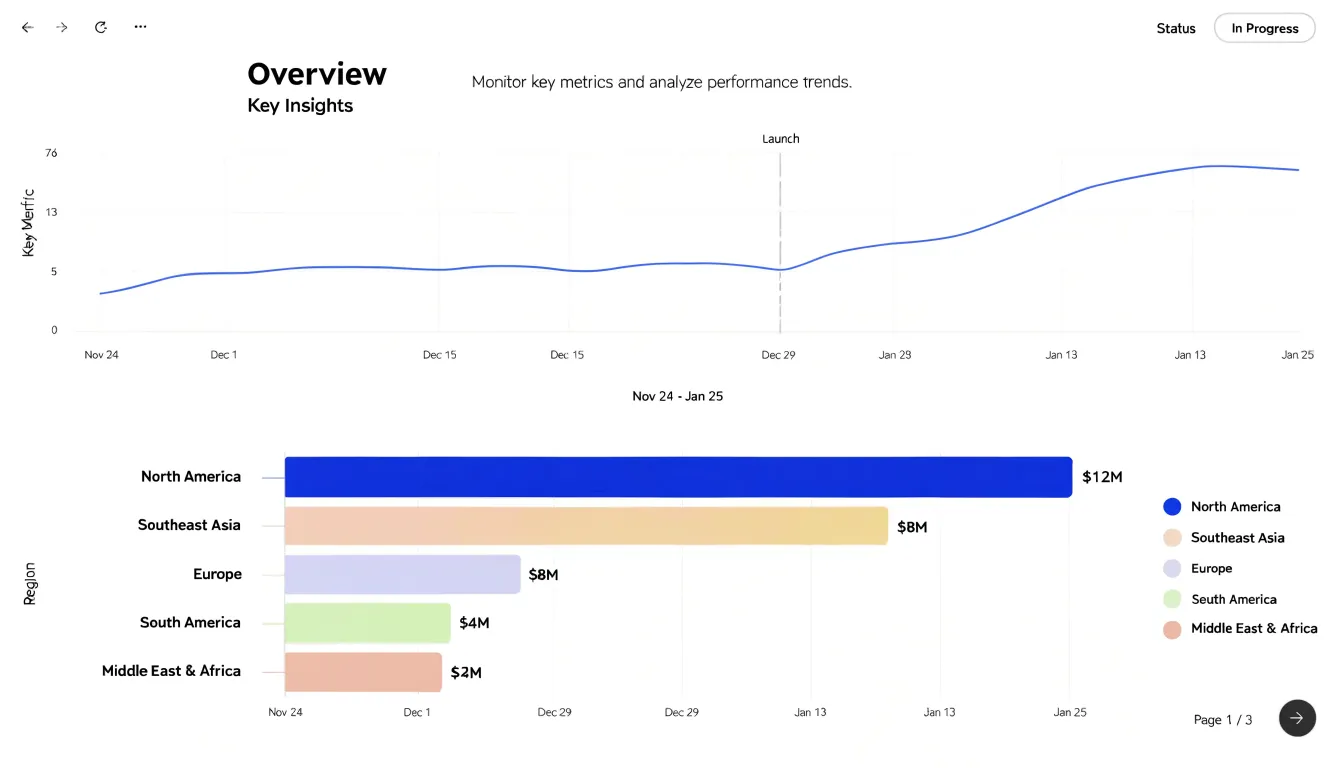
Fast scanning depends on consistency. Use the same time window across both charts, align axis labels, and avoid redundant gridlines or decorative elements that slow comprehension. Annotations on the line chart, such as markers for launches or policy changes, add context without requiring a narrative explanation. The bar chart should carry clear sorting logic so the comparison is instant rather than effortful.
Actionable decision-making emerges when the combined view answers both what is happening and where. A rising line paired with a dominant bar invites a question about concentration risk. A flat line with shifting bar composition signals underlying churn even when the total appears stable. Designing dashboards around this pairing turns raw metrics into a visual argument that executives can read in seconds and act on with confidence.
Frequently Asked Questions
Should I use a line chart or a bar chart?
Use a line chart when values are measured over continuous time and you need to show momentum, trend direction, or pace of change. Use a bar chart when categories are discrete and independent, especially when the goal is ranking or showing magnitude differences.
Why must a bar chart start at zero?
A bar chart uses bar length to encode value, so starting the vertical axis above zero exaggerates differences and misleads readers. A zero baseline keeps each bar’s length proportional to the value it represents.
How many lines can you show on a line chart?
The article says a line chart can carry roughly three to five trendlines on a single chart before readability suffers. Beyond five series, it recommends splitting the data across small multiples or switching to a different visual form.
When should you use a horizontal bar chart?
Use a horizontal bar chart when category names are long or there are many groups to compare, since labels stay horizontal and fully legible without rotation or truncation. If the longest label exceeds about 10–12 characters, a horizontal layout is likely better.
What are common mistakes to avoid in line and bar charts?
Common mistakes include over-cluttering, missing legend keys, improper sorting, and truncated axes. Truncated axes are especially serious for bar charts because starting above zero exaggerates differences between bars.
Are stacked charts good for comparing individual segment values?
Stacked charts are designed to show part-to-whole relationships and totals plus composition, but they are less effective for precise comparisons of individual segments, especially those not at the baseline. If exact sub-component values are critical, use a grouped bar chart or a separate line chart instead.
Tony Astor
Tony writes about data visualization and the tools people use to build charts and dashboards. More about Data Illustrator