Line Chart vs Area Chart: When to Fill the Space
 By Tony Astor ·

Line Chart vs Area Chart
A line chart plots data points connected by a line to show precise trends and rates of change over time, while an area chart fills the space beneath that line to emphasize cumulative volume and magnitude. Use line charts for accuracy and multiple series; use area charts for totals and visual weight.
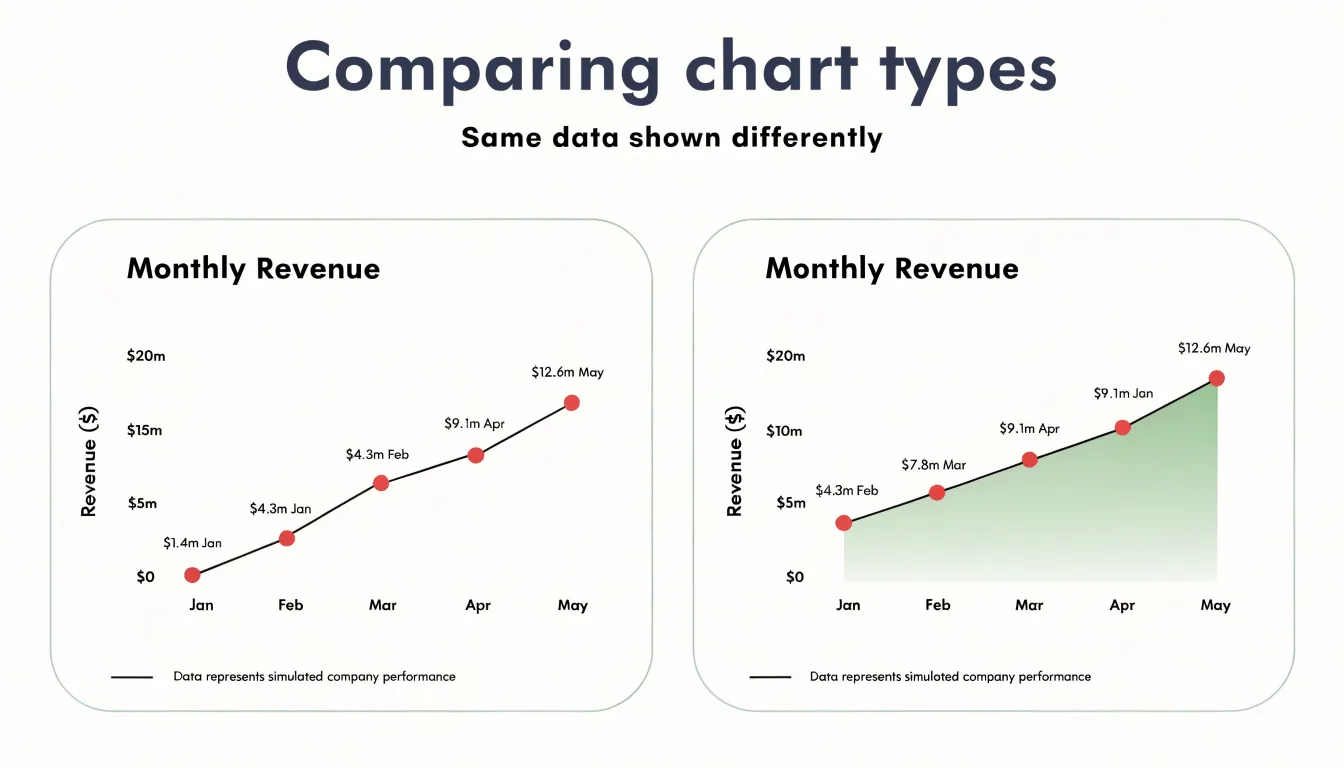
Table of Contents
Line Chart
When the goal is to follow a value as it evolves across a sequence of dates or intervals, the line chart offers one of the clearest visual tools available. Each observation is anchored to a specific position along the horizontal axis, and a continuous stroke connects those positions in order. This structure reflects the underlying continuity of time, allowing a reader to trace a path from one moment to the next and understand how a quantity moved between them. A line chart can carry a large number of historical data points without losing legibility, because the connecting line organizes individual markers into a single, readable trajectory.
Precision is one of the form’s central strengths. Individual markers can be placed at exact measurements, and the line passing through them shows the exact value at any sampled moment. Readers can locate a peak, a trough, or a specific figure on a given date with confidence, which matters when the data supports decisions or comparisons. Rates of change emerge naturally from the slope of the line: a steep segment signals rapid movement, a flat segment signals stability, and a gradual curve indicates acceleration or deceleration. These patterns are visible at a glance without additional annotation.
Just as important is what the line chart leaves out. With no filled regions, shading, or decorative elements competing for attention, the visual field stays open. The eye follows the line and reads the trend directly. This restraint keeps the chart focused on the data and makes it easy to overlay multiple series for comparison, since each line remains distinguishable.
Area Chart
The defining feature of an area chart is the shading that fills the space between the trendline and the baseline. This visual fill transforms the chart from a simple line into a representation of quantity. While a line chart shows where values sit at each point in time, the area chart emphasizes how much is present at any given moment. The shaded region gives immediate visual weight to the data, allowing viewers to perceive the magnitude of the values without reading exact numbers from the axis. This makes area charts effective when the goal is to communicate overall volume or size rather than precise point-to-point comparisons.
Beyond individual positions, area charts excel at conveying cumulative totals. Because the area under the curve represents the sum of values across the time period, the chart naturally highlights aggregate quantities—such as total sales over a quarter, cumulative website traffic, or overall energy consumption across months. The shading draws attention to the total space occupied, making it easier to compare the relative size of different periods or categories at a glance. A larger shaded area clearly indicates a higher total volume, even if peak values are similar.
Area charts can also layer multiple series, with each shaded region stacked or overlaid. This allows viewers to see both the total volume and the contribution of each component, turning abstract numbers into a tangible sense of magnitude and proportion.
Line vs Area
When a chart presents a single data series, the choice between a line and an area chart comes down to what the reader should take away. A line chart strips a data set down to its essential trajectory: a thin stroke tracing values across an axis, with empty space on either side. That emptiness keeps attention fixed on direction, rate of change, and the shape of peaks and troughs. Analysts tracking a stock price, a temperature reading, or a conversion rate often need nothing more than that uncluttered path.
An area chart takes the same underlying line and fills the space beneath it with color or shading. That fill invites the eye to read the chart as a volume or a quantity rather than merely a path, which is useful when the metric represents something cumulative or when total magnitude matters as much as movement. For a single data set, the fill can also lend a sense of presence and importance, drawing the viewer’s focus in a way a bare line might not.
The trade-off is clarity against emphasis. Shading consumes ink and can subtly imply that the distance from the baseline carries meaning, even when the baseline is arbitrary. It also draws the eye toward the filled region, which may distract from the precise position of individual points. Use the minimal line when precision and trend are paramount, and the filled area when accumulated magnitude or visual prominence serves the message better.
Stacked Area Chart
A stacked area chart extends the basic area chart by layering multiple data series on top of one another, so that the total height of the stack represents the combined value of all categories at that point in time. This approach shows how individual components contribute to an overall total while revealing how that total shifts across a continuous time horizon.
To build one, each category is plotted as a cumulative band rather than starting from the zero baseline independently. The bottommost series rests on the x-axis and behaves like a standard area chart. The next series begins where the previous one ends, and so on, with the final band’s upper edge tracing the grand total. The vertical thickness of any single band at a given moment shows that category’s value, while the band’s position in the stack shows where it fits within the whole. This layering makes it possible to read both part and whole from the same visual field without switching between separate charts.
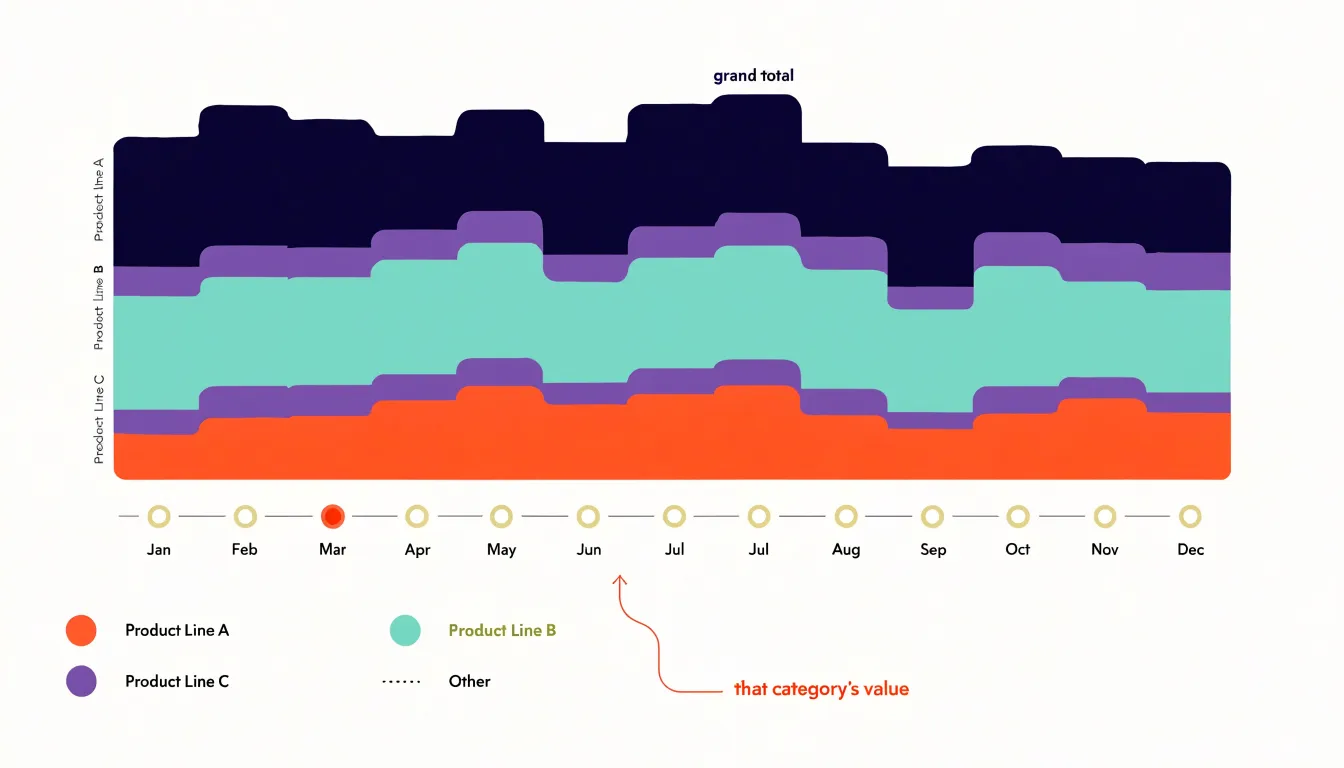
Stacked area charts work best with data that naturally sums to a meaningful total, such as revenue split by product line, website traffic divided by channel, or energy consumption broken down by source. When the categories are consistently ordered and colors remain stable across the timeline, viewers can follow the growth or decline of a specific segment even as the overall total moves. With careful color choices and a clear legend, the chart shows at a glance which categories are expanding their share and which are shrinking.
Overlapping Areas
Unstacked, layered area charts carry a structural flaw that becomes apparent when several data streams share the same plotting space. Each series is drawn as a filled shape, and those shapes stack on top of one another according to their drawing order. When the values of two series run close together or cross repeatedly, the foreground shape physically covers the background one along the shared region. A viewer tracing a line that seems to stop mid-chart has no way of knowing whether the series actually ended, dropped to zero, or is merely hidden beneath a neighbor.
Opacity settings offer partial relief but introduce their own difficulties. Rendering fills at 50% transparency lets some of the covered shape show through, restoring a degree of visibility. The cost is color confusion: wherever two translucent fills overlap, they blend into a third hue that appears nowhere in the legend. With three or more series, the number of distinct blend colors multiplies, and readers must mentally decompose every shaded region into its contributing layers. Darker zones tend to read as higher values even when the darkness results purely from overlapping layers rather than magnitude, so the visual encoding drifts away from the data.
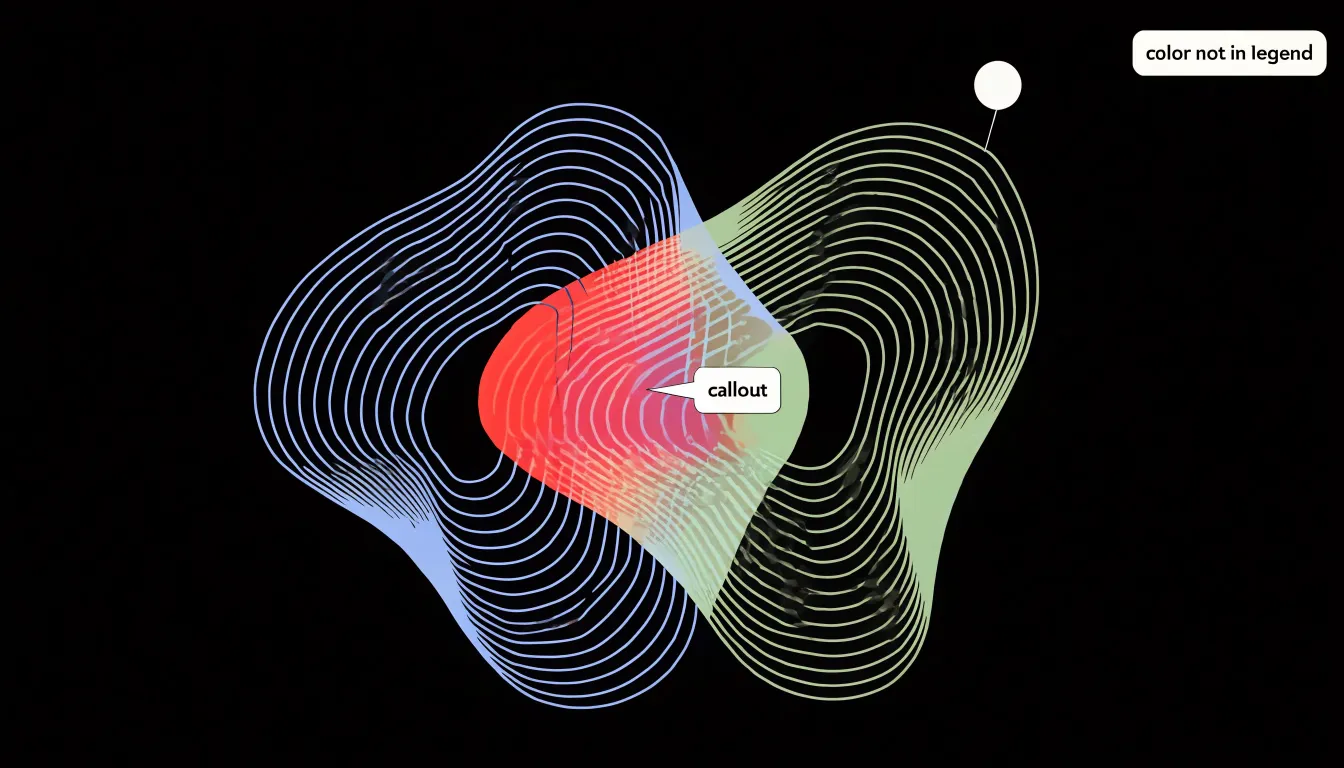
Occlusion also distorts comparison. Analysts comparing peaks, troughs, or crossover points across series cannot do so reliably when segments of one series sit behind another. The foreground series receives disproportionate attention simply because it is fully drawn, while the obscured series vanishes from notice. Small multiples, offset lines, or interactive toggling preserve individual series visibility and let each stream be read on its own terms.
Visual Weight
Visual weight refers to the amount of ink or screen space a chart occupies and the intensity with which that space attracts the eye. An area chart’s solid color block registers immediately as a focal point on the page. However, this density can easily overpower surrounding elements. When large saturated areas are used without restraint, subtle patterns—such as a slight narrowing in a gap between series or a gentle flattening of a trend—become hidden from view.
Balancing visual weight involves controlling color intensity, applying transparency, separating multiple series with white space or outlines, and reserving filled areas for charts meant to anchor a section. Lighter tints and partial opacity allow the underlying grid and labels to show through, reducing the risk of an area chart dominating a dashboard and blinding viewers to slower-moving changes elsewhere.
Visual weight directly shapes how readers move through the page. Solid areas grab attention, often before readers reach smaller elements nearby. Placing a filled area chart next to a line chart or a small table can make the lighter elements appear secondary, regardless of their actual importance. Designers who account for this hierarchy direct attention toward the most critical insight without burying details beneath a heavy block of color.
Color and Shading
Color and shading in area charts direct the audience’s attention to key thresholds and patterns. When using gradient fills, apply a vertical gradient that is darker at the top and lighter at the bottom to create a natural visual hierarchy, drawing the eye upward to the peaks of the data. This subtly emphasizes high values without overwhelming the viewer. Set opacity levels between 30% and 50% for the fill area so gridlines and other data series remain visible while still conveying volume.
For accent colors, reserve saturated hues for the most critical threshold lines or data points. A bold red line at a revenue target or a bright orange fill for a forecast period immediately signals importance. Consistent use of accent colors across multiple charts in a report trains the audience to recognize and prioritize those elements. Limit a single chart to one or two accent colors to prevent visual clutter.
To guide eye movement, apply a gradient that intensifies near a highlighted threshold, such as darkening the fill as it approaches a critical limit. Additionally, use color to differentiate between historical and projected data, pairing a solid fill for past periods with a lighter, semi-transparent fill for future projections.
Zero Baseline
A zero baseline is essential for any area chart because readers interpret the size of the filled region directly. When the y-axis starts at zero, the height of the shaded area is proportional to the value it depicts, so a series that is twice as large occupies roughly twice the vertical space.
Truncating the axis breaks that proportionality. If the y-axis begins at 80 instead of 0, a change from 85 to 95 suddenly fills most of the chart’s height, turning a modest numeric increase into a dramatic visual surge. This distortion is more severe in area charts than in line charts because the fill invites comparison of size, and any nonzero baseline corrupts that comparison in ways readers rarely detect.
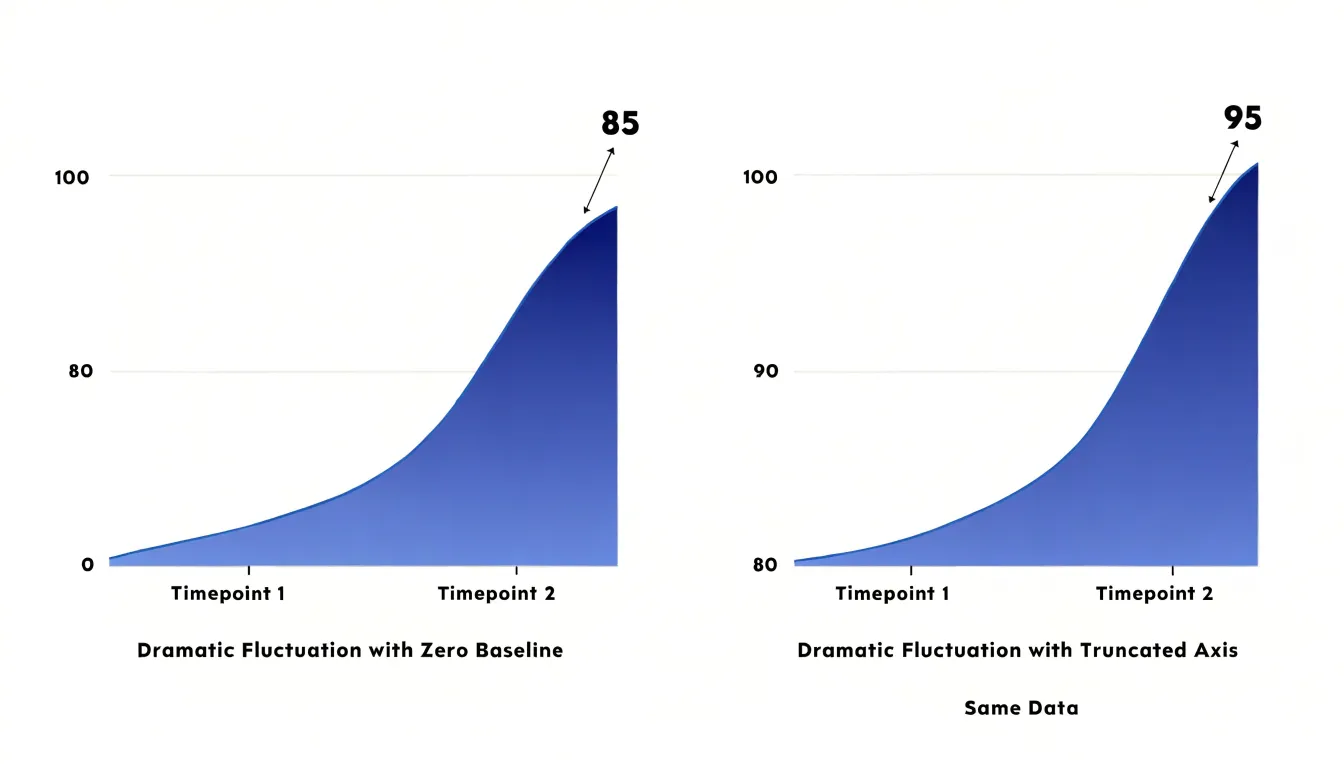
Studies of graphical perception show that people judge quantities by area and height with reasonable accuracy only when the scale is honest. A truncated axis silently rescales every value, which can mislead decision-makers reviewing dashboards, exaggerate month-to-month volatility, and manufacture trends that do not exist in the data. Anchor area charts at zero and reserve truncated axes for line charts, where the absence of fill makes the distortion less pronounced and keeps focus on the shape of change over time.
Small Fluctuations
Unshaded line charts excel at revealing small fluctuations that might otherwise go unnoticed. Without a fill beneath the line, every minor shift in value is rendered as a distinct change in path. This clarity allows viewers to detect subtle variances—such as a slight uptick or downtick—that can be significant in financial analysis or quality control.
In contrast, the solid color or gradient in an area chart can mask minor fluctuations, especially when the chart is small or the data is dense. In a time series with many data points, the fill can blend together, causing small but meaningful variations to get lost. Volatile shifts and micro-trends are also easier to spot with unshaded lines: a sharp, brief spike or dip is clearly delineated as a peak or valley in the line, whereas an area chart’s fill can soften such features. When analyzing high-frequency data or highlighting short-term patterns, stripping away the fill provides the precision needed to detect nuanced changes.
Volume and Scale
Because the human eye is naturally adept at comparing spatial areas, the relative size of filled regions communicates which categories or time periods are larger even without precise labels. This makes area charts effective for highlighting grand metrics—such as total energy storage, annual revenue, total market size, or overall production volume—where the emphasis is on the big picture rather than minute fluctuations.
Furthermore, a continuous fill implies accumulation, reinforcing the idea of growth or decline over time. This is particularly useful for metrics that build upon themselves, like cumulative sales or inventory levels, where the area visually represents the stored quantity. In presentations or dashboards, area charts can anchor the audience’s attention on the overall scale of a phenomenon before drilling into details.
Interactive Charts
When an area chart stacks multiple categories or a line chart displays a dozen series, interactive controls reveal details on demand while keeping the initial view uncluttered:
- Hover tooltips provide precise values for each data point without labeling every marker. For area charts with overlapping layers, tooltips can list all series at a given x-position, clarifying which value belongs to which layer.
- Crosshairs—vertical or horizontal lines that follow the cursor—help users align data points across multiple lines or areas, making comparisons at a specific time or category straightforward and reducing the need for dense gridlines or axis labels.
- Dynamic legend filters let users toggle series on and off. In multi-line charts, clicking a legend item can hide outliers or secondary lines to reduce visual noise. In area charts, toggling prevents occlusion by temporarily removing overlapping layers.
Together, these features let users hover over peaks and troughs to inspect anomalies or filter to compare specific trends, avoiding the need for separate tables or supplementary graphics.
Common Mistakes
Even with the right chart type selected, small design decisions can distort what the data appears to say:
- Stacking non-cumulative data: When underlying values are independent measures rather than parts of a whole, a stacked area chart creates sums that never existed in the data. Readers interpret the top line as a total, inflating apparent magnitude and obscuring individual trends.
- Arbitrary stacking order: Because the shape of each upper layer depends on what sits beneath it, reordering categories can change the visual impression of a series without any change to the data.
- Misleading axis scales: Truncating the vertical axis without clear labeling exaggerates differences, while inconsistent intervals on either axis—such as uneven tick spacing or an unannotated non-linear scale—produce distorted slopes and false comparisons between time periods.
- Unstacked overlaps and visual clutter: Allowing unstacked areas to hide crossing points, or adding excessive gridlines, decorative gradients, and low-contrast color palettes, reduces legibility.
Reviewing each chart against the raw numbers—and asking whether a reader would draw the same conclusions from the table alone—helps catch these errors before publication.
Decision Checklist
- Examine the structure of your data. Count the series and note how they relate. A line chart handles multiple overlapping series easily, while area charts work best with one to three series. Use a stacked area chart if the parts sum to a meaningful whole; use lines if the series are independent measures.
- Consider your audience and context. An executive scanning a dashboard for overall trajectory and magnitude benefits from the visual weight of filled areas. An analyst comparing growth rates across categories needs the precise paths of a line chart. Likewise, a dense report favors the lighter footprint of lines, while a presentation slide often rewards the strong silhouette of an area chart.
- Clarify your reporting goal. Identify the single message the chart should deliver: trends over time call for a line, cumulative volume calls for an area, and part-to-whole relationships over time call for stacked areas. Test whether a reader can answer the central question in a few seconds.
- Sketch a rough prototype of both formats. Plotting your actual data in both styles quickly reveals clutter, overlap, or clarity that abstract rules cannot predict.
Dashboard Applications
In executive reporting, mature dashboards often deploy both chart styles side by side to match specific reporting needs. For example, when a CFO reviews quarterly revenue trajectory, a clean line chart directs attention to the slope of the trend, making inflection points immediately legible. Conversely, a chief operating officer tracking total monthly support tickets benefits from an area chart because the filled region communicates the sheer scale of the workload.
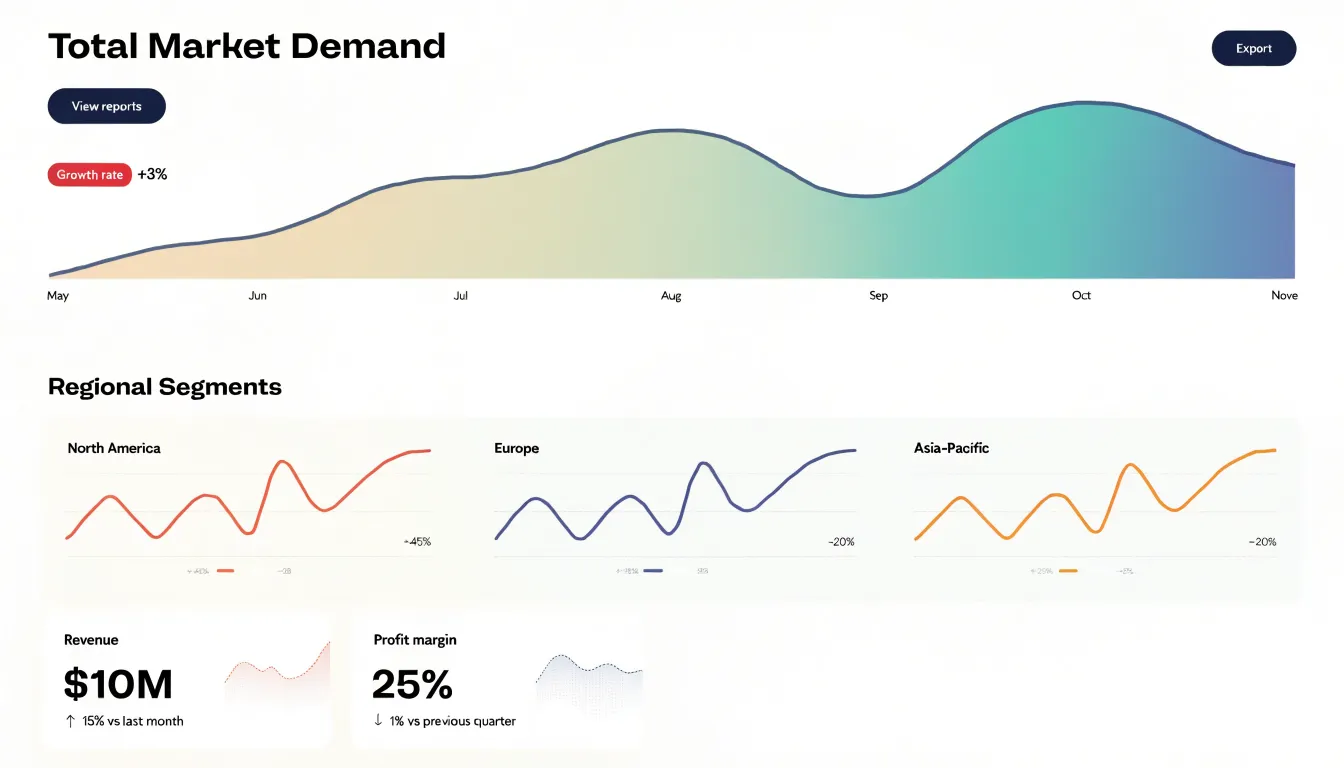
An executive summary page might lead with a prominent area chart showing total market demand, followed by a set of slim line charts breaking that demand into regional segments. Because each format carries a distinct visual weight, the area chart reads as a headline that anchors the viewer in overall magnitude, while the line charts act as supporting detail for granular trend analysis. Board-level viewers often respond to the bold impact of an area chart for messages about scale and momentum, whereas operational teams reviewing daily performance prefer the precision of line charts to detect subtle shifts.
Frequently Asked Questions
When should I use a line chart instead of an area chart?
Use a line chart when precision and trend are paramount, or when the goal is to show a data set’s essential trajectory, rate of change, and peaks and troughs. Use an area chart when accumulated magnitude or visual prominence serves the message better.
Do area charts need to start at zero?
Yes—a zero baseline is essential for area charts because readers interpret the size of the filled region directly, and starting at zero keeps the shaded area proportional to the value. Truncating the axis breaks that proportionality and can exaggerate changes, so the article says to reserve truncated axes for line charts.
What is a stacked area chart best used for?
Stacked area charts work best with data that naturally sums to a meaningful total, such as revenue split by product line, website traffic divided by channel, or energy consumption broken down by source. They show how individual components contribute to an overall total over time, but the article cautions against stacking non-cumulative data because it creates sums that never existed.
Why are overlapping area charts hard to read?
Overlapping area charts can hide one series behind another, so a viewer may not know whether a line ended, dropped to zero, or is merely covered. Opacity can help visibility but creates blended colors not in the legend and can make darker overlap zones look like higher values, while occlusion also distorts comparison.
How can color and shading be used in area charts without overwhelming the chart?
The article recommends vertical gradients that are darker at the top and lighter at the bottom, plus opacity levels between 30% and 50% so gridlines and other data series remain visible. It also says to reserve saturated accent colors for critical threshold lines or data points and limit a single chart to one or two accent colors.
Are line charts better for spotting small fluctuations?
Yes—unshaded line charts excel at revealing small fluctuations because every minor shift is rendered as a distinct change in path. In contrast, an area chart’s fill can mask minor fluctuations, especially when the chart is small or the data is dense.
Tony Astor
Tony writes about data visualization and the tools people use to build charts and dashboards. More about Data Illustrator