Infographic vs Data Visualization: What's the Difference?
 By Tony Astor ·

Infographic vs Data Visualization
An infographic combines editorial copy, custom illustrations, and selected statistics to tell a fixed, linear story that guides readers to a predetermined conclusion. A data visualization maps full, raw datasets onto axes, scales, and interactive controls so viewers can explore and uncover patterns themselves. The core difference is direction: infographics educate; visualizations enable exploration.
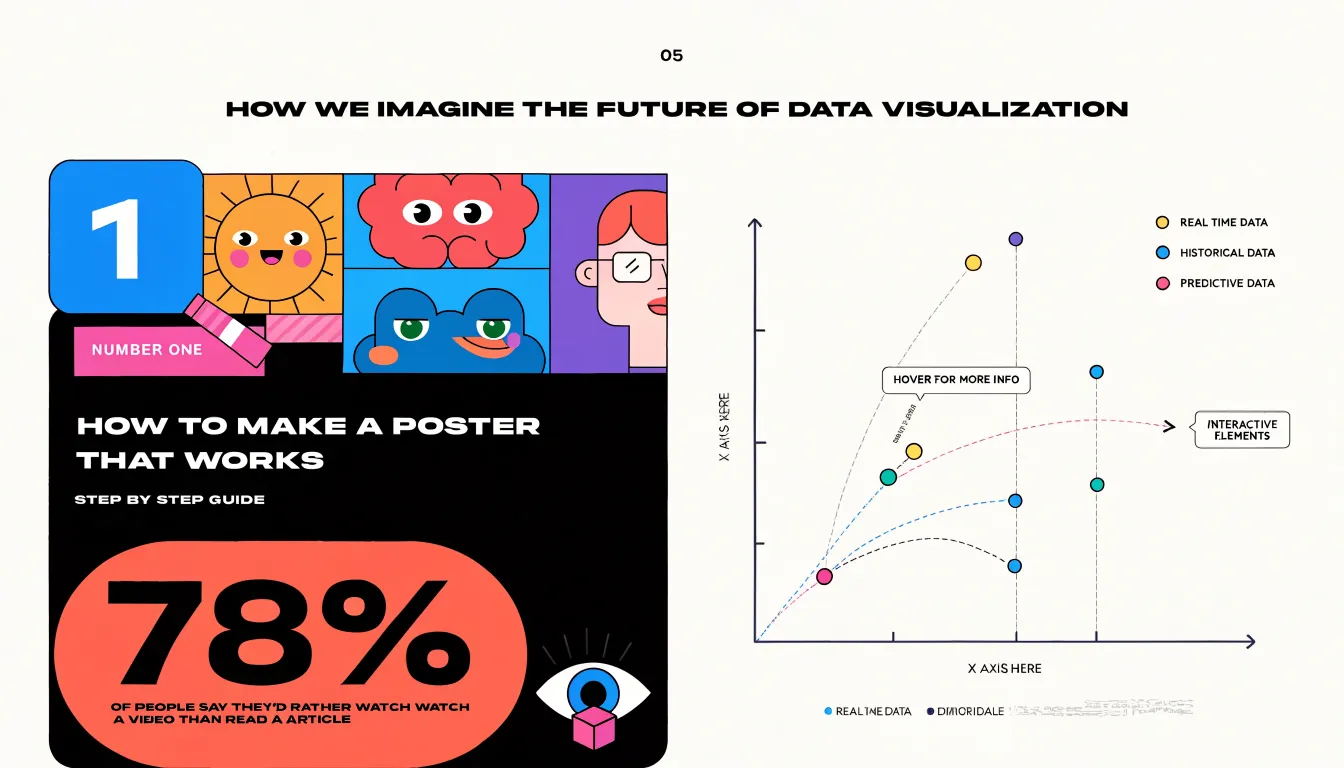
Table of Contents
- Infographic
- Data Visualization
- Core Purpose
- Content Ingredients
- Design Approach
- Audience Engagement
- Static vs Dynamic
- Best Uses for Infographics
- Best Uses for Data Visualization
- Data Accuracy
- Common Misconceptions
- Choosing Your Format
- Combining Both
- Essential Design Principles
- Final Decision Roadmap
Infographic
An infographic brings graphics and text together to tell a single, self-contained story. Its structure rests on three interlocking elements: editorial copy, custom illustrations, and selective statistics. Each element has a distinct job, and the finished piece works when all three align around one clear narrative arc.
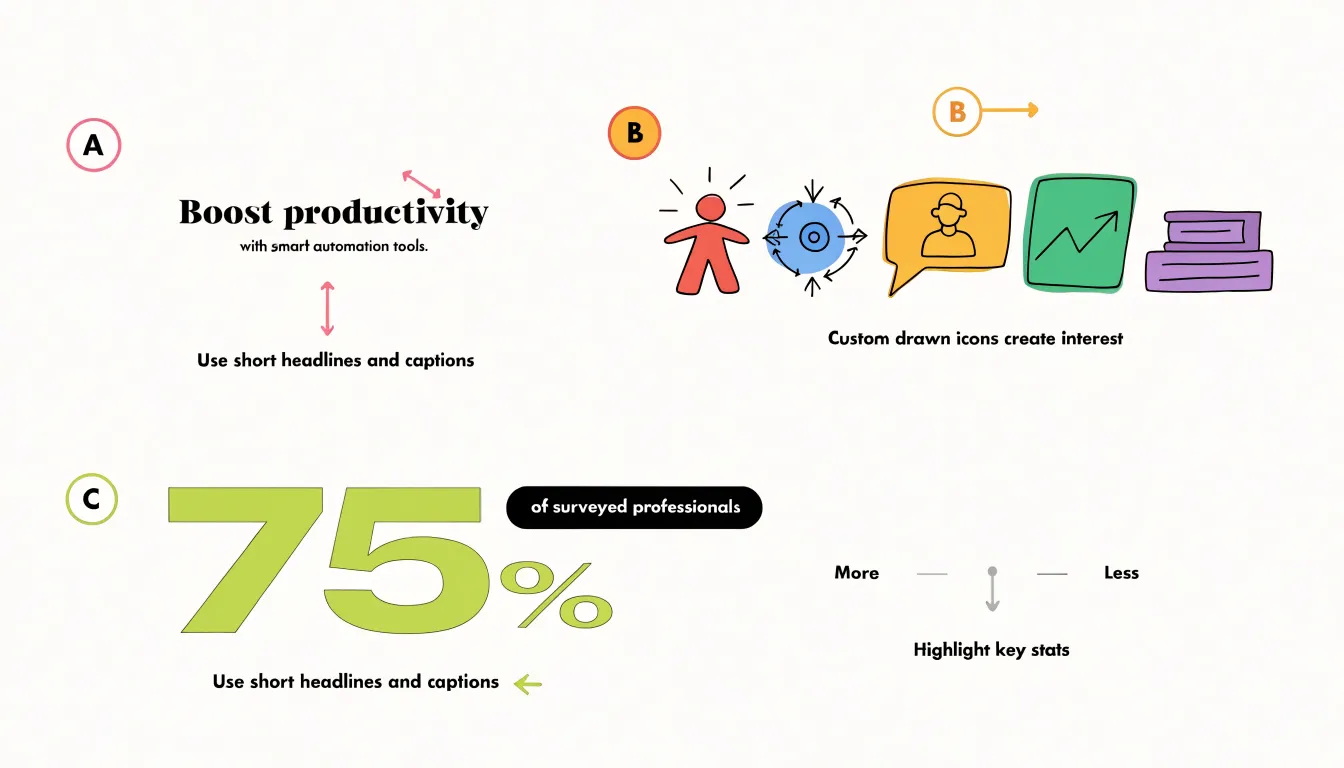
Editorial copy provides the narrative spine. Short headlines, brief captions, and compact explanatory sentences establish the sequence of ideas and guide the reader from point to point. The writing is economical by design, favoring active phrasing and plain language so a passerby can absorb the story in a few seconds of scanning. Captions anchor the visuals and prevent ambiguity, telling the reader what to notice and why it matters.
Custom illustrations supply the visual personality. Icons, characters, diagrams, and stylized scenes are drawn or assembled specifically for the piece, giving abstract information a concrete, memorable form. These drawings create hierarchy through size, color, and placement, leading the eye along a deliberate path. Because they are made for the occasion rather than pulled from a generic template library, they can be tuned to the tone of the story, whether playful, serious, or instructional.
Selective statistics contribute the factual weight. Rather than presenting a full dataset, an infographic isolates a handful of numbers chosen for their punch and relevance. A single large figure, a short comparison, or a simple proportion can carry the core message while the surrounding text and imagery give it context. The selection process is editorial in itself, since the designer decides which numbers earn a place on the page.
These three components succeed when they are choreographed rather than merely placed side by side. The copy introduces the point, the illustration dramatizes it, and the statistic substantiates it, all within a layout that moves the reader quickly from entry to conclusion.
Data Visualization
Data visualization translates quantitative datasets—often containing thousands of rows and dozens of variables—into visual formats that reveal structure buried in spreadsheets. By mapping numbers to visual properties such as position, length, color, and size, it makes relationships visible at a glance:
- Line graphs show how a metric evolves over time.
- Scatter plots reveal clusters and outliers across two variables.
- Heatmaps compress a large matrix of values into a color grid where intensity signals magnitude, presenting many values simultaneously so gradients and hot spots are immediately apparent.
In digital environments, interactivity turns a static chart into an exploratory tool. Users can hover over points for exact values, filter by category, zoom into dense regions, or toggle between views of the same dataset. This lets viewers follow their own questions and uncover patterns—such as seasonal spikes, correlations between variables, or pockets of unusually high activity—that often go unnoticed in summary statistics.
Different audiences use these visual encodings for different jobs. Analysts use them to diagnose and verify findings before drawing conclusions. Executives use them to scan key indicators quickly. Public audiences use them to understand issues that would otherwise require technical background. In each case, visual encoding reduces the cognitive effort needed to interpret numbers, clarifying scale, context, and comparison so viewers have a reliable basis for judgment.
Core Purpose
The primary divide between an infographic and a data visualization is the direction of communication. An infographic is built to educate an audience using a message already settled by its creator. The designer works backward from a conclusion, assembling elements so the piece reads top to bottom as a structured argument. Success is measured by whether the audience absorbs the author’s intended takeaway.
A data visualization is built for exploration. The designer supplies structure, scales, and interactive controls, then steps back so viewers can move through the dataset and discover patterns not known in advance. Questions drive the encounter rather than answers: which regions deviate from the trend, where clusters form, or how a metric shifts over time. The same chart can serve many inquiries, and its value lies in the range of questions it makes answerable.
This divide shapes practical project decisions. An educational infographic can compress, simplify, and omit detail for a general readership that needs context and guidance. An exploratory visualization must preserve granularity and flexibility to support unforeseen lines of inquiry from specialists who bring domain knowledge and their own questions.
Content Ingredients
Sourcing is one of the clearest points of divergence between the two formats. Infographics are built from curated facts. Much like a magazine editor choosing anecdotes for a feature article, a designer or researcher selects a handful of statistics, quotes, or figures for their rhetorical fit.
Data visualizations ingest comprehensive, raw data streams: full datasets, complete logs, sensor readings, or transaction records that have not been pre-filtered for narrative convenience. A charting system connected to a database pulls every row in scope and represents the full population faithfully, including outliers, gaps, and messy values. The designer’s job shifts from editorial selection to visual encoding—choosing axes, scales, and marks that let the underlying structure show through without distortion.
These sourcing models require different workflows. An infographic can be produced quickly from a short list of cherry-picked statistics, and its accuracy depends on the integrity of that list. A data visualization demands a data pipeline: extraction, cleaning, validation, and ongoing updates as the raw stream changes.
Design Approach
Infographics favor artistic layouts that resemble a poster or editorial spread. Designers arrange headlines, icons, illustrations, color blocks, and callout boxes to control pacing and emphasis. Decorative elements set mood and context, and an infographic may devote half its space to illustration and stylized framing to invite browsing and emotional engagement.
Data visualization prioritizes functional clarity, where every mark on the canvas corresponds to a data value and nearly all space is reserved for plotted values and supporting labels. Grid lines, axis labels, tick marks, and legends are calibrated for precision rather than decoration. Designers strip away embellishments such as textured backgrounds, heavy borders, or ornamental typography because they can distort perception or distract from the data signal. White space is used strictly for separation and readability, inviting analytical scrutiny and comparison.
Audience Engagement
Because an infographic follows a linear narrative, the creator holds the interpretive authority and determines the exact order in which information appears. Transitions, numbered steps, and visual flow lines act as signposts that keep the reader oriented along a deliberate path with a clear beginning, middle, and end. The experience is closer to reading a short illustrated article than exploring a dataset, which reduces cognitive load for broad audiences with varying levels of prior knowledge.
Data visualization places the controls in the reader’s hands. Interactive sorting, filtering, zooming, and hover states allow users to test their own hypotheses and define their own path through the information. A sales dashboard, for example, lets a manager isolate a single region, adjust the time range, and compare categories without following any predefined route. This self-directed model accommodates diverse needs within the same audience, since different viewers can pursue different threads from the same starting point.
Static vs Dynamic
The technical format determines how visuals are distributed and maintained. A static artifact is typically a PNG, JPEG, or PDF file exported from a design tool or spreadsheet once the content is finalized. Its dimensions and resolution are locked at export time, and every viewer sees the exact same pixels or printed pages. It can be distributed via email attachments, embedded document images, or printed handouts, and opened on almost any device without a network connection. Updating it requires returning to the source, editing the data or layout, exporting a new file, and replacing the old version wherever it lives.
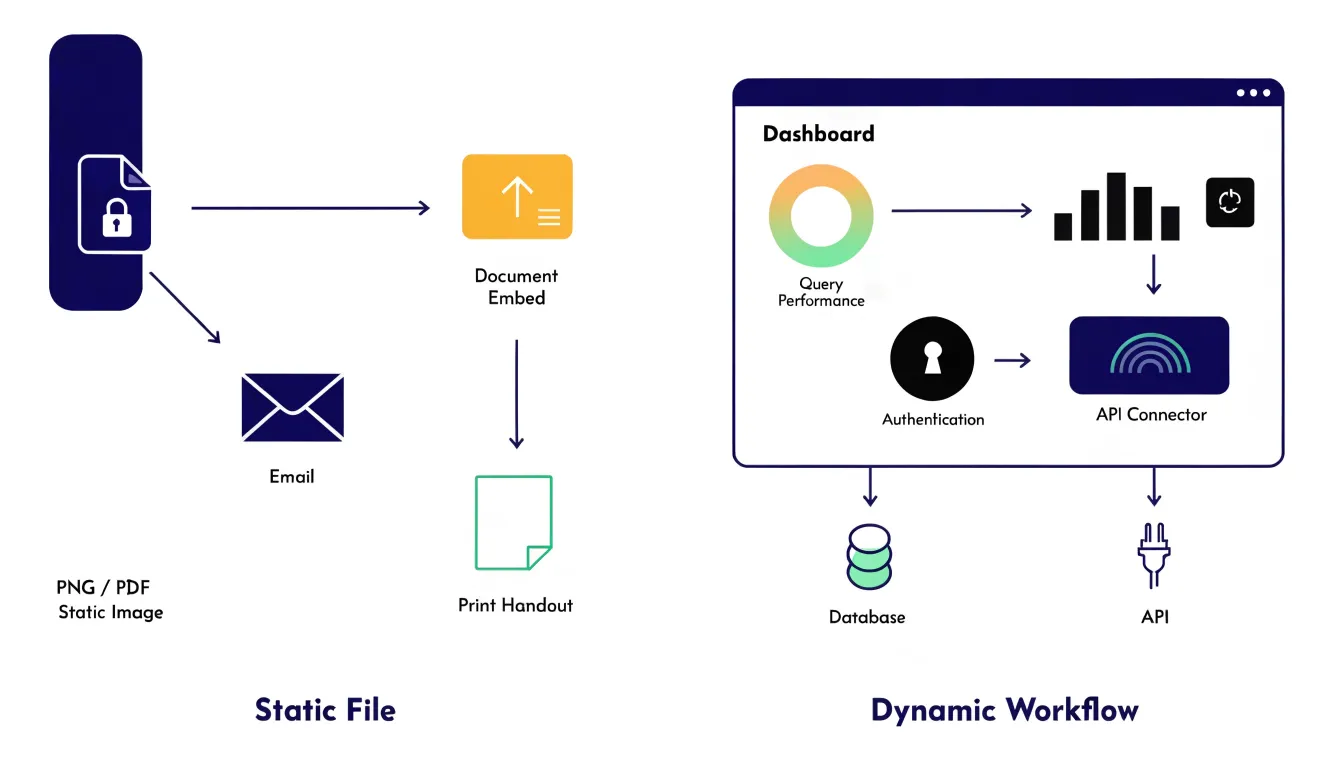
A dynamic dashboard runs inside a browser and pulls values from live database connections, API endpoints, or streaming data pipelines that refresh on a schedule or in response to user action. Because rendering happens at view time through live queries rather than baked-in files, the display stays aligned with the current state of the underlying system. However, interactive web dashboards require supporting infrastructure: authentication, hosting, query performance management, and careful handling of refresh intervals so viewers are not misled by stale or partially loaded data. Teams commonly pair both formats, exporting a static snapshot for presentations and archives while keeping the live dashboard available for ongoing monitoring.
Best Uses for Infographics
Infographics work best when a message needs to land quickly and travel easily across promotional or instructional channels:
- Marketing campaigns and social media promotion: A single scrollable image can distill a product launch, seasonal promotion, or year-in-review into something users absorb in seconds. Because social platforms are built around visual scanning, a well-summarized infographic gives viewers a reason to pause, read, and forward the piece to colleagues or repost it to their own audiences, extending reach without additional ad spend.
- Lead magnets: Marketers frequently package checklists, statistics roundups, or step-by-step breakdowns as downloadable infographics in exchange for an email address. The compact visual format signals immediate value and feels less demanding than a long-form whitepaper, lowering the barrier to conversion.
- Customer onboarding: A single-page visual guide—such as a walkthrough of key features, a map of support channels, or a summary of first-week steps—can replace pages of documentation. It helps newcomers build a mental model quickly and reduces repetitive questions to support teams.
Best Uses for Data Visualization
Data visualization excels where decisions depend on tracking change over time and interpreting complex measurements:
- Business analytics and executive dashboards: Leadership teams rely on live views of revenue, pipeline health, customer retention, and operational metrics. They need to adjust date ranges, drill into segments, and filter by region or product line to spot inflection points without waiting for a new report to be built.
- Financial forecasting: Projections involve multiple scenarios, confidence intervals, and historical baselines that are easier to evaluate when plotted together. Analysts can test assumptions by changing inputs and immediately seeing how the forecast curve responds.
- Scientific research: In fields such as genomics, climate science, epidemiology, and materials engineering, researchers use granular plots and interactive filtering to isolate subsets of data, compare experimental runs, and examine distributions at different scales.
Data Accuracy
Both formats must maintain data fidelity, but they achieve it differently. Infographics rely on stylized summary metrics—such as percentages or averages—derived from the source data. Simplification is expected, so fidelity means ensuring those highlighted figures truthfully represent the underlying dataset and that surrounding icons or typography do not distort the facts.
Data visualizations maintain fidelity by mapping exact records onto meticulously calibrated axes, scales, and labels. Every data point is plotted with mathematical precision, even at the cost of decorative appeal, so viewers can trust the visual spatial relationships for rigorous analysis.
Common Misconceptions
The confusion between infographics and data visualization stems from how marketing vocabulary evolved over the past two decades. When businesses began publishing visual content online, “infographic” became a catch-all label for any image combining numbers, icons, and illustration. Agencies used the word for every chart-heavy poster, timeline, and annotated diagram because it sounded authoritative and shareable, stretching the term to cover nearly any visual that mentioned statistics.
Modern design tools accelerated this blurring. Platforms like Canva and Piktochart offer template libraries where decorative bar charts, pie graphics, and map illustrations sit beside genuine charting components. A creator can drag a stylized bar shape onto a canvas and type in numbers without any underlying data binding, producing an image that looks indistinguishable from a real chart to most viewers. Because these tools prioritize visual polish over data integrity, the line between a graphic that merely depicts numbers and one that accurately renders a dataset disappears during the design process.
This overlap affects how projects are briefed and sold. Clients often request “a visualization” when they want an illustrated poster, and social media metrics reward striking compositions that treat charts as ornamentation. Recognizing this history explains why the two terms remain entangled in everyday practice, even when no dataset drives the output.
Choosing Your Format
Selecting the right format comes down to weighing three factors before opening a design tool:
- Communication goal: Write down whether the primary job is broad persuasion and sharing (which favors an infographic) or detailed exploration and comparison (which favors a data visualization).
- Audience technical literacy: Estimate what viewers already know about the subject and about reading charts. A general audience benefits from a headline-led visual that spares them from interpreting axes, legends, and scales. Quantitatively fluent audiences can handle denser displays if the structure rewards their attention.
- Data complexity: A handful of figures with a clear priority suits a compact, message-first graphic. Datasets with many variables, relationships, or time-based trends require a format that preserves nuance across dimensions.
When these three factors point in different directions, documenting the trade-offs makes the decision transparent and keeps later revisions focused on the project’s primary outcome.
Combining Both
Hybrid graphics blend narrative infographic callouts with interactive data visualization elements to reach audiences on multiple levels. A reader first encounters sequenced callouts, short explanatory labels, and annotated arrows that walk them through the core story. Beneath that narrative layer sits a live chart or map where the same reader can hover, filter, or drill into the underlying numbers. The callouts teach; the interactive elements display.
To build an effective hybrid graphic:
- Sequence the narrative as a guided tour: Place static annotations so they point directly to the most important data points or trends. Keep these callouts legible even when no interaction occurs, ensuring the graphic still communicates its core message in print, in a screenshot, or to a passive reader.
- Use progressive disclosure: Let callouts introduce a concept while interactions reveal the supporting evidence.
- Anchor annotations to data marks: Ensure labels stay attached to their specific data points as filters change the view.
- Separate text from data encoding: Use consistent typography and color hierarchy to distinguish editorial commentary from plotted data, and make sure hover tooltips add context rather than duplicating what the static callouts already say.
Essential Design Principles
Small construction choices can quietly distort the story a dataset tells. Three areas require strict discipline:
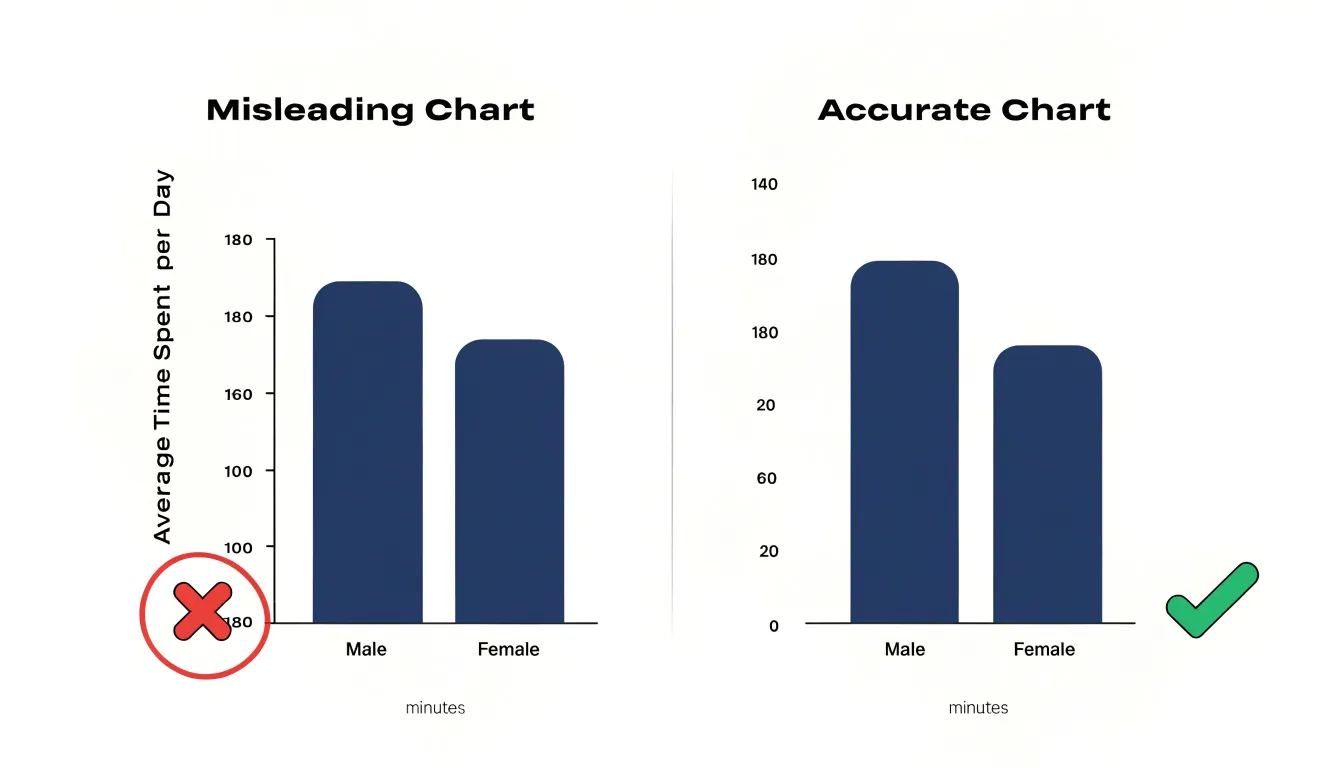
- Honest axis scales: Truncating a vertical axis so it starts above zero exaggerates differences between values, making modest changes look dramatic. Inconsistent intervals, missing labels, or broken axes similarly compress or stretch portions of the scale. Always label axes clearly, use consistent intervals, and state units so readers never have to guess.
- High data-ink ratio: Every gridline, border, shadow, and decorative icon competes with the data for attention. Strip away nonessential elements, limit the number of series in a single chart, and use direct labeling on data marks instead of placing legends far away, which forces the reader’s eye to travel back and forth.
- Accessible, consistent color: Match the palette to the data structure—sequential palettes for ordered values, diverging palettes for data with a meaningful midpoint, and categorical palettes to separate distinct groups without implying rank. Avoid red-green combinations that are invisible to viewers with color vision deficiencies, and never reuse the same hue for different categories across a report.
Final Decision Roadmap
Content teams and analysts can use this step-by-step routine to move from a project request to a finished visual:
- Clarify the communication goal: Write a one-sentence statement defining whether the audience needs a narrative summary or an exploratory view, and share it with all stakeholders to prevent scope drift during production.
- Inventory the available data: Check whether the numbers are clean, complete, and current. If the dataset is thin or provisional, build an infographic around a few verified figures rather than an interactive chart that exposes data gaps.
- Map deadline and technical constraints: A tight turnaround or reliance on basic presentation software favors a static infographic. A longer timeline, access to dedicated visualization tools, and developer support allow for custom interactive dashboards that require testing and iteration.
- Draft a production plan: Assign owners and milestone dates for content sign-off, design review, and a final accuracy check, leaving room for one revision cycle. Test every visual element against the original one-sentence goal and cut anything that does not support it.
- Run a brief retrospective: Record how long each stage took and which resources were strained so the next project starts with better estimates.
Frequently Asked Questions
What is the main difference between an infographic and a data visualization?
An infographic is built to educate an audience using a message already settled by its creator, reading as a structured argument. A data visualization is built for exploration, with the designer supplying structure, scales, and interactive controls so viewers can discover patterns not known in advance.
When should I choose an infographic over a data visualization?
Choose an infographic when the primary job is broad persuasion and sharing, the audience is general, the data is a handful of figures with a clear priority, or the turnaround or basic software favors a static graphic. A data visualization is better for detailed exploration and comparison, quantitatively fluent audiences, and datasets with many variables, relationships, or time-based trends.
Do infographics and data visualizations use the same kind of data?
No. Infographics are built from curated facts—a handful of statistics, quotes, or figures selected for rhetorical fit—while data visualizations ingest comprehensive, raw data streams such as full datasets, logs, sensor readings, or transaction records that have not been pre-filtered for narrative convenience.
How do static infographics and dynamic dashboards differ?
A static artifact is typically a PNG, JPEG, or PDF with locked dimensions and resolution, distributed via email, embedded documents, or print and updated by editing the source and exporting a new file. A dynamic dashboard runs in a browser, pulls values from live database connections, API endpoints, or streaming pipelines, and requires supporting infrastructure such as authentication, hosting, and query performance management.
What common misconceptions blur the line between infographics and data visualization?
The terms became entangled partly because “infographic” became a catch-all label for any image combining numbers, icons, and illustration. Modern template tools also let creators type numbers into decorative bar shapes without underlying data binding, producing images that look like real charts to many viewers.
What design principles help keep charts accurate and accessible?
Use honest axis scales—truncating a vertical axis so it starts above zero exaggerates differences—along with a high data-ink ratio and accessible, consistent color. Avoid red-green combinations that are invisible to viewers with color vision deficiencies, and never reuse the same hue for different categories across a report.
Tony Astor
Tony writes about data visualization and the tools people use to build charts and dashboards. More about Data Illustrator