Icon Array: Communicating Risk and Proportions Visually
 By Tony Astor ·

Icon Array
An icon array is a grid of individual icons or dots where each symbol represents one unit in a population, such as one person or one event. Showing the full group with affected units highlighted makes absolute counts and proportions directly visible, reducing denominator neglect and helping viewers grasp risk, ratios, and part-to-whole relationships at a glance.
Table of Contents
Icon Array
An icon array uses individual dots or icons to represent distinct units within a population, making absolute numbers and ratios immediately tangible. Each dot stands for one person, one event, or one item, and the total number of dots corresponds to the full population being described. This direct one-to-one mapping allows viewers to see the actual count of affected and unaffected individuals rather than relying on percentages or abstract fractions. For example, if a risk affects 10 out of 100 people, an icon array displays 100 dots with 10 highlighted, showing both the proportion and the absolute number.

This approach is particularly effective for communicating health risks, where understanding the difference between a 10% risk and a 10-in-100 risk can be crucial. Presenting data this way reduces cognitive effort and helps people grasp the magnitude of a risk or the size of a subgroup within a larger context. It also makes comparisons straightforward: two icon arrays side by side can show the effect of a treatment or the difference between two groups.
The visual simplicity of dots or icons allows for quick scanning and immediate comprehension, even for audiences with low numeracy. Icon arrays can also be customized with different colors or shapes to denote various categories, such as affected versus unaffected, or different outcomes. This flexibility makes them suitable for applications ranging from medical decision aids to public health campaigns.
Grid Layout
When a statistic is described as forty percent, the number floats free of any visual reference, requiring mental arithmetic to translate. A structured grid removes that step. By laying out one hundred individual marks across a ten-by-ten arrangement, the whole group becomes visible at once, and any percentage appears as a filled subset within that fixed field. Forty percent becomes forty marks that readers can see and count without effort.
The rigid rows and columns give the eye a reliable scaffolding: each row holds ten units, so every horizontal line reads as a clean ten percent band, and partial rows communicate fractions of ten at a glance. Readers can compare two figures by noting how many rows each one covers, or judge a small proportion by spotting a single filled square among the empty field.
Custom grid sizes work the same way for different purposes: a five-by-five or twenty-by-five arrangement can be tuned to the population being described, keeping the total count meaningful while preserving the anchoring effect of a bounded whole. Because the empty marks remain visible alongside the filled ones, the audience sees the whole alongside the part, which guards against exaggerating a modest share or understating a large one.
Risk Communication
Medical decisions often hinge on probabilities that are difficult for patients to translate into lived experience. A statement that a treatment carries a 12 percent chance of a serious side effect reads as an abstraction. Presenting that figure as an array of one hundred icons with twelve marked gives the number a visible shape.
Presenting outcomes in a consistent frame, such as one hundred figures for every comparison, lets patients weigh benefits and harms on a common footing. Someone considering a therapy can see how many icons represent people helped, how many represent people unaffected, and how many represent those who experience an adverse event. That side-by-side view supports informed deliberation rather than a reaction to a single alarming statistic. The array also counteracts the tendency to overestimate small probabilities or to focus on the numerator while ignoring the denominator.
Evidence from risk communication research indicates that icon arrays improve understanding across varied levels of numeracy and health literacy. Patients who view arrays tend to report clearer comprehension and greater confidence in their judgments. Clinicians can use these displays during consultations to anchor discussion in a shared visual reference, allowing patients to point to specific patterns and ask focused questions.
Design Basics
When designing an icon array, the choice of colors and symbols shapes how quickly and accurately a reader grasps the data. The guiding principle is recognizability: each icon should depict a shape or figure that the audience understands without explanation. A simple human silhouette, a filled circle, or a standard household symbol carries meaning instantly, whereas an abstract or unfamiliar glyph forces the reader to pause and interpret. Familiar iconography eliminates this decoding step and prevents cognitive overload.
High-contrast palettes separate the highlighted elements from the background and from each other, so the eye can group and count without strain. A dark, saturated color against a pale neutral background creates a clear figure-ground relationship, and a single accent color reserved for the emphasized category keeps focus anchored. Limiting the palette to two or three distinct hues prevents visual clutter, since each additional color asks the reader to hold one more association in mind. Colors should also carry intuitive associations where possible, such as warm tones for risk or cool tones for neutral categories, to reduce the mental work of remembering what each shade represents.
Consistency ties these decisions together. Using the same icon for every member of a category and the same color across all panels of a graphic lets readers build a stable mental model they can apply throughout, improving both comprehension and recall.
Denominator Transparency
Denominator transparency is the practice of displaying the full reference group in a graphic so that viewers see affected and unaffected individuals side by side within a single frame. Many statistical messages report only a numerator, such as the number of people who experience a side effect or contract a disease. When that number appears alone, readers have no anchor for judging whether it is large or small.
Showing the entire group from which the numerator was drawn directly addresses denominator neglect—the well-documented tendency to focus on the salient count while ignoring the base against which it should be evaluated. A message stating that a treatment causes a reaction in 10 people invites alarm or dismissal depending on whatever comparison the reader supplies from memory. Placing those 10 highlighted figures among 990 unchanged ones transforms the fact into a visible proportion.
The full array also communicates the scale of the reference population, making clear whether the denominator is 100, 1,000, or a larger group. Because the graphic carries its own context, it reduces reliance on prior knowledge or external framing, giving readers the perspective needed to interpret a risk or rate in proportion to the whole.
Public Health
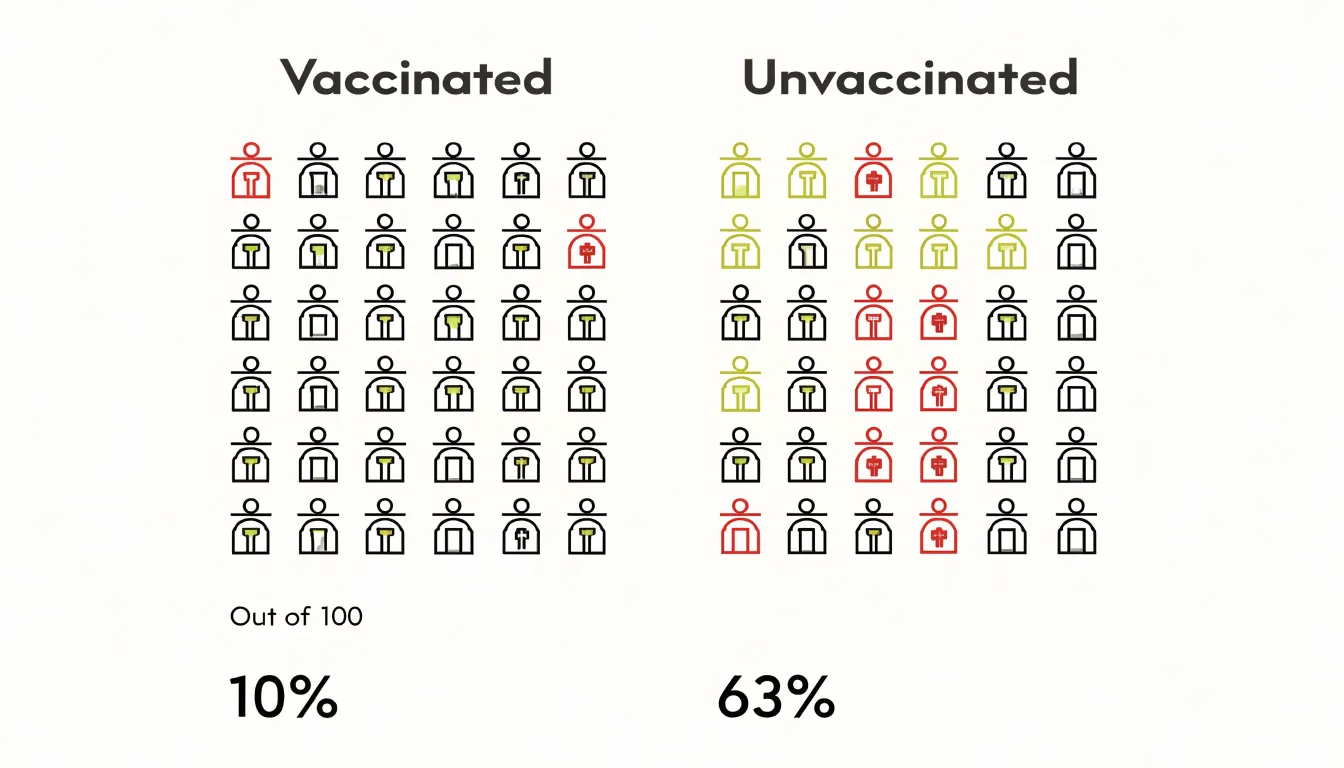
During a disease outbreak, public health agencies must communicate numbers that are easily misinterpreted. An infection rate of one in fifty or a vaccine efficacy of ninety percent is technically accurate, yet can fuel either undue alarm or unwarranted complacency across audiences with varying numerical literacy.
When an outbreak unfolds, agencies can publish icon arrays showing how many people out of a thousand are likely to become infected under current conditions, or how many vaccinated versus unvaccinated individuals might fall ill. A small cluster of highlighted human figures communicates a limited risk more calmly than a headline percentage that readers might inflate in their imaginations, while a larger cluster conveys seriousness without requiring alarming language.
Icon arrays also support transparent communication about vaccination efficacy. Showing two side-by-side grids—one representing outcomes among vaccinated people and one among unvaccinated people—allows audiences to compare hospitalization or infection counts at a glance. Pairing these arrays with clear labels and consistent denominators helps health agencies communicate rapidly changing outbreak data in a form that informs without inflaming.
Financial Decisions
Financial planners face a similar challenge when presenting investment odds to retail investors. Risk profiles, portfolio allocations, and historical loss probabilities all involve uncertainty, which is difficult to convey in words alone. A verbal description such as “moderate risk” means different things to different clients, while a single performance figure can create a false impression of certainty.
By representing a population of hypothetical scenarios as a grid of small symbols, planners can show clients precisely how many scenarios ended in loss, how many produced gains within a particular band, and how many fell outside expectations. This supports several practical tasks:
- Risk profiles: Planners can display the range of outcomes associated with a given tolerance level, helping clients see that a profile describes a distribution rather than a promise.
- Portfolio allocations: Side-by-side arrays can compare how different mixes of assets behaved across historical periods, making trade-offs between volatility and return concrete.
- Historical loss probabilities: In a sample of one hundred comparable periods, a client can see the exact count of periods that involved a drawdown beyond a stated threshold.
Planners should accompany such displays with clear labels, the time horizon covered, and a reminder that historical patterns do not guarantee future results.
Design Pitfalls
Several recurring design pitfalls can quietly distort the statistical proportions an icon array is meant to convey:
- Inconsistent icon sizing: When some icons are drawn larger than others to emphasize a category or add visual variety, readers tend to interpret the larger symbols as representing greater quantities. Even a modest difference in area can shift perceived proportions, so every icon should remain identical in dimensions.
- Confusing spacing: Irregular gaps between icons can suggest relationships or groupings that do not exist in the data, and inconsistent padding between rows or columns can make one segment appear denser or more prominent. A uniform grid with even gutters keeps attention on the icon count.
- Deceptive grouping: Placing icons of one category together in a block while scattering another category across the array can lead readers to perceive clusters as larger or more important, regardless of actual totals. Grouping can also obscure part-to-whole relationships when the eye reads a tight cluster as a single visual mass.
- Visual ambiguity: Icons with internal detail that draws attention to specific figures, color or shading that implies hierarchy where none exists, and partial icons at the edges that suggest fractional values without explanation all introduce ambiguity into a countable representation.
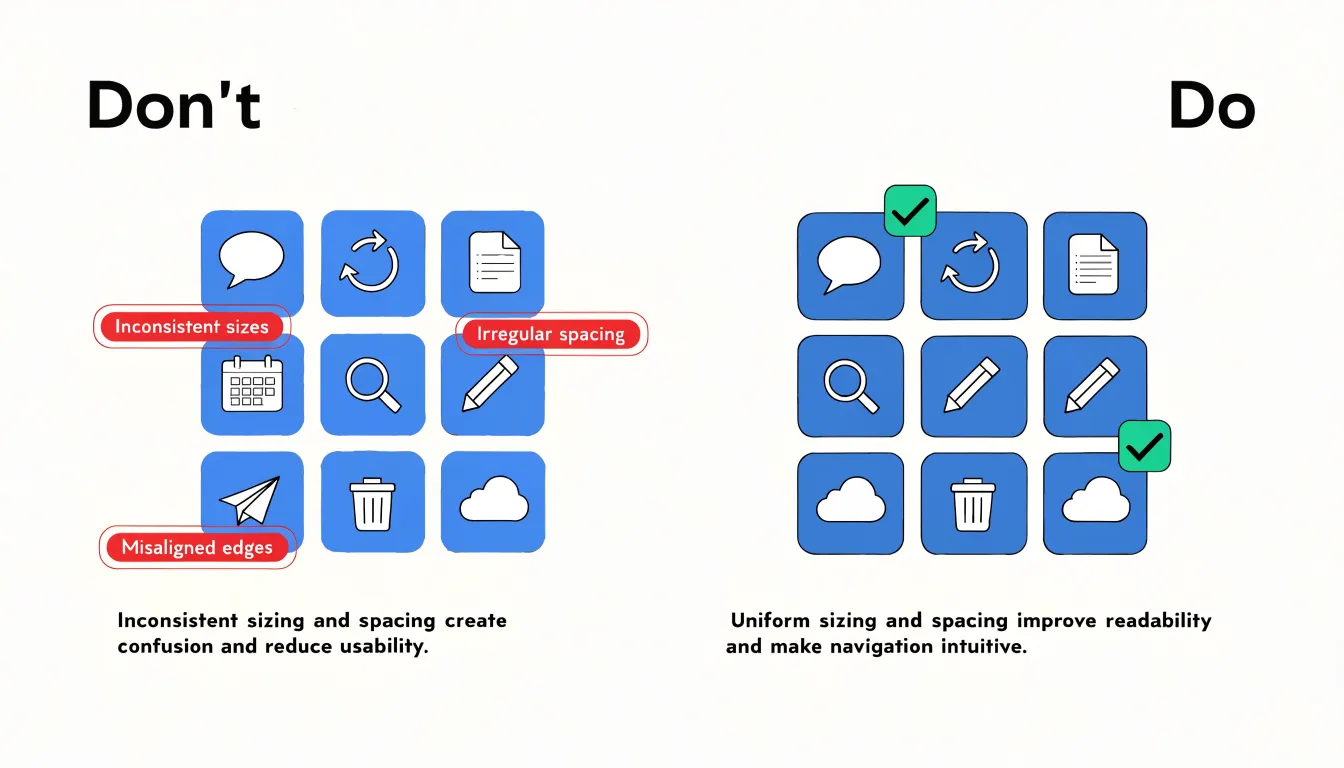
To avoid these pitfalls, fix icon size and spacing before adding styling, verify that visual density matches the underlying numbers, and test the finished array with readers to confirm their impressions align with the actual statistics.
Color and Symbols
Strategic focal points guide the viewer’s eye to the most important elements in an icon array. By varying position or isolation, a designer can create a natural hierarchy that directs attention to critical data points, such as setting a cluster of icons apart from the rest to signal significance without additional labels. (While varying size can also create a focal point, it should be used with caution so it does not distort perceived quantities.)
Selective color emphasis works alongside focal points. Using a distinct hue for key outcomes while keeping secondary data in a muted palette ensures that highlighted elements stand out without visual noise. Intuitive metaphors further aid comprehension by linking abstract data to familiar concepts: icons shaped like people, houses, or coins can represent population, households, or currency. Restraint is key: color should be used sparingly to avoid overwhelming the viewer, and metaphors must be unambiguous.
Interactive Arrays
Interactive icon arrays turn a static chart into a space for exploration. While the underlying grid stays fixed to preserve the visible ratio between filled and unfilled symbols, interactive layers add precision and flexibility:
- Tooltips: Hovering over a symbol can reveal the exact value it represents—whether a single person, a thousand dollars, or one percentage point—providing immediate feedback without requiring the viewer to decode a legend.
- Filters: Users can narrow the array to a subgroup, such as an age bracket or region, while preserving the overall structure. Because icons rearrange or recolor according to the selected subset, users can compare the filtered view against the full picture to see how proportions shift.
- Dynamic scenario toggles: Users can switch between alternative assumptions, such as changing a base rate or a treatment effectiveness value, and watch the array update. Each toggle recalculates the filled icons while keeping the total symbol count constant, making the effect of the change directly visible.
These features invite users to test their own intuitions, form hypotheses, and immediately see the consequences rendered in the same familiar grid.
Mobile Layouts
A grid that reads clearly on a desktop monitor can collapse into an unreadable cluster of tiny shapes on a phone. Icons below roughly 16 to 20 pixels tend to blur together and lose fine internal details, so a mobile array must either reduce its column count or allow icons to wrap into additional rows.
A common technique is to define the grid using relative units and CSS Grid’s auto-fit or auto-fill behavior, letting the browser recalculate the number of columns as the viewport narrows. Media queries can then adjust the base icon size at defined breakpoints, stepping down from 40 pixels on wide layouts to 24 or 20 pixels on handheld devices while preserving the ratio between icon width and gutter spacing. Padding and margins should scale proportionally, often using viewport-relative or clamp-based calculations, so the grid retains balanced whitespace instead of crowding at the edges. A slight increase in icon stroke weight or a simplification of internal glyph detail can also preserve legibility at reduced sizes.
Interaction adds another layer: touch targets benefit from at least 44 pixels of tappable area even when the visible icon is smaller, which can be achieved by extending the clickable region beyond the icon’s drawn boundary. Testing across real device widths, rather than relying solely on browser emulation, reveals how the array reflows at awkward intermediate sizes. Allowing horizontal scrolling for very large arrays is sometimes a pragmatic fallback, though it introduces usability costs.
Accessibility
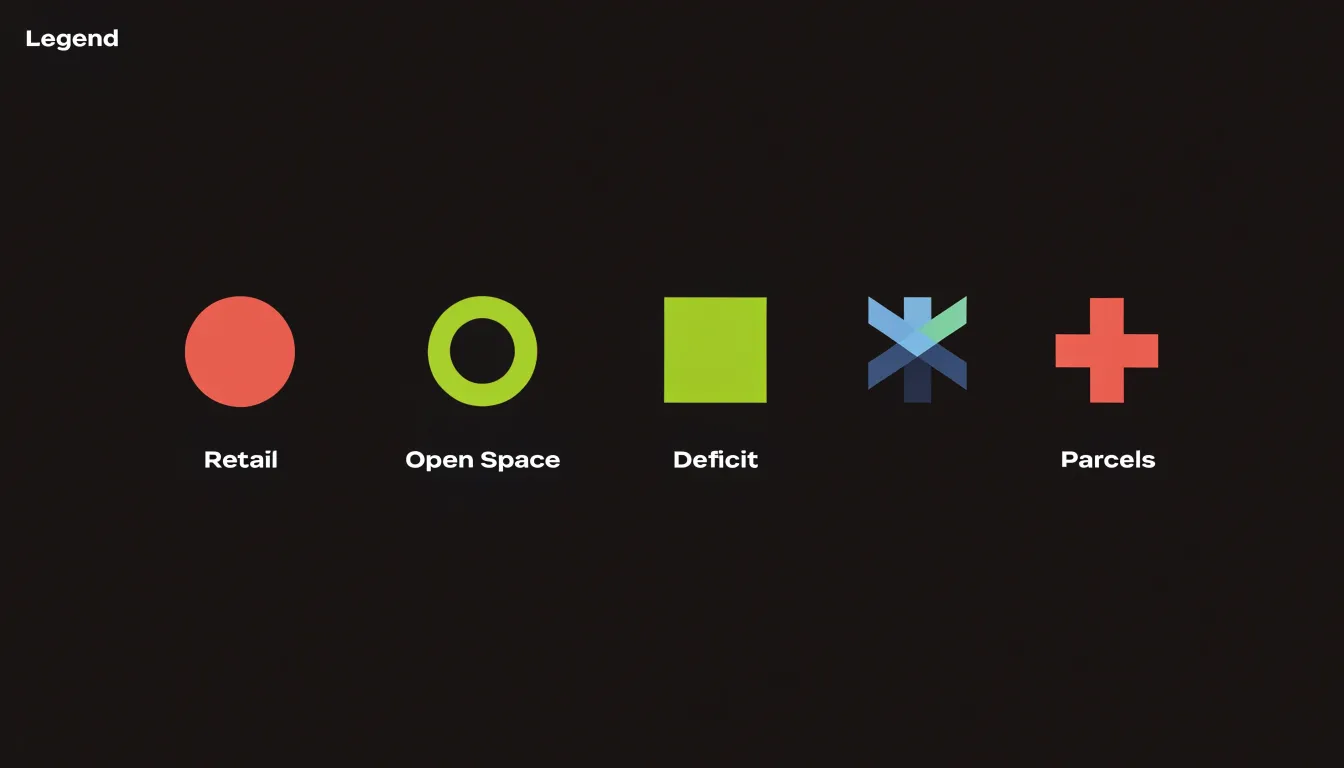
Roughly one in twelve men and one in two hundred women experience some form of color vision deficiency, making color alone an unreliable channel for critical information. Following the Web Content Accessibility Guidelines (WCAG), text and graphical elements must maintain sufficient contrast against their backgrounds, and every color-coded category should be paired with a distinct shape, pattern, or label. A filled circle, a hollow ring, a square, and a cross can each represent a different outcome, keeping a red-green distinction legible to someone who cannot perceive the hue difference. Consistent placement and ordering of icons add a second layer of redundancy, letting users track categories by position as well as appearance.
For users who rely on screen readers or other assistive technology, every chart should carry a concise alternative text description that states the underlying data directly, such as the count of affected versus unaffected individuals and the total sample size. In web contexts, ARIA roles and descriptive captions ensure the information is announced in a logical order, and providing a data table alongside or beneath the graphic gives all users an equivalent path to the numbers. Finally, generous icon sizing and clear spacing benefit users with low vision, and testing the array under simulated colorblindness and at high zoom levels catches problems early.
User Testing
User testing verifies whether an icon array communicates risk accurately. Qualitative methods such as think-aloud interviews and focus groups reveal which elements individuals notice and how they derive meaning. In a think-aloud session, participants verbalize their thoughts while viewing the visualization; for instance, a participant saying, “I see ten sick people out of a hundred,” confirms they grasp both the numerator and denominator. Focus groups allow participants to discuss and compare interpretations, uncovering shared misunderstandings. These methods are often supplemented with structured questionnaires that ask participants to estimate proportions or compare risks, yielding quantitative comprehension data.
Eye-tracking adds a physiological dimension by recording gaze patterns through fixations and saccades. A typical finding is that people focus on the highlighted cases (such as affected individuals) while neglecting the background population, leading to an overestimation of risk. Metrics like time to first fixation and dwell time can also indicate confusion or search inefficiency; for example, excessive time spent scanning the legend suggests the array is poorly labeled.
Combining these methods provides a complete picture: think-aloud data explain why people look where they do, while eye-tracking shows where they actually look. Iterative testing with diverse audiences identifies design flaws, such as ambiguous icons or insufficient contrast, ensuring the visualization works across different levels of numeracy and visual literacy.
Comparisons
When communicating a small number—such as a risk of two percent or a success rate of one in fifty—the visual format matters enormously. Pie charts struggle here because a two percent slice is a sliver so thin that viewers can barely see it, and size estimates vary wildly. Bar graphs fare slightly better, but when bars are short relative to the axis, differences between them compress into a narrow range that the eye cannot easily resolve.
Icon arrays avoid both problems by translating the percentage into discrete symbols. Two percent becomes two colored dots standing out against ninety-eight pale ones. Because people are naturally good at comparing small whole numbers of objects—a capacity that fails when the same quantity is encoded as area or angle—viewers grasp the magnitude without estimating an angle or reading a scale. The advantage grows as the percentage shrinks: a one-in-a-thousand risk is nearly invisible in a pie chart but becomes one clear dot among a thousand in an appropriately sized array. For rare events, screening outcomes, or uncommon side effects, this transparency prevents exaggerated or minimized impressions.
Overview
In executive reporting and dashboards, icon arrays should be reserved for metrics that benefit most from part-to-whole clarity: completion rates, population coverage, response distributions, and figures where the size of a group matters more than its exact decimal value. Placing a single icon array beside a headline number gives decision-makers an immediate sense of scale before they read the supporting detail.
To integrate icon arrays effectively across a dashboard:
- Standardize encoding: Choose one icon, one unit value, and one color scheme, and apply them across all panels so a filled symbol always means the same thing.
- Label explicitly: State the unit in the legend (e.g., each icon represents 100 people or 1% of the base) and display totals next to the array.
- Align layouts: Keep arrays at modest sizes with generous spacing, positioned near the metric they explain. When several arrays appear together, keep row and column counts identical so viewers can compare them by shape alone.
- Build in interaction and accessibility: Use tooltips, filters, and hover states to extend usefulness without cluttering the default view, and pair colors with labels, patterns, and text tables for screen readers and print reports.
- Document standards: Record these choices in a shared style guide so future analysts extend the dashboard consistently, and review arrays periodically to confirm they still reflect current data definitions and audience needs.
Frequently Asked Questions
What is an icon array?
An icon array uses individual dots or icons to represent distinct units within a population, with each dot standing for one person, event, or item. The total number of dots corresponds to the full population, so viewers can see affected and unaffected counts rather than relying on percentages or abstract fractions.
How do icon arrays help communicate health risks?
Icon arrays make probabilities visible, such as showing a 12 percent side effect chance as 100 icons with 12 marked. They let patients compare people helped, unaffected, and those with an adverse event on a common footing, and research indicates they improve understanding across varied levels of numeracy and health literacy.
Why is denominator transparency important in an icon array?
Denominator transparency displays the full reference group so viewers see affected and unaffected individuals side by side within one frame. This directly addresses denominator neglect and helps communicate whether the denominator is 100, 1,000, or a larger group.
Can icon arrays be used for financial decisions?
Yes, financial planners can represent a population of hypothetical scenarios as a grid of small symbols to show how many scenarios ended in loss, produced gains within a band, or fell outside expectations. Planners should accompany such displays with clear labels, the time horizon covered, and a reminder that historical patterns do not guarantee future results.
What are common design mistakes to avoid with icon arrays?
Avoid inconsistent icon sizing, confusing spacing, deceptive grouping, and visual ambiguity. Icons should remain identical in dimensions, spacing should be uniform, and the finished array should be tested with readers to confirm their impressions align with the actual statistics.
How do you make an icon array accessible and mobile-friendly?
For accessibility, color alone is unreliable because of color vision deficiency, so follow WCAG contrast guidance and pair color-coded categories with distinct shapes, patterns, or labels; provide alternative text and a data table for screen reader users. On mobile, icons below roughly 16 to 20 pixels tend to blur together, so reduce column count or allow wrapping, and use touch targets of at least 44 pixels.
Tony Astor
Tony writes about data visualization and the tools people use to build charts and dashboards. More about Data Illustrator